Gold @ Yearly Highs — Pullback, Not Panic. Patience @ HTF LevelsNew year, fresh perspective. After a 2-month mental reset, I’m back watching Gold from a higher-timeframe lens.
Price has expanded into yearly highs and is now pulling back into prior weekly value — a normal rebalancing phase, not immediate weakness. Multiple Weekly FVGs below have already served as fuel for the move up, and current price action looks more like liquidity clearing and position adjustment than trend reversal.
With the Dollar under pressure and macro volatility elevated, I’m prioritizing location over prediction. I’m not chasing breakouts here — I’m waiting for sell-side runs into HTF zones, acceptance, and clean displacement before considering longs.
This is a patience environment. Best trades will come from pullbacks and reactions, not impulse.
Let price show its hand.
Dollar

xauusd whats next?XAU/USD – Comprehensive Technical Indicator Review
Date: January 5, 2026
Spot Reference: ~$4,404
Primary Regime: Structural Bull Market
Secondary Regime: Short-term consolidation / digestion
1. Multi-Timeframe Market Structure
Weekly Timeframe
Structure: Higher highs and higher lows intact for 14 consecutive months.
Candle Anatomy: Recent weekly candles show large real bodies with shallow upper wicks, indicating strong acceptance of higher prices rather than exhaustion.
Market Phase: Late-stage trend expansion, not distribution.
Key Observation: No weekly bearish engulfing, no volume climax, no trendline violation.
Conclusion (Weekly): Bull trend intact; pullbacks are corrective unless $4,200–$4,250 breaks.
Daily Timeframe
Channel: Ascending channel remains valid; price is currently trading in the upper half, not at channel resistance.
Impulse vs Correction: The 2025 rally leg was impulsive; current action is corrective but shallow (bullish characteristic).
Daily Candle Behavior: Small-bodied candles with overlapping ranges = consolidation, not reversal.
Conclusion (Daily): Bullish continuation bias with consolidation flagging, not topping.
4H Timeframe
Micro-Structure: Higher low at ~$4,373 confirmed.
Bear Flag Failure: The flagged pattern failed due to lack of follow-through volume and rapid reclaim of VWAP and mid-range.
Acceptance: Price holding above prior breakout zone suggests re-accumulation.
Conclusion (4H): Neutral-to-bullish, with breakout risk skewed upward.
2. Momentum Indicators
RSI (14)
Current: ~64.7
Interpretation:
In strong bull trends, RSI often oscillates between 60–75.
RSI has reset from overbought without breaking below 55, a classic continuation signal.
Divergence: No bearish divergence on Daily or 4H.
Signal: Bullish momentum remains intact; no exhaustion yet.
Stochastic RSI
Daily: Cycling between 40–70 range.
4H: Recently exited oversold and crossed upward.
Key Point: In trending markets, Stoch RSI staying elevated is bullish, not bearish.
Signal: Momentum is rebuilding rather than rolling over.
MACD (12,26,9)
Daily MACD
Histogram: Contracting but still positive.
MACD Line: Above signal line; no bearish cross.
Slope: Flattening, not reversing.
4H MACD
Recent Bullish Cross: Occurred near $4,380–$4,390.
Histogram Expansion: Mild but improving.
Signal: Consolidation pause within trend, not momentum breakdown.
3. Trend & Volatility Indicators
Moving Averages
MA Level Interpretation
20-DMA ~$4,385 Dynamic intraday support
50-DMA ~$4,350 Strong trend confirmation
100-DMA ~$4,295 Structural support
200-DMA Much lower Long-term trend unquestioned
MA Stack: Bullishly aligned (short > medium > long).
Distance from 50-DMA: Elevated but acceptable given macro regime.
Signal: Trend strength confirmed; no mean-reversion trigger yet.
Average True Range (ATR)
Daily ATR: Elevated relative to 6-month average.
Implication: Wider stop placement required; tight stops vulnerable.
Behavior: Volatility expansion favors continuation, not range collapse.
Signal: Expect large candles post-breakout.
Bollinger Bands (20, 2)
Price Position: Riding upper band, not snapping back.
Band Width: Expanding again after brief contraction.
Mean Reversion Risk: Low while bands expand upward.
Signal: Volatility expansion favors upside continuation.
4. Volume & Participation
Volume Profile (Visible Range)
Point of Control (POC): ~$4,395–$4,405
High Volume Node: Current price area.
Low Volume Above: Thin liquidity between $4,440 and $4,520.
Implication: Once $4,441 breaks, price can move quickly.
On-Balance Volume (OBV)
Trend: Making higher highs with price.
Divergence: None.
Interpretation: Institutions are accumulating, not distributing.
VWAP (Anchored)
Monthly VWAP: Below current price.
Weekly VWAP: Acting as intraday support.
Behavior: Price respecting VWAP from above = bullish control.
5. Market Internals & Correlations
Gold vs USD Index (DXY)
Correlation: Inverse, but weakening.
Key Insight: Gold rising even on stable USD = safe-haven dominance.
Gold vs Real Yields
Decoupling Observed: Gold holding gains despite mildly firm yields.
Interpretation: Structural demand overriding rate mechanics.
6. Fibonacci Analysis (Last Major Leg)
0.236 Retracement: ~$4,365
0.382 Retracement: ~$4,310
0.5 Retracement: ~$4,265
Price has not even tested 0.236, a strong trend characteristic.
7. Probability Assessment (Technical Only)
Scenario Probability
Bullish continuation above $4,441 ~65%
Range consolidation $4,370–$4,440 ~25%
Deeper correction below $4,313 ~10%
8. Technical Bottom Line
From a pure technical standpoint:
No topping signals are present
Momentum is consolidating, not reversing
Volume and volatility favor expansion
Failed bearish patterns increase upside odds
Any dips above $4,370 remain buy-the-dip territory

USDJPY: Breakout & Bullish Continuation 🇺🇸🇯🇵
There is a high probability that USDJPY will rise more,
following a confirmed breakout of a key daily horizontal resistance.
The next strong key level is 157.6.
It will most likely be the next goal for the buyers.
❤️Please, support my work with like, thank you!❤️
I am part of Trade Nation's Influencer program and receive a monthly fee for using their TradingView charts in my analysis.

Bullish Dollar98.50 resistance overhead.
If DXY pushes above that it will signal a potential bulltrend restarting. We are on huge multi-decade support. Been forming a scooping bottoming formation since the summer, with RSI positive divergences building.
Wall Street consensus says the yellow path will happen.
The USD will be weak in Q1 and Q2 2026 and then rebound in the last half of the year.
- Are they wrong?
- I think they are, and the green path is in play catching people off guard.

Dollar Index Respects Trend Support — Buyers in Control💵 DXY DOLLAR INDEX | Swing Trade Setup 📊
Strategic Bullish Recovery with Multi-Layer Entry Strategy
📈 CURRENT MARKET STATUS
Current Price: 98.02 - 98.36 USD 📍 | Bias: BULLISH SWING TRADE 🟢 | Timeframe: 4H-Daily Swing Trade ⏰ | Market Condition: Pullback to Support Zone 💪
🎯 TECHNICAL SETUP
Plan: Bullish breakout from triangular moving average pullback with strong support confirmation from the 97.50-97.90 demand zone. 📉➡️📈
📍 MULTI-LAYER ENTRY STRATEGY (Thief Strategy)
Using Limit Order Layering - Scale-In Approach for Risk Management
Utilize multiple buy limit orders to reduce entry risk and maximize fill probability:
🔵 Layer 1 @ 97.60 📍 - 30% Position Size - Initial Entry at Strong Support ✅
🔵 Layer 2 @ 97.70 📍 - 30% Position Size - Secondary Level Confirmation ✅
🔵 Layer 3 @ 97.80 📍 - 25% Position Size - Tertiary Entry Momentum Build 📈
🔵 Layer 4 @ 97.90 📍 - 15% Position Size - Final Layer Aggressive Entry 🚀
✅ Pro Tip: Adjust layer prices based on your risk tolerance and account size. Scalable entry reduces overall trade risk and improves entry quality significantly. 💡
🛑 STOP LOSS
🔴 Hard SL @ 97.50 📍 - Below demand zone for protection 🛡️
📊 Risk: -50 pips maximum per trade 📉
⚠️ NOTE: Stop loss placement is your personal risk decision. Dear Ladies & Gentleman (Thief OG's) - Manage your own risk parameters accordingly. This is YOUR choice, YOUR responsibility, YOUR profit or loss. 🎯
🎁 PROFIT TARGETS
🟢 Target 1 (Easy Win) @ 98.30 📍 - +50 pips 💰 - Take 25% profit and lock in gains immediately ✅
🟢 Target 2 (Main Target) @ 98.60 📍 - +80 pips 💵 - Take 40% profit at moving average resistance zone 📊
🟢 Target 3 (Extended) @ 98.80 📍 - +100 pips 🤑 - Trailing stop on remaining 35% position for momentum capture 🚀
🟢 Target 4 (Aggressive) @ 99.00+ 📍 - +130+ pips 🎊 - Let your winners run with intelligent trailing stops for maximum profit 📈
⚠️ NOTE: High voltage electric gate acts as STRONG RESISTANCE + overbought zone detected at 98.50-98.70. This is a potential market TRAP zone - please take profits responsibly and don't get greedy. Final TP is YOUR personal choice based on YOUR strategy and risk appetite. 🎲
💡 TECHNICAL ANALYSIS BREAKDOWN
Bullish Confluence Factors ✅:
✅ Strong support from 97.50-97.90 demand zone (Historical reaction area proven) 📍
✅ Triangular moving average confirmation (Key technical indicator) 📊
✅ Pullback from overbought conditions (Healthy correction setup) 🔄
✅ Potential base formation pattern (Accumulation zone visible) 🏗️
⚡ 52-week range: 96.22 - 110.18 (Plenty of room for upside movement) 📈
Risk Factors to Monitor ⚠️:
⚠️ Overbought signals at 98.50-98.70 (Strong resistance overhead) 🚧
⚠️ Market trap potential (Price rejection very possible) 🪤
⚠️ Thin year-end trading volumes (Additional volatility risk) 📉
🌍 RELATED PAIRS TO WATCH (Dollar Correlation Analysis)
HIGH NEGATIVE CORRELATION 🔴 (Inverse to DXY - If DXY up, these go down):
🔗 EUR/USD - Correlation: -0.95 ⚡ (STRONGEST HEDGE PAIR) - EUR is 57.6% of DXY weight, watch for BrexitNews & ECB statements 📢
🔗 Gold (XAUUSD) - Correlation: -0.90 ⚡ (Safe-haven inverse) - Precious metals rise when USD weakens, strong economic indicator 💛
🔗 Crude Oil (XTIUSD) - Correlation: -0.75 ⚡ (Commodity proxy) - Weaker dollar = higher oil prices, OPEC decisions matter 🛢️
🔗 Silver (XAGUSD) - Correlation: -0.88 ⚡ (Precious metals) - Follows gold closely but with more volatility, watch industrial demand 🏭
🔗 Bitcoin (BTCUSD) - Correlation: -0.65 ⚡ (Crypto hedge) - Dollar weakness = crypto strength, watch Fed policy closely 🪙
OTHER MAJOR PAIRS 📊 (Direct constituents of DXY Index):
🔗 USD/JPY - DXY Weight: 13.6% 📊 - Currently 156.44 - Watch BOJ (Bank of Japan) statements + Yen carry trades 🇯🇵
🔗 GBP/USD - DXY Weight: 11.9% 📊 - Brexit dynamics remain + BoE policy movements important 🇬🇧
🔗 USD/CAD - DXY Weight: 9.1% 📊 - Oil-sensitive pair, commodity correlations + BoC rate decisions 🇨🇦
🔗 USD/SEK - DXY Weight: 4.2% 📊 - Nordic economy barometer + Riksbank policy 🇸🇪
🔗 USD/CHF - DXY Weight: 3.6% 📊 - Safe-haven currency pair, SNB decisions matter 🇨🇭
📰 FUNDAMENTAL FACTORS & ECONOMIC DRIVERS
🔴 HIGH IMPACT CATALYSTS (Coming Up)
📌 FOMC Minutes Release ⏰ - CRITICAL for USD direction 🚨 - Expected guidance on 2026 rate cuts (2 cuts currently priced in by markets) 📉 - Dovish bias would support DXY weakness, hawkish would support strength 📊
📌 Fed Chair Announcement (Early January 2026) - Trump administration to announce Powell's successor 👔 - Market uncertainty = potential big USD volatility swings 💥 - Could change entire policy expectations for 2026 🎯
📌 US Non-Farm Payroll (NFP) (First Friday of Each Month) 👥 - Strong employment data = Bullish for USD 📈 - Weak employment data = Bearish for USD 📉 - Previous trend showing mixed signals, watch closely 🔍
📌 US CPI Release (Mid-month Inflation Data) 📊 - Inflation currently at 2.7% (Dec 18, 2025 data) 📍 - Below Fed target of 3%, supports rate-cut narrative 🎯 - This weakens USD support structure 📉
📌 US Pending Home Sales 🏠 - Already jumped +3.3% in November = Bullish economic indicator ✅ - Consumer strength supports USD flows 💪
🟠 MACRO HEADWINDS PRESSURING DXY (Current Environment)
💨 2025 Dollar Decline - Already down -9.6% year-to-date (worst year since 2017!) 📉 - This is a major structural weakness signal for USD
💨 Trump Tariff Uncertainty - Aggressive tariff policies creating significant dollar weakness 📉 - Protectionism narrative reduces USD safe-haven demand 🚫
💨 Fed Independence Concerns - Political pressure on Federal Reserve reduces hawkish USD support 📢 - Powell successor uncertainty adds volatility 🎲
💨 Rate Differential Narrowing - Other central banks holding rates higher relative to US expectations 📊 - Makes USD less attractive on yield basis 💰
💨 Fiscal Deficit Concerns - US government spending pressures mounting 🏛️ - Structural USD weakness risk for 2026 ⚠️
🟢 BULLISH DXY FACTORS (Supporting Our Trade)
💪 Stronger GDP - Q3 GDP data came in strong, showing economic resilience 📈 - Manufacturing sector showing signs of recovery 🏭
💪 Labor Market Resilience - Despite recent volatility, employment remains relatively stable 👥 - Fewer major job losses than expected 📊
💪 Safe-Haven Demand - Geopolitical tensions support USD flows into safe assets 🛡️ - Middle East conflicts, Russia-Ukraine ongoing ⚠️
💪 Real Yield Attractiveness - US 10Y Treasury yield at 4.13% is attractive vs. peer nations 💰 - Investors seeking better returns flowing to USD 📈
💪 Month-End Flows - Potential technical bounces from dollar repositioning happening now 📊 - Year-end rebalancing creates support zones 🎯
📊 HISTORICAL CONTEXT & KEY LEVELS
🔵 96.22 - 52-week LOW (October 2025) - Major support zone 📍
🔵 97.50-97.90 - DEMAND ZONE (Our current trade setup area) ✅ - Strong historical reaction level 📊
🔵 98.30-98.70 - RESISTANCE ZONE (Strong overbought area with trap potential) 🚧 - Take profits here, don't be greedy 💡
🔵 99.00 - Psychological round number resistance 📍 - Major price target for aggressive traders 🎯
🔵 110.18 - 52-week HIGH (February 2025 event-driven spike) - Distant target for extended bull 🚀
🎲 RISK MANAGEMENT CHECKLIST (Must Do)
✅ Only risk 1-2% of your account per single trade 💰 - Never go all-in, always protect capital 🛡️
✅ Use stop loss without ANY exceptions 🛑 - No emotional decisions, pre-set your exit 📍
✅ Scale into positions with limit orders 📊 - Don't chase market price, let price come to you 🎯
✅ Monitor FOMC announcements closely 📢 - Set alerts for important economic releases 🔔
✅ Watch geopolitical news (Fed, Trump statements) 📰 - Breaking news can reverse markets instantly ⚡
✅ Take profits at resistance levels 💹 - Lock in gains, don't let winners turn into losers 📈
✅ Don't add to losing positions 🚫 - Patience is key, better opportunities always come 🎯
✅ Keep detailed records of all entries/exits 📝 - Track your performance and improve continuously 📊
⚡ TRADE PLAN SUMMARY
🎯 Setup: Swing trade LONG on DXY from demand zone 97.50-97.90 📍
🎯 Entry Method: 4-layer limit order strategy (Scale-in approach recommended) 📊
🎯 Stop Loss: Hard stop at 97.50 (No exceptions, no moving it) 🛑
🎯 Profit Targets: 98.30 (T1) → 98.60 (T2) → 98.80 (T3) → 99.00+ (T4) 🎁
🎯 Risk/Reward Ratio: Approximately 1:1.6 to 1:2.6 depending on which layer you enter 💹
🎯 Timeframe: 4H-Daily swing trade (3-7 trading days typical duration) ⏰
🎯 Conviction Level: MEDIUM-HIGH (Technical confluence + demand zone + economic setup) 📈
🟢 PROBABILITY EDGE SUMMARY
This setup combines multiple confluence factors for higher probability:
📊 Technical Setup - EMA pullback + demand zone confirmation
🏗️ Structural Setup - Triangular pattern + base formation
😊 Sentiment Setup - Oversold conditions creating bounce opportunity
📈 Fundamental Setup - Rate expectations + economic data supporting
Estimated Win Rate: 55-60% (Based on confluence factors, not guaranteed) 📈
Risk/Reward Ratio: Minimum 1:2.0 target recommendation 💰
Best Trading Sessions: New York + London overlap (9am-12pm EST) ⏰
💬 FINAL THOUGHTS FOR TRADERS
Dear Ladies & Gentleman (Thief OG's) 🎩 - This is a carefully crafted setup based on real market data and technical confluence. However, markets are always unpredictable. Your discipline in following your trading plan matters MORE than being right 100% of the time.
Trade responsibly. Manage your risk. Take your profits. Protect your capital. 💪
The best traders aren't the ones who win every trade - they're the ones who survive and profit over time through disciplined risk management and emotional control. 🎯
Good luck traders! May your profits flow like the currency you're trading! 📈💰
Remember: Your broker, your rules. Your strategy, your risk. Adjust all levels to match YOUR trading plan perfectly. ✅

DXY dollar index YEARLY ANALYSISDXY or Dollar index suggestets that it is in a very critical position. and movement to the up or down will be a breakout.

Interesting action in DXYCould we be in for a long decrease in dollar value as DXY rejects new level?

XAUUSD Gold - Gann Square of Nine Chart DailySome price and time projections using june to dec solstice time period via gann square of nine method. (lite finance)
6227.74 price level correlates to 1.618 fib extension.
Support at 4314, 4301, 3886, 3872.
should we correct before going to past 5K
TZ at 4430-4380 (unlikely transient zone->possible recurrent price action)
Price is likely to return to 4430-4380 but doesn't mean it will-

EURUSD: Support & Resistance Analysis for Next Week 🇪🇺🇺🇸
Here is my latest structure analysis and important
supports & resistances for EURUSD for next week.
Consider these structures for pullback/breakout trading.
❤️Please, support my work with like, thank you!❤️
I am part of Trade Nation's Influencer program and receive a monthly fee for using their TradingView charts in my analysis.

XAUUSD Gold to 5K
Another breakout amist a growing pattern of buildup- major conflict inbound and the USD is being tested. The world will not pay (inflation) by supporting it's debt system (bond market)
The dollar is being dumped. The debt bubble is popping. (Potentially) The conflict is causing the issue and the issue is causing (by) the global criminal syndicate of power. (the banking system)
He who controls the most debt controls the world; Proverbs Chapter 22:7 The Rich Rule Over the Poor and the Borrower (the Government) is Slave to the Lender (the Central Bank)
The national debt is the debt (infinite) issued by the bond holders- which is simply currrency for the slaves. They don't issue out stock- they sell the country's resources. And as such- War is a Racket- (Smedley Darlington Butler) It flips countries so they can plunder thier resources.
The CIA works for them; not for you, you pay with your blood through war. They directly tax (income tax) you like kings- they own you. (slaves/borrowers) (George Carlin) they own the government, the government is there to keep you in line and give you the illusion of control.
They own the system; they own every member (your representatives) and if they don't; they have the power to get rid of them. Every corporate news piece is there to keep you in the dark. Nothing gets out beyond the system. (cults) They're infested in virutally every neighborhood (police) and now they're leveraging technology to further thier power.
And now they want full control, they want systems to govern your every step and they will scare you into them as they please. They want full control of the world. The end.

USDSGD LongHello traders, I just noticed this setup. It seems the price for second time breaks the trendline. We have also a good support formed on levels between 1.2915/1.2935. In my opinion it will be a fake double top pattern which already formed by breaking the trendline, thus I remain long on this pair.

DXY Bullish Continuation Inside Ascending ChannelThe U.S. Dollar Index is trading within a clear ascending channel showing a sustained bullish structure after forming a strong low near 97.87. Price respected the lower trendline and printed multiple CHoCH and BOS signals confirming a shift from bearish to bullish momentum. Currently DXY is consolidating around 98.62–98.65 holding above the key 0.382–0.5 Fibonacci retracement zone which acts as a strong demand area.
The recent pullback looks corrective targeting liquidity before continuation. As long as price holds above 98.20–98.30 the bias remains bullish with upside targets toward the weak high near 99.00–99.20 aligned with the -0.382 and -0.618 Fibonacci levels. A clean breakout above this zone could accelerate further upside while a breakdown below channel support would weaken the bullish outlook.
Note
Please risk management in trading is a Key so use your money accordingly. If you like the idea then please like and boost. Thank you and Good Luck!

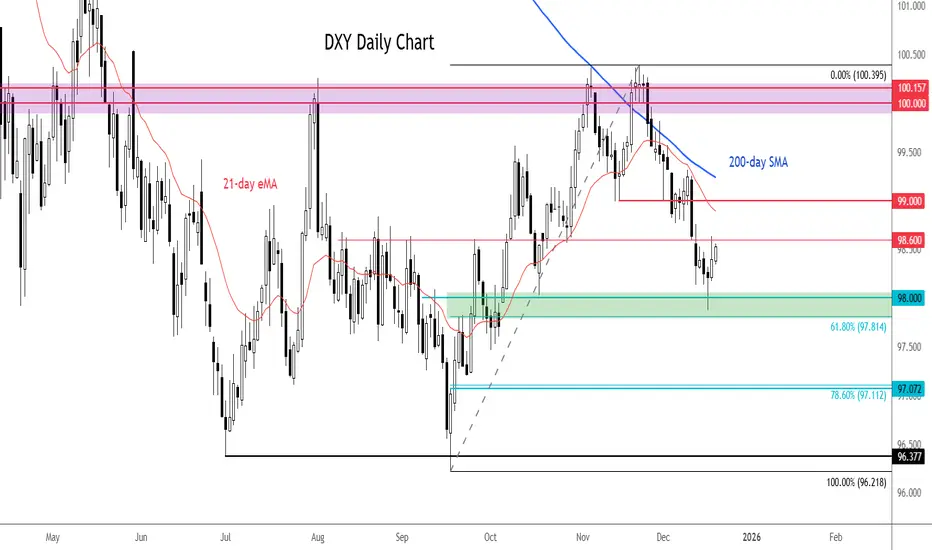
Dollar index levels to watch ahead of CPI, ECB and BOJAhead of today's release of US CPI and the upcoming rate decisions by the ECB and BOJ, the dollar index has stabilised slightly this week, although the broader picture remains one of consolidation with a downside bias.
The failure to break above the 100.00–100.40 resistance zone in November — an area that also capped gains in August — reinforced a pattern of lower highs and lower lows.
Since then, the index has broken below former support at 99.00 and 98.60, both of which now act as near-term resistance. As long as price remains below these levels, downside risks remain dominant despite recent stabilisation.
Initial support sits around 98.00, close to the 61.8% Fibonacci retracement at 97.81. A sustained break lower would expose the 97.00 level, with the next key support zone around the July–September lows near 96.20–96.40. Overall, rallies continue to look corrective unless the index can reclaim 99.00 decisively.
By Fawad Razaqzada, market analyst with FOREX.com
US DOLLAR ANALYSISOn the weekly chart, the US Dollar Index is clearly trading in a long-term bearish structure. Price has been moving under a strong descending trendline that has capped every major rally since the 2022 high, showing that sellers remain active at higher levels. After the sharp rejection near the 110 area earlier in 2025, the dollar dropped aggressively and broke below the important 100–101 support zone, which had previously acted as a strong demand area. Although price attempted to stabilize and briefly retested this zone, it failed to reclaim it, confirming that former support has now turned into resistance. The recent candles show weak upside momentum and consolidation below this key level, which signals continuation weakness rather than strength. As long as the index remains below the descending trendline and the 100–101 resistance zone on a weekly closing basis, the broader bias stays bearish, with downside pressure still dominant and no clear sign of a long-term reversal yet.

SHORT ON NZD/USDNZD/USD has given us a choc to the downside after breaking a nice rising channel which is a bearish reversal pattern.
I will be selling N/U looking to make 150-200 pips.

What's ahead for the NEW YEAR 26'?TVC:DXY
Becoming Profitable in the Auction, is a choice only chosen by the 'PROFITABLE'...
As of today the U.S. Dollar Index (DXY) has fallen significantly around -9.5% to -10% year-to-date, marking its worst performance in decades due to expectations of U.S. interest rate cuts and a strengthening global economy. Now the question is, What's ahead for the DOLLAR? Will it continue to weaken for the year of 2026 or gain back strength? What are your thoughts, lmk in the comments...
Continued Success,
TreyHighPwr

Bullish bounce reversal?US Dollar Index (DXY) is falling towards the pivot and could bounce to the 1st resistance, which has been identified as an overlap resistance.
Pivot: 97.66
1st Suport: 97.17
1st Resistance: 98.97
Disclaimer:
The opinions given above constitute general market commentary and do not constitute the opinion or advice of IC Markets or any form of personal or investment advice.
Any opinions, news, research, analyses, prices, other information, or links to third-party sites contained on this website are provided on an "as-is" basis, are intended to be informative only, and are not advice, a recommendation, research, a record of our trading prices, an offer of, or solicitation for, a transaction in any financial instrument and thus should not be treated as such. The information provided does not involve any specific investment objectives, financial situation, or needs of any specific person who may receive it. Please be aware that past performance is not a reliable indicator of future performance and/or results. Past performance or forward-looking scenarios based upon the reasonable beliefs of the third-party provider are not a guarantee of future performance. Actual results may differ materially from those anticipated in forward-looking or past performance statements. IC Markets makes no representation or warranty and assumes no liability as to the accuracy or completeness of the information provided, nor any loss arising from any investment based on a recommendation, forecast, or any information supplied by any third party

Dollar Index at Critical Support — Is a Big USD Rally Coming?Today I want to analyze the DXY index( TVC:DXY ) for you, which is one of the key indices in the financial markets.
At the moment, the DXY index is moving near a support zone($98.85-$98.50), Monthly Support (1) level, and the 21_SMA(Weekly).
In addition, the DXY has been trending inside a descending channel for roughly the past 13 trading days.
The main question is whether the DXY can break below this confluence of support levels or not.
Looking at the 4-hour chart, we can identify a Morning Star candlestick reversal pattern, and there is also a clear bullish Regular Divergence (RD+) between the last two lows.
Moreover, the US 10-Year Government Bond Yield ( TVC:US10 ) appears bullish in my view — and its upward movement can potentially support a rise in the DXY as well.
From my perspective, the best currency pairs to capitalize on a stronger USD are USDJPY( FX:USDJPY ) and EURUSD( FX:EURUSD ).
We should also keep in mind that several important US economic indicators will be released this week, which could significantly impact market direction. So be extra cautious with your positions, especially during data releases:
JOLTS Job Openings➡️09 December
Federal Funds Rate➡️10 December
FOMC Statement➡️10 December
FOMC Press Conference➡️10 December
Unemployment Claims➡️11 December
I expect that once the DXY breaks above the upper line of the descending channel, it could at least move toward one of the higher Fibonacci levels.
Do you think the U.S. interest rate will be cut this week?
💡 Please respect each other's opinions and express agreement or disagreement politely.
📌U.S. Dollar index Analysis (DXYUSD), 4-hour time frame.
🛑 Always set a Stop Loss(SL) for every position you open.
✅ This is just my idea; I’d love to see your thoughts too!
🔥 If you find it helpful, please BOOST this post and share it with your friends.

XAGUSD BUY SETP📌 Trade Plan (Short & Professional)
🟢 Entry
Buy after bullish confirmation inside:
61.40–61.20 mitigation zone, or
60.70–60.50 main demand zone (preferred after liquidity sweep)
🛑 Stop Loss
Below the demand zone: 59.95–60.00
🎯 Take Profit
Target the next liquidity zone / recent highs:
62.80–63.40
📈 Reason for Entry
Market shows a bullish BOS
Price is retracing to fill imbalance + mitigate demand
Expecting a liquidity sweep, then bullish continuation

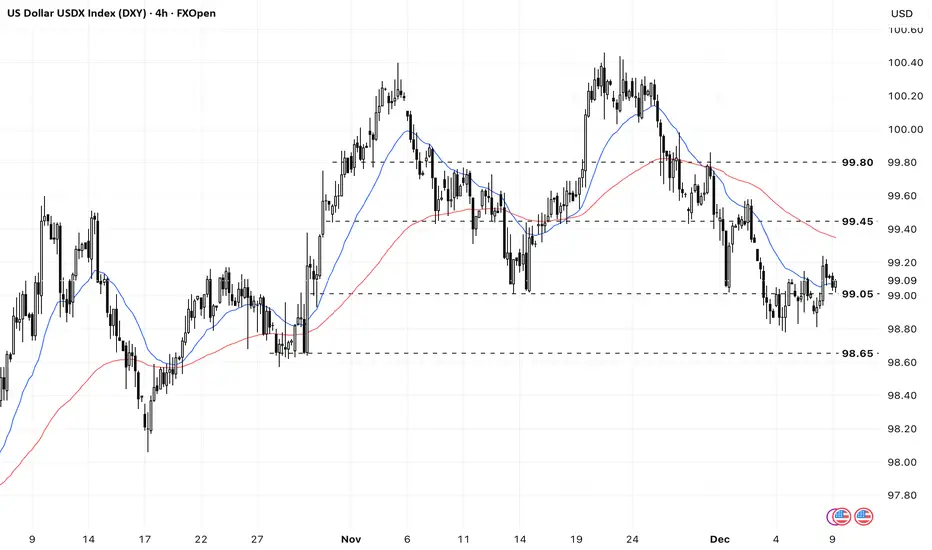
DXY rebounded slightly due to the expectation more hawkish FedThe US dollar rebounded after the recent weakness due to increased odds of a rate hike at tomorrow's meeting.
Meanwhile, today's US October JOLTS data may offer further clarity on the labor market following the delayed October NFP. Markets are anticipating the JOTLS to fall to 7.2 million, which could contract the job openings per unemployment rate under the 1.0 level and add further concern about the labor market, despite a low unemployment rate.
DXY breached 99.00 and EMA21. The index remains between the bearish EMAs, indicating potential consolidation.
If DXY breaks below 99.00 again, the index could retreat toward the next support at 98.65.
Conversely, if the DXY moves above the EMA78, the index may advance toward the next resistance level at 99.45.
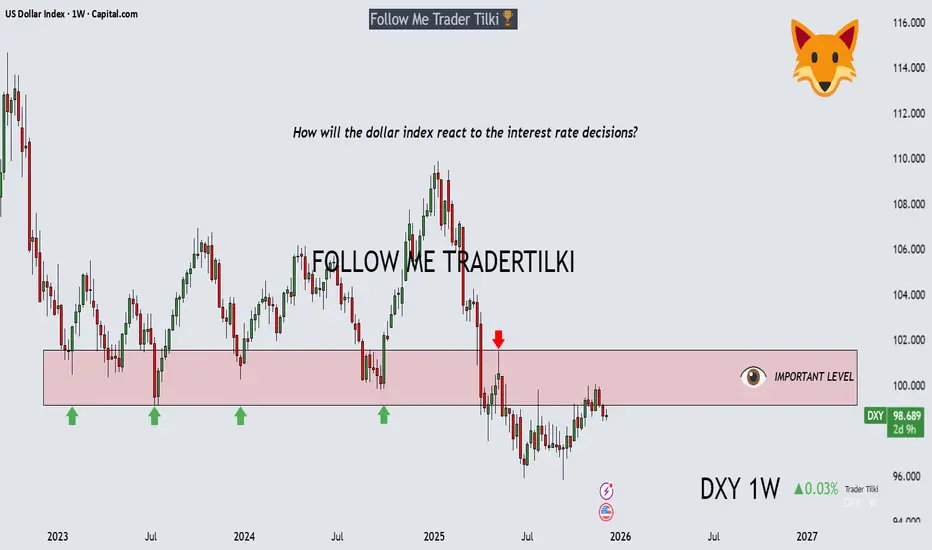
Interest Rate Decision and DXY – 1-Week - Tradertilki AnalysisMy friends,
Today, the most important fundamental news from the U.S. will be the interest rate decision.
This data will determine the direction of both gold and cryptocurrencies.
If there is an interest rate cut, gold and bitcoin will rise; if there is a rate hike, gold and bitcoin will fall.
Before approaching other trades today, I believe it is beneficial to wait for this important news release.
If DXY manages to break above the 101,550 – 99,143 levels, the first level it will want to test is 103,360.
My friends, I share these analyses thanks to each like I receive from you.
Your likes increase my motivation and encourage me to support you in this way.🙏✨
Thank you to all my friends who support me with their likes.❤️
December 10th, Pre-FOMC Macro-Assets Analysis and ProjectionsToday (December 10th, 2025), US federal reserve chair - Jerome Powell will speak at the FOMC Press Conference at 2 pm (NY timezone)
He will announce committee's decision to change the interest rate. Rather than speculating what he may say, lets look at a few basic economic principles in order to understand how it may impact the markets.
FUNDAMENTAL
Case A : They decide to cut the interest rate.
1. Interest rate goes down → Borrowing feels cheaper
2. Borrowing feels cheaper → Demand for money (here, USD) rises
3. Demand for money rises → Money printing (supply) increase
4. Money supply increase → Price of everything increases (over time) (rising inflation)
5. Rising inflation → USD weakens
6. USD weakens → Gold / Crypto strenthens
Case B : They decide to hike the interest rate.
1. Interest rate goes up → Less / No money printing
2. Less / No money printing → Limited money supply → Virtual scarcity
3. Virtual scarcity of money→Value of money (here, USD) strengthens
4. USD strengthens → Gold / Crypto weakens
Case C : They decide to keep the interest rate same.
Interest rate stays same → Continued Market Momentum
TECHNICAL
( All charts displayed as of 12/10/2025 4:00 (UTC-5) )
1. DOLLAR ( TVC:DXY )
# 1-Day Long term bias : Bearish
# 1-Day Current phase : At POI in bearish consolidation with a possible double top
# 4-Hours' Trend : In a downtrend from its second top (from 1D timeframe)
# 4-Hours' Likely Liquidity Zone ; Sell-side sweep between 99.450-99.550
# 4-Hours' Projection : DXY likely to expand its current downtrend and fall further down atleast 98.650
2. GOLD ( OANDA:XAUUSD )
# 1-Day Long term bias : Bullish
# 1-Day Current phase : At Possible High forming bullish continuation pattern
# 4-Hours' Trend : Sideways, forming a falling wedge pattern
# 4-Hours' Likely Liquidity Zone ; Buy-side sweep between 4150-4175
# 4-Hours' Projection : Gold likely to test / sweep support before expanding upside to atleast 4265
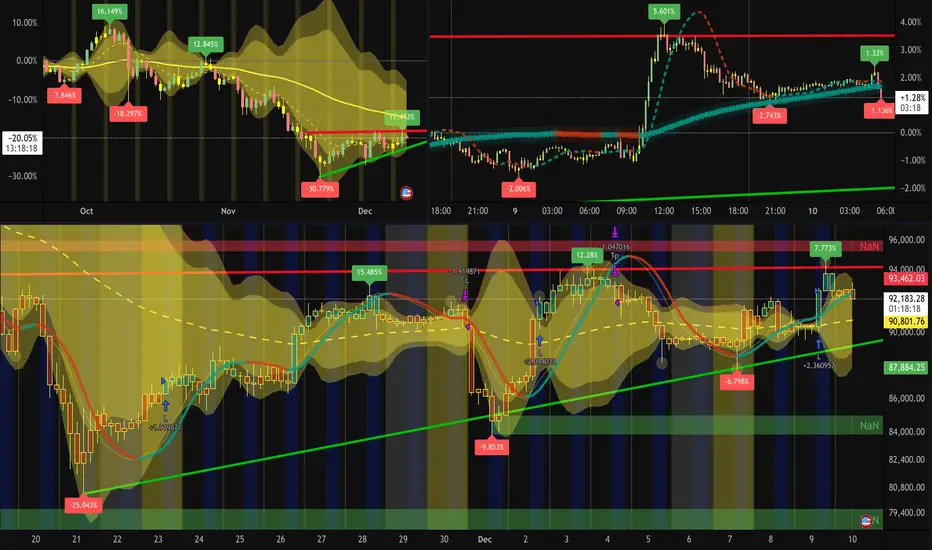
3. BITCOIN ( CRYPTO:BTCUSD )
# 1-Day Long term bias : Bearish
# 1-Day Current phase : At Possible Low retracing back to its equilibrium (solid yellow line)
# 4-Hours' Trend : Sideways, forming a ABCDE Horizontal Triangle (as per Elliot Wave theory)
# 4-Hours' Likely Liquidity Zone ; Buy-side sweep at 88k / 83k | Sell-side sweep at 96k
# 4-Hours' Projection : Heavily likely to sweep both side during FOMC and start expanding upside to atleast 108k
4. SP500 / NASDAQ / DOW-JONES ( TVC:SPX )
# 1-Day Long term bias : Bullish
# 1-Day Current phase : At Possible High retracing back to its equilibrium (dashed yellow line)
# 4-Hours' Trend : Uptrend, in disequilibrium with downside momentum
# 4-Hours' Likely Liquidity Zone ; Sell-side swept above 6870 | Buy-side liquidity at 6530
# 4-Hours' Projection : Likely to pullback to its equilibrium or stay stagnant before continuing its upside expansion to atleast 6950
Overall,
if the Fed decides to cut rate by 0.25%, market may show strong volatility
if the Fed decides to cut rate by 0.50%, market may show extreme volatility
if the Fed decided anything else, market stays stagnant with one-time hype volatility move
DXY likely to expand its current downtrend and fall further down atleast 98.650
Gold likely to test / sweep support before expanding upside to atleast 4265
Bitcoin likely to sweep both side during FOMC and start expanding upside to atleast 108k
SP500 likely to pullback to its POI or stay stagnant before its upside expansion to atleast 6950
DAILY DXY IDEAprice has tapped a key demand level and is showing a clean rebound toward the mid-range.
The first upside magnet sits around those highlighted arrows and horizontal$ and so forth if momentum holds before Christmas 25th.
Structureee stays bullish while price holds above 99.200. a clean break below that level opens the path back toward 97.95
lets break bread...
