DXY Continuing the bullish trend?DXY Weekly Outlook
The dollar has been bullish over the past few weeks, continuing to break structure to the upside. I expect this momentum to carry on a bit further, but as price approaches a strong supply zone, we could see some short-term downside.
This potential pullback would likely cause a temporary push-up for EU and GU before the dollar resumes its bullish move overall.
I don’t trade the dollar directly, but I use it as confluence for my main pairs — and right now, it aligns perfectly with my EU and GU outlooks.
Key Levels:
Possible bullish reaction around 99.600
Potential bearish reaction around 100.000 (psychological level)
Dollarindex

DXY has started a new long-term Bullish Leg to 103.500.Four months ago (June 26, see chart below) we gave a strong Buy Signal on the U.S. Dollar Index (DXY), which in a month's time it hit our 100.000 Target:
Now we see the 3-year Channel Down starting the next Bullish Leg having priced its bottom (Lower Low) on September 17. As you can see this is almost the exact same triple Lower Lows bottoming process as in 2023, using also the same Fibonacci retracement levels as Targets. We have the huge 1W RSI Bullish Divergence to also confirm this.
Based on this symmetry, we have started a Bullish Leg similar to July's 2023. That peaked marginally below the 0.5 Fibonacci level. As a result, we expect DXY to target at least 103.500 by early 2026.
-------------------------------------------------------------------------------
** Please LIKE 👍, FOLLOW ✅, SHARE 🙌 and COMMENT ✍ if you enjoy this idea! Also share your ideas and charts in the comments section below! This is best way to keep it relevant, support us, keep the content here free and allow the idea to reach as many people as possible. **
-------------------------------------------------------------------------------
💸💸💸💸💸💸
👇 👇 👇 👇 👇 👇

GOLD | Daily Analysis #2 - 30 October 2025Hello and welcome back to DP,
Review and news:
Yesterday Gold pulled back slightly from recent highs after strong run-up. According to FXTrendo, it had briefly topped the psychological US$4,000/oz level, then traded around ~US$3,995. Expectations that the Federal Reserve might cut interest rates later this year remain a tailwind, which helps non-yielding assets like gold. Geopolitical uncertainties and safe-haven demand continue to underpin gold’s appeal. In summery gold remains structurally bullish, but near-term momentum is under pressure. The market is in a consolidation/correction phase while waiting for the next catalyst (Fed clarity, inflation prints, major geopolitical event).
1H – 4H Technical Analysis:
As you can observe, the major downtrend broke, the upside moving is feuled up. Demand zones are strong and 3914 zone is still irony. So if price pass and break 4024 area, there is potential to uptrend goes continuously. With analyzing the support and resistance zones, these scenarios are possible: Bearish scenario: If gold fails to reclaim the resistance zone (~4,000 +), and breaks below short-term support (~3,940), then a deeper retracement toward ~3,900 or lower becomes more likely. Bullish scenario: If gold holds above ~3,940-3,900 and the Fed or external shock triggers safe-haven flows, a move back toward ~4,050-4,100 is possible. Neutral to caution: Given the mixed signals (strong overall trend but short-term pullback), many traders may prefer to wait for confirmation (e.g., breakout above resistance or a clean bounce off support) rather than aggressively chase.
Disclaimer:
This content is for informational purposes only and does not constitute financial or investment advice. © DIBAPRISM
Amir D.Kohn

Forex Traders Focus on Central Bank DecisionsForex Traders Focus on Central Bank Decisions
As expected, the Federal Reserve yesterday cut the Federal Funds Rate from 4.25% to 4.00%, while Jerome Powell’s remarks reduced the likelihood of further rate cuts. Meanwhile, decisions by other key central banks are also influencing the currency markets, according to Forex Factory:
→ The Bank of Canada lowered its policy rate from 2.50% to 2.25%, in line with market expectations. Its official statement highlighted risks of slower GDP growth, “continued weakness in the economy”, and concerns over U.S. trade relations and tariffs.
→ The Bank of Japan (BoJ) kept interest rates unchanged but signalled readiness to raise borrowing costs if economic conditions allow. This has shifted traders’ focus towards a possible rate hike as early as December.
→ The European Central Bank (ECB) is expected to leave its key rate steady, with the decision due at 16:15 GMT+3 today.
→ Next week, both the Reserve Bank of Australia and the Bank of England are scheduled to announce their policy decisions.
Against this backdrop, attention is increasingly turning to the Dollar Index (DXY) chart today.
Technical Analysis of the DXY Chart
On 19 September, we conducted a key analysis of the DXY chart, noting that:
→ The long-term downward channel (shown in red) remains relevant, divided into quarters by the intermediate QL and QH lines.
→ The index had rebounded from the QL line (marked by an arrow).
→ A bullish scenario was emerging.
Following that rebound, the price began to form an upward trajectory, reaching the upper boundary of the channel by 10 October — which, as anticipated, acted as strong resistance.
Currently, the DXY chart displays a narrowing triangle pattern, where:
→ The resistance is defined by the upper edge of the long-term descending channel that has contained the index’s 2025 movements.
→ The short-term upward channel from the September low remains intact.
This formation may reflect both the current balance of the U.S. dollar against a basket of major currencies and the uncertainty among analysts about its future direction.
Given the combination of central bank decisions, the U.S. government shutdown, geopolitical risks, and trade tensions, a breakout from this triangle could mark the start of a major trend lasting several weeks or even months.
Yesterday’s Fed decision strengthened the dollar, breaking through a local Bullish Flag pattern (shown in blue) and increasing the likelihood of further upward momentum.
This article represents the opinion of the Companies operating under the FXOpen brand only. It is not to be construed as an offer, solicitation, or recommendation with respect to products and services provided by the Companies operating under the FXOpen brand, nor is it to be considered financial advice.

Dollar In Range-And It May Not Be Broken Soon...Stocks are pushing nicely to the upside after some optimism that a deal could be reached between the US and China regarding tariffs, as reported this weekend by Trump himself. He’s clearly driving the market into a risk-on mode.
However, it’s interesting to see that the dollar is still going nowhere; the only FX market showing a more decisive move is the Aussie, which is naturally benefiting from this story.
Looking at the dollar index, no one knows where it wants to move but basic analysis in ranges is simple; "down from resistance, up from the support".
Keep in mind we’re still missing the latest US jobs data, so the outlook for further cuts remains uncertain, and that could keep the dollar moving sideways for now.
Have a nice trading week!
GH
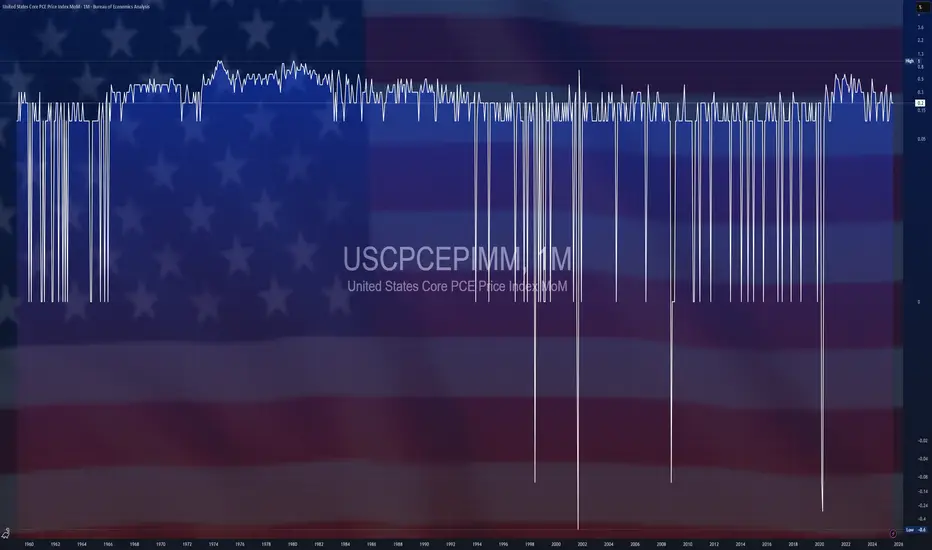
$USCPCEPIMM -U.S Core Inflation (September/2025)ECONOMICS:USCPCEPIMM +0.2%
September/2025
source: U.S. Bureau of Labor Statistics
- Core consumer prices in the US, which exclude food and energy, rose by 0.2% from the previous month in September of 2025, slowing from the 0.3% in the August and July, and slightly under market expectations of a 0.3% increase.
The data was released with weeks of delay as the ongoing US government shutdown suspended activity in the Bureau of Labor Statistics.
Prices rose slower for shelter (0.2% vs 0.4% in August), transportation services (0.3% vs 1%), and new vehicles (0.2% vs 0.3%).
In turn, the CPI rebounded for medical care services (0.3% vs -0.1%) and accelerate for apparel (0.7% vs 0.5%).
From the pervious year, core consumer prices rose by 3% in September.
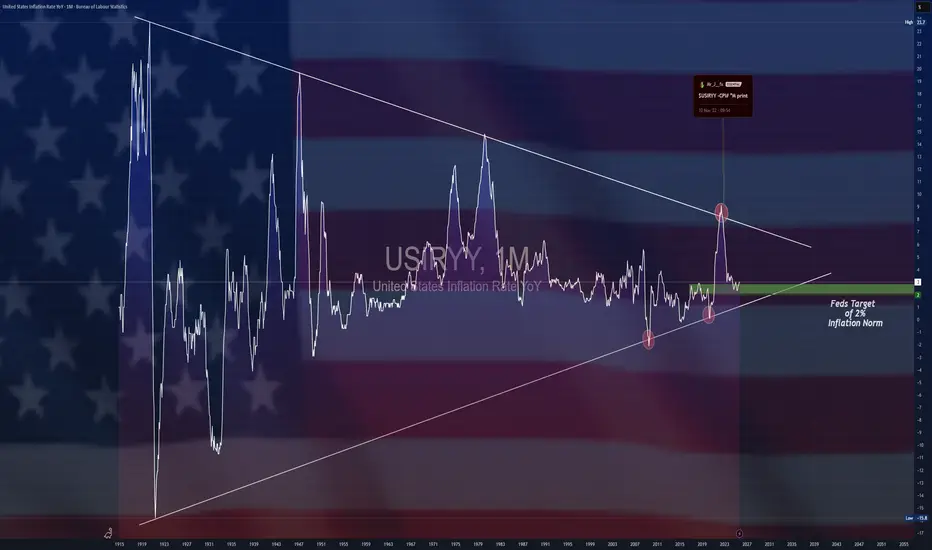
$USIRYY -U.S Inflation Rate (September/2025)ECONOMICS:USIRYY 3%
September/2025
source: U.S. Bureau of Labor Statistics
- The US annual inflation rate rose to 3.0% in September from 2.9% in August, slightly below market expectations of 3.1%.
It was the highest rate since January, mainly due to a jump in energy prices. Meanwhile, core inflation eased to 3.0% from 3.1%, while monthly headline and core CPI increased 0.3% and 0.2%, respectively.
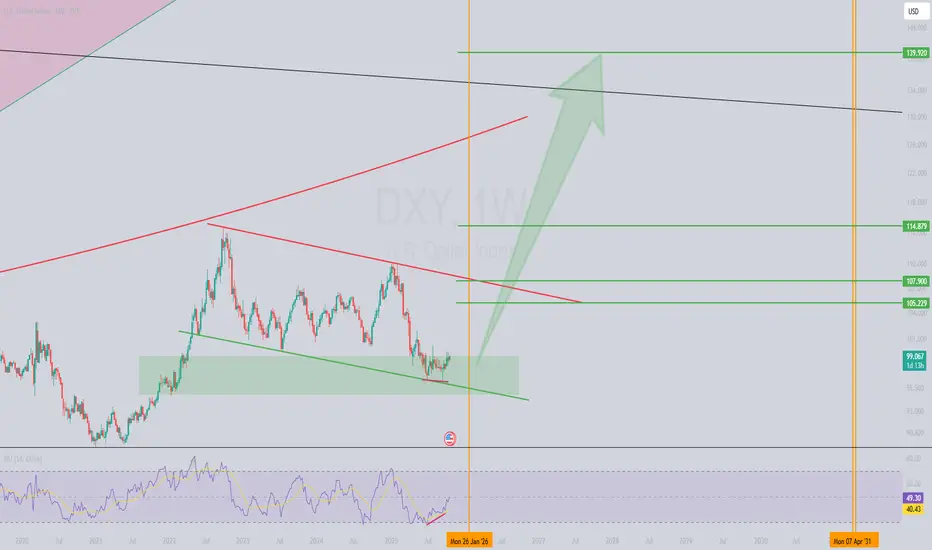
DXY: Bullish Setup Brewing at Key Weekly Support!The US Dollar Index (DXY) is showing a compelling setup on the weekly timeframe! 📈 The price has reached a critical support zone between 99.120 and 94.802. This level also aligns with the lower boundary of a descending channel, adding confluence to this high-probability zone.
🔍 Key Technical Observations:
Bullish Divergence: A clear bullish divergence has formed between the price and the RSI indicator, signaling potential exhaustion of sellers and a possible trend reversal.
Channel Support: The price is testing the lower trendline of the descending channel, a spot where buyers have stepped in before.
Support Zone: The 99.120–94.802 range is a high-value area for accumulation, making it a prime spot for a bounce.
📡 What’s Next?Technically, the DXY looks poised for a bullish reversal. However, global macroeconomic events and fundamental news (like Fed decisions or geopolitical developments) will play a crucial role in confirming this move. Keep an eye on upcoming economic data releases! 📅
What do you think of this setup? Are you bullish on DXY, or waiting for more confirmation? Drop your thoughts below! 👇
USD Index: Bearish for today?At least for today it looks like dollar index is bearish.
Waiting for #1 BOS - as initial confirmation that bearish is taking over.
#2 BOS - should provides a confirmation that bearish is on its way.

DXY SHORT FROM SUPPLY AREA|
✅DXY Price is retracing toward the supply level, where a reaction is likely once the imbalance gets filled. A rejection from this zone could confirm the retest before continuation lower toward the 98.30 target area. Time Frame 2H.
SHORT🔥
✅Like and subscribe to never miss a new idea!✅

DXY Free Signal! Sell!
Hello,Traders!
DXY Price is expected to retest the horizontal supply area early next week as liquidity builds up below Friday’s close. Smart Money may engineer a short-term rally into this zone before resuming the bearish move toward 98.38.
-------------------
Stop Loss: 98.71
Take Profit: 98.38
Entry: 98.58
Time Frame: 3H
-------------------
Sell!
Comment and subscribe to help us grow!
Check out other forecasts below too!
Disclosure: I am part of Trade Nation's Influencer program and receive a monthly fee for using their TradingView charts in my analysis.

DXY LOCAL SHORT|
✅DXY price is reacting to a confirmed ICT supply level, showing a clean mitigation from the imbalance zone. As long as this level holds, sellers may target the short-term liquidity resting below 98.30. Time Frame 2H.
SHORT🔥
✅Like and subscribe to never miss a new idea!✅

2025 – The Year of the Normalized Dollar (Episode 2)2025 – The Year of the Normalized Dollar (Episode 2) 📉💵
📆 Feb 25 was just the beginning — and now we’ve got confirmation.
DXY couldn’t hold above structure, and the drop is on. What began as a quiet theme is turning into the macro headline:
The King Dollar is softening... on purpose.
🔍 Chart Context
• 🔴 Rejection at 112.3 — clean and brutal**
• 🔁 100.95 now flipped into resistance**
• 📉 Heading toward Target: 94.37** — the long-term structure low
The structure hasn’t changed — only the velocity has.
This isn’t a flash move. This is policy-meets-price.
🧨 Fundamentals: Trump’s Soft Dollar Doctrine
Back on January 23, Trump told the world exactly what he wanted:
“I’d like to see interest rates come down… a lot.”
“Oil down, prices down, inflation gone — and then rates down.”
Translation?
💵 A weaker dollar to fuel exports, ease debt loads, and juice the real economy.**
This is not weakness — it’s a recalibration.
Add in:
• Tariffs + labor policy inflation
• Pressure on Powell
• Geopolitical chess moves (Putin negotiations, Middle East detente)
→ and you’ve got a coordinated softening playbook.
📉 What’s Next?
• 🔹 Break 98 = Target 94.37 opens wide
• 🧱 If 94 cracks, we’ll re-assess — but for now, that’s the magnet
• DXY needs a miracle to reclaim strength without Fed resistance easing
2025 could be the year the dollar gets normalized by force — not finesse.
🔄 Perspective Shift 🔄
This isn’t dollar death — it’s dollar diplomacy.
Strong enough to hold global weight, soft enough to boost Main Street.
You think this isn’t coordinated? Look again. 📡
One Love,
The FXPROFESSOR 💙
First episode:
⚠️ I’m not a financial advisor — just a philosopher with better chart vision than 99% of the noise out there. What I share is my view, not a signal. You trade? You’re responsible. Just don’t blame me when I’m right again.

USD/CAD Bullish Bias Supported by COT Data and Seasonal Trends🗓 Monthly Chart Overview
• Price Inefficiency Zone: There's a clear imbalance between 1.40165 and 1.41248, suggesting a potential magnet for price. A retracement to at least the 50% level of this inefficiency could be expected.
• Bullish Structure: Price has formed a bullish order block and is currently retracing, which often precedes a continuation move upward.
• This setup hints at accumulation before a bullish expansion.
📆 Weekly Chart Insights
• Inefficiency Filled: Price has filled previous inefficiencies, showing healthy market structure.
• Liquidity Behavior: We've seen price sweep lows, then begin sweeping highs, while respecting bullish blocks—a strong indication of a shift in directional intent.
• This behavior supports the idea that USD/CAD is preparing for a bullish continuation.
📅 Daily Chart Momentum
• Aggressive Breakout: After a period of consolidation, price broke out aggressively to the upside, confirming bullish momentum.
• Structure: The daily chart maintains a bullish structure, reinforcing the higher timeframe bias.
💹 Commitment of Traders (COT) Data
• USD Positioning: The U.S. Dollar is showing net buying interest, supporting strength.
• CAD Positioning: The Canadian Dollar is net bearish on average when compared to last year’s data.
• This divergence in sentiment adds confluence to a bullish USD/CAD bias.
📊 Seasonal Trends
• Historically, USD/CAD tends to rise from August through November, with September, October, and especially November being the most bullish months.
• This seasonal tendency aligns with the current technical and fundamental setup.
🏦 Macro Considerations
• Interest Rates: Keep a close eye on central bank rate decisions and forward guidance, as they can significantly impact USD/CAD volatility and direction.
🔍 Summary
USD/CAD shows strong bullish potential across monthly, weekly, and daily timeframes. Technical structure, COT data, and seasonal trends all point toward a continuation to the upside. A revisit to the inefficiency zone around 1.4060–1.4120 could be a key target in the coming months.

Will DXY Sustain The Pressure Amid Current Uncertainties?Fundamental approach:
- The US dollar retreated this week, pressured by expectations of continued Fed easing and signs of emerging economic weakness.
- The Fed's latest Beige Book revealed that economic activity remained flat, with increasing layoffs across districts, and middle- to lower-income households reducing their spending, reinforcing dovish expectations. Chair Powell's scheduled remarks and the ongoing government shutdown, which began on 1 Oct, have delayed critical data. The Sep NFP was not released, and the Sep CPI is rescheduled for Fri, 24 Oct, adding to the uncertainty surrounding the dollar's outlook.
- Meanwhile, the euro gained ground as European currencies strengthened against the greenback, with the dollar down around 10% YTD.
- The dollar may face continued downside pressure as markets await the Fed's October 28-29 meeting, where a 0.25% rate cut is widely anticipated. However, delayed economic data releases could inject volatility into near-term trading.
Technical approach:
- DXY is trading within the ascending channel and retesting the support at 98.60. The index is slightly above both EMAs, indicating the upward momentum persists.
- If DXY remains above the key support at 98.60, confluence with the ascending channel's lower bound, the index may rise to retest the psychological resistance at 100.00.
- On the contrary, breaking below the support and both EMAs may prompt the DXY to retest the following support at 97.15.
Analysis by: Dat Tong, Senior Financial Markets Strategist at Exness

Dollar Index Big Map: Trend Is Your Friend This year, the dollar has been in the red all the way down — until it hit the strong support line of a multi-decade uptrend (white). From there, it bounced to the upside. So, what’s next?
I’d like to share with you a big map of the Dollar Index.
I assume that we are still within the large second leg ((Y)) of the ((WXY)) corrective structure (white).
Within this structure, we can see a smaller-degree (WXY) correction (blue).
Currently, the market is moving in the last leg C of the final upward move in blue wave (Y).
Many times, I’ve observed how beautifully these wave structures align with strong pivot points.
The ultimate target for wave ((Y)) is near the top of wave ((W)), around 121.
This level also matches the target where blue wave (Y) equals blue wave (X) — an amazing correlation!
There are two key confirmation levels marked on the map:
Bullish confirmation — above 110 (this would invalidate the bearish scenario).
Bearish confirmation — below 89 (this would invalidate the ((WXY)) structure).

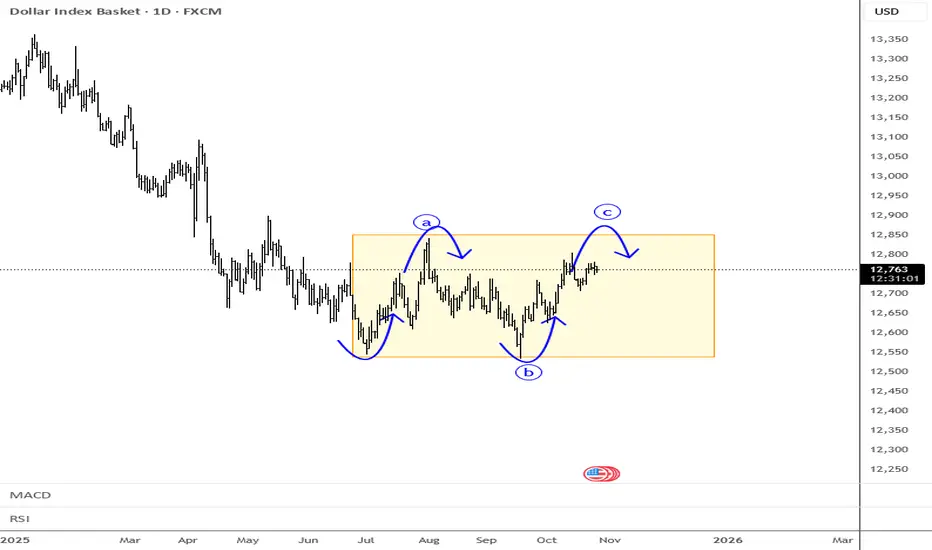
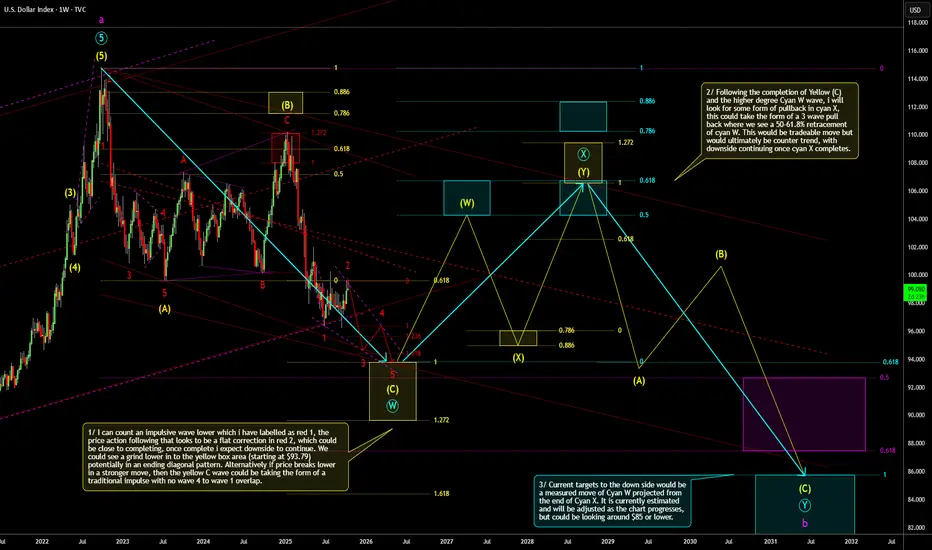
DXY Weekly Outlook (Count 3)This is a weekly timeframe outlook of the TVC:DXY . This is in alignment with my previously posted outlook which so far is playing out close to how I expected. This shows the wider view of what I think could be playing out. Still targeting the same yellow zone for a potential termination of the yellow (C) wave, after which we could see a counter trend consolidation. Current price action on the lower timeframe looks like it is forming a bearish flat correction which could be wave 2 in red. I'll look get a lower time frame update together, when time allows. More comments on the chart.
DXY: The Dollar’s Long Cycle — Heading Back to 9/11 Levels?The U.S. Dollar Index ( INDEX:DXY ) has navigated through decades of pivotal global shifts — from the end of the Gold Standard and the 1979 Oil Crisis to the Plaza Accord, the Global Financial Crisis, and now the post-pandemic monetary reset.
Each of these events marked critical macro turning points — and each time the dollar found new structural strength after major dislocations.
Now, DXY has consolidated above long-term resistance and appears to be building energy for another leg higher.
If history rhymes, we may see the dollar rally toward the levels reached during the aftermath of the September 11 attacks — a zone that historically represented both global uncertainty and U.S. capital inflows.
Bias: Bullish
Target Zone: 120–122
Timeframe: Multi-year (monthly chart perspective)

DXY index Near Resistance – Will Powell Trigger the Next Move?To kick off this week, let's take a quick look at the upcoming key indexes in the economic calendar before diving into the DXY analysis ( TVC:DXY ).
On Tuesday, we have Fed Chair Powell speaking, which could stir some excitement in the DXY index and ripple through correlated financial markets . Then, on Thursday , we have a bunch of key indexes like Core PPI, Core Retail Sales, PPI, and Unemployment Claims coming out. These releases could spark some volatility as well.
So, before we jump into the DXY analysis , I wanted to give you a heads-up on this week’s events
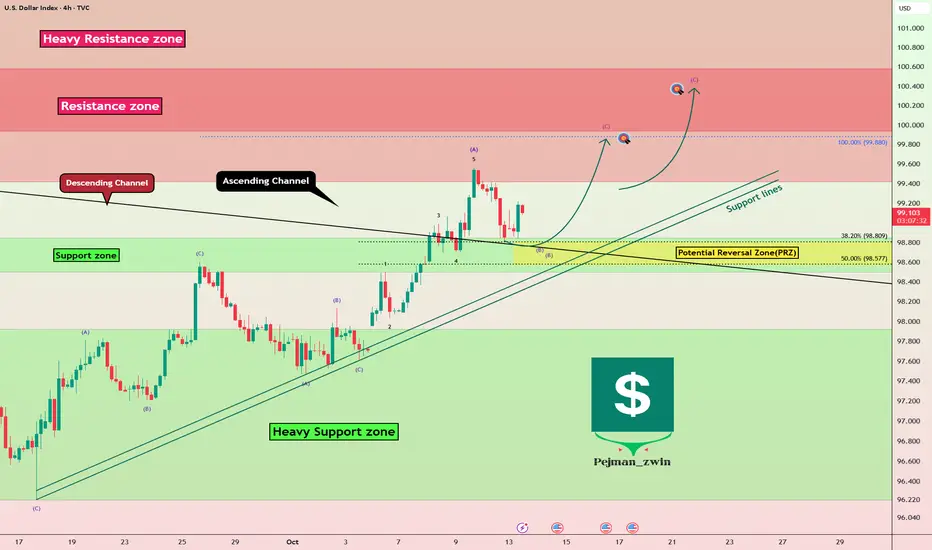
From a technical analysis standpoint , the DXY index is currently moving near a Heavy Resistance zone($101.30-$99.42) . At the same time, it has managed to break above the upper line of its descending channel and is now in a pullback phase to retest that broken line.
In terms of Elliott Wave theory , it seems that the DXY is completing wave B of a zigzag corrective(ABC/5-3-5) .
I expect that wave B will finish around the Potential Reversal Zone(PRZ) , and we might see the DXY index approach that Resistance zone($100.58-$99.93) before Powell’s speech tomorrow .
First Target: $99.770
Second Target: $100.06
Stop Loss(SL): $98.28
Please respect each other's ideas and express them politely if you agree or disagree.
U.S. Dollar Index Analysis (DXYUSD), 4-Hour Time Frame.
Be sure to follow the updated ideas.
Do not forget to put a Stop loss for your positions (For every position you want to open).
Please follow your strategy and updates; this is just my Idea, and I will gladly see your ideas in this post.
Please do not forget the ✅' like '✅ button 🙏😊 & Share it with your friends; thanks, and Trade safe.
mrmoney limited DXY position/swing trading ideaprice has reacted from our monthly support level giving us pin bar which created a double bottom on the weekly time frame looking for mor bullish move for the time being except price reacts on our resistance level

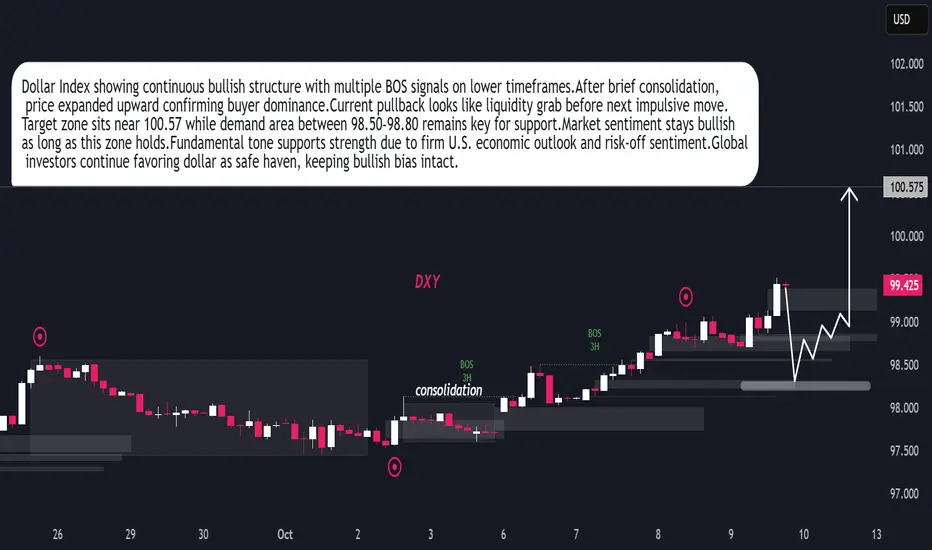
DXY Ready for Next Bullish Leg After Liquidity SweepDollar Index maintaining bullish structure after recent BOS on 3H timeframe.Market formed consolidation phase early October before expansion.Buyers showing control pushing price towards 100.57 objective.Current retracement indicates liquidity grab before next bullish impulse.Demand zone 98.50–98.80 remains key area for continuation.Technical sentiment stays positive as long as price holds above 98.50.Fundamentally, dollar supported by strong U.S. data and cautious global tone favoring safe-haven demand.Momentum outlook remains bullish with potential continuation toward 100.50+ zone.
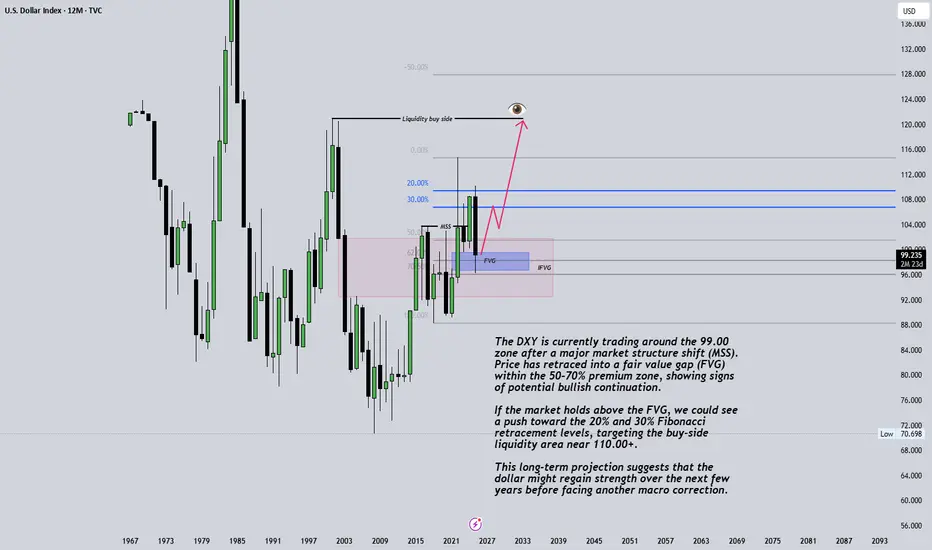
US Dollar Index (DXY) Monthly OutlookThe DXY is currently trading around the 99.00 zone after a major market structure shift (MSS). Price has retraced into a fair value gap (FVG) within the 50–70% premium zone, showing signs of potential bullish continuation.
If the market holds above the FVG, we could see a push toward the 20% and 30% Fibonacci retracement levels, targeting the buy-side liquidity area near 110.00+.
This long-term projection suggests that the dollar might regain strength over the next few years before facing another macro correction.
📅 Timeframe: Monthly
💡 Bias: Bullish towards liquidity highs
⚠️ Disclaimer: This analysis is for educational purposes only and does not constitute financial advice.
#DXY #USDX #DollarIndex #ForexAnalysis #SmartMoneyConcepts #MarketStructure #FVG #Liquidity #Herotraderfx #TradingView
Has Gold Reached Its Fullest Potential?Has gold reached its fullest potential? It depends on the US dollar.
As we can see when dollar declines, gold went up.
i) From 2001 to 2011, when dollar was down, gold went up.
ii) From 2017 to 2020, when dollar was down, gold went up.
iii) And from 2022 to current, when dollar is down, gold is up.
With de-dollarization, this also means gold may have more upside potential.
Mirco Gold Futures and Options
Ticker: MGC
Minimum fluctuation:
0.10 per troy ounce = $1.00
Disclaimer:
• What presented here is not a recommendation, please consult your licensed broker.
• Our mission is to create lateral thinking skills for every investor and trader, knowing when to take a calculated risk with market uncertainty and a bolder risk when opportunity arises.
CME Real-time Market Data help identify trading set-ups in real-time and express my market views. If you have futures in your trading portfolio, you can check out on CME Group data plans available that suit your trading needs www.tradingview.com
