Chart Patterns ranked by reliability (1-8)Chart Patterns as a Strategy (Not a System)
In the world of technical analysis, chart patterns are often marketed as stand-alone trading systems. In reality, their real edge comes from probabilistic structure recognition, not prediction.
The key insight from my large-sample testing (10 years, 200,000+ patterns (Futures, FX)) is this:
Patterns don’t predict direction — they quantify structural bias once price has already revealed intent.
That distinction is what separates profitable traders from pattern collectors.
How These Patterns Were Tested (Why the Stats Matter)
All patterns discussed below were:
Only counted once fully completed
Required confirmed breaks of structure (trendline, neckline, or support/resistance)
Measured using objective projection rules, not discretionary targets
TP Rule: Full Head and Shoulder Height, using the Head distance and the right shoulder as the SL.
Full Height of triangles, and a full height for flags as well.
Twice the height of the Channel as TP, and Time TP for Channels, for half of the duration of the it.
Rectangles were Full Box Width as TP, and a time-based TP of 1/4 the Length.
It could be trailed further, but some such as Rectangle TP made great mean-reversion trade.
This removes hindsight bias — a major flaw in most pattern discussions.
Continuation Patterns (Trend Context Is Mandatory).
#8. Bull & Bear Flags (~67%) (Alt. Name: Cups, Volatility Contraction Pattern)
Occur after near-vertical impulse moves, typically the 50 EMA can filter the direction.
Represent temporary pauses, not reversals.
Best when:
Flag is tight
Forms near the extreme of the impulse
Volume contracts during consolidation
Professional takeaway:
Flags are trend health checks, not entries. If a flag fails, momentum is likely exhausted.
#7. Ascending & Descending Triangles (~73%)
Market compresses against a hard level
One side shows aggression, the other absorption
Breakout confirms institutional imbalance
Use them to answer:
“Is price being accumulated or distributed?”
#6. Ascending & Descending Channels (~73%) (Alt. Name: Cups & Handle)
Wide consolidations between parallel trendlines
Stronger than flags due to time + participation
Breakouts often lead to measured trend continuation
Key insight:
Channels are delayed continuation, not indecision.
Reversal Patterns (Confirmation Is Everything)
The Joker: Double Tops & Bottoms (75–79%)
Require structural failure
Completion only occurs after neckline break
Bottoms outperform tops statistically (markets rise faster than they fall)
⚠️ Common mistake:
Anticipating the second top/bottom instead of waiting for confirmation.
The Queen: Triple Tops & Bottoms (77–79%)
Stronger due to repeated rejection
Represent exhaustion of dominant participants
Interpretation:
The market tried three times — and failed.
The King: Rectangle Patterns (~78–80%)
Flat consolidation after a trend, more than 3 touches top and bottom.
Essentially failed reversal attempts.
Breakouts often trap traders positioned against the trend, it's best to enter on retest of breakout or earlier at the Bear-Bull Midline of the Box.
Critical lesson:
Most “double tops” fail — and turn into rectangles.
The Ace: Head & Shoulders (~83%)
Why it works so well:
Clear distribution → failure → confirmation
Captures institutional exit mechanics
Neckline break aligns with order-flow imbalance
Both regular and inverted versions are the most reliable classical patterns when properly confirmed.
⚠️ Common mistake: It's easy to mistake a Head and Shoulders with another pattern like a Double or Triple Bottom if it's neckline is not broken well.
The Trap Pattern: Pennants (~55%)
Despite being taught alongside flags:
Pennants break against trend too often
Over-compression increases randomness
Lack clear structural dominance, Pivot HL are spots where trader's should sell.
Professional rule:
If it looks too tight, it’s probably a coin flip.
It's better to target Equal High and Lows to the left as TP.
How Professionals Actually Use Chart Patterns
We don’t trade patterns — we trade what they imply.
Patterns help answer:
Is the market accepting or rejecting price?
Are participants trapped or in control?
Is this continuation, transition, or reversal?
They work best when combined with:
Market structure (HH/HL, LH/LL)
Time-of-day context
Volume or order-flow
Higher-timeframe bias
Final Truth About Pattern Accuracy
Pattern Type Role Best Use
Flags / Channels Continuation Trend validation
Triangles Pressure build Breakout bias
Double / Triple Reversal Failure detection
Rectangles Continuation Trap identification
Head & Shoulders Reversal Distribution confirmation
Pennants ❌ Avoid
Double Bottom

Can $AMC come back to life again? NYSE:AMC is showing some good TA on the weekly and daily chart. We are visiting lows from the past, which reminds me of when I played NYSE:AMC and it visited the COVID lows.
On both the Weekly and Daily we have the MACD in GREEN, RSI crossing MA which the weekly is showing downtrend being broke.
Daily chart Is almost or is right on the 8 day crossing the 21 day EMA. Daily is also breaking the downtrend of ~$4.40 along with breaking the 100 day SMA. Holding VWAP form the low of $2.45 on 4/4/2025.
NYSE:AMC Price as of 5/15/2025: $2.81
Need to see continuation out of the downtrend with volume
Break the resistance level of $2.81 - $2.85, which has the 100 Day SMA around the $2.83 that needs to be cleared.
Then $2.90 - $3.00 and we'll follow the Fib Levels and mark support/resistance levels as we go.
This could get spicy so buckle up knuckleheads!
NYSE:AMC Daily
NYSE:AMC Weekly

HCL Technologies — 61.8% Fib Breakout Setup💻 HCL Technologies — 61.8% Fib Breakout Setup
CMP: ₹1,668
Stop Loss: ₹1,580
Targets: ₹1,747 / ₹2,002
🔍 Price Action View
Amid ongoing tariff-related news flow and elevated volatility, HCL Tech is emerging as one of the stronger names within the IT pack.
Key technical highlights:
Formation of a clear double bottom structure
₹1,747 is the critical level — it marks both the neckline of the pattern and the 61.8% Fibonacci retracement
A decisive breakout above ₹1,747 can trigger fast upside expansion, with momentum carrying the stock towards the ₹2,002 zone
This is a break-with-force setup — follow-through strength above 1,747 will be the confirmation.
⚠️ Risk & Execution Note
With high volatility in global markets, risk management becomes more important than prediction.
⚠️ Trading Approach
This is a patience trade, not a momentum chase
Reduce position sizing due to volatility
Let the price structure confirm and expand
Avoid over-leveraging; give the setup enough room
⚠️ Clarification:
This is an independent analysis based purely on technical and market study. No part of Religare is involved in this view or recommendation.
📝 Important:
I am not responsible for any loss or profit incurred. I am not taking any fees for these views – just sharing my analysis for educational and informational purposes.
📉 Disclaimer:
Not SEBI-registered. Please do your own research or consult a financial advisor before taking any investment decision.

DOUBLE TOP PATTERN – A CLASSIC BEARISH REVERSAL SETUP📚 DOUBLE TOP PATTERN – A CLASSIC BEARISH REVERSAL SETUP
The Double Top is one of the most reliable bearish reversal patterns, commonly appearing after a strong uptrend. Understanding its structure and confirmation rules helps traders avoid false signals and improve trade accuracy.
🔍 Structure of the Double Top
The pattern consists of three key phases:
1️⃣ First Top
Price rallies strongly and forms the first peak, showing strong bullish momentum.
Afterward, price pulls back, creating a temporary low — this level later becomes the neckline.
2️⃣ Second Top
Price attempts another push upward but fails to break above the first top.
This failure signals weakening buying pressure and early distribution by smart money.
3️⃣ Neckline Breakdown
The pattern is confirmed only when price breaks below the neckline.
This breakdown marks the shift from bullish control to bearish dominance.
👉 Important:
Without a neckline break, a Double Top is NOT valid.
📉 Market Meaning Behind the Pattern
- Bullish momentum weakens after the second top
- Buyers lose control, sellers gradually step in
- A neckline break confirms trend reversal
- When formed after a clear uptrend, Double Top is considered a high-probability reversal pattern
✅ Conditions for a High-Quality Double Top
For better reliability, the following conditions should be met:
✔️ A clear prior uptrend
✔️ Both tops are approximately equal in height
✔️ Volume is higher on the first top and lower on the second
✔️ Strong bearish candles or volume expansion on the neckline break
🛠️ How to Trade the Double Top
🔴 SELL Entry
The safest approach is to wait for a neckline break, then SELL on the retest of the neckline.
This reduces the risk of false breakdowns and improves risk-to-reward.
❌ Stop Loss (SL)
Place SL above the second top (or above both tops).
The stop must be outside the structure to avoid liquidity sweeps.
🎯 Take Profit (TP)
To estimate the target:
- Measure the distance from the top to the neckline
- Project that distance downward from the neckline break
⚠️ Common Mistakes to Avoid
❌ Selling just because price forms a second top
❌ Ignoring neckline confirmation
❌ Trading without volume or candle confirmation
❌ Not combining with other tools
📌 Pro Tip for Higher Accuracy
Combine the Double Top with:
- RSI divergence
- Fair Value Gaps (FVG)
- Trendlines
- Liquidity zones
This multi-confirmation approach significantly increases trade probability.

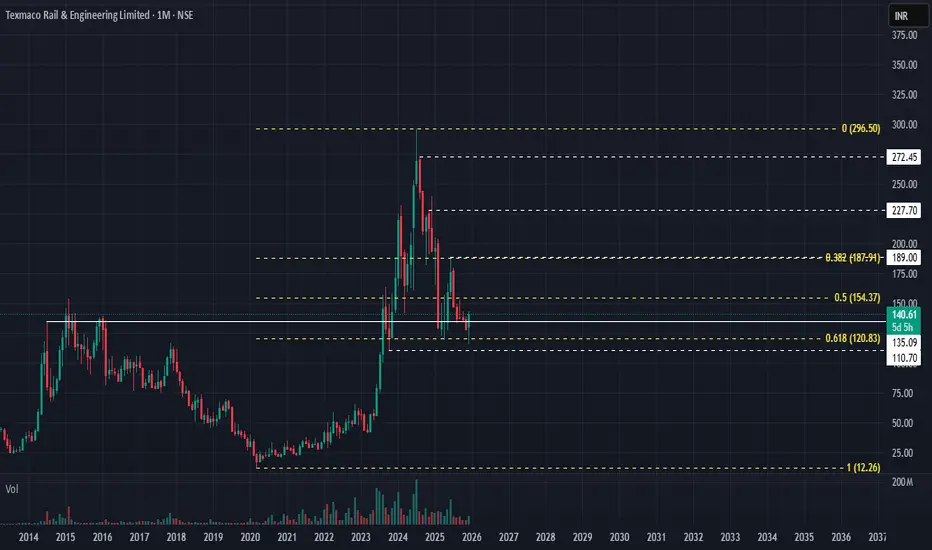
TEXRAIL (Nifty Microcap 250) – Turnaround Brewing? TEXRAIL (Nifty Microcap 250) – Turnaround Brewing? 🔄
Texmaco Rail & Engineering Ltd
📌 Trade / Swing Plan
• CMP: ₹141
• SL: ₹109
• Targets: ₹154 → ₹187 → ₹227 → ₹272
📍 Technical Logic
• Strong support at 61.8% Fibonacci (~₹120)
• Same level tested twice → confirms demand zone
• Structure supports staggered accumulation near support
• Part of Nifty Microcap 250, which is showing early reversal signs
⚠️ Risk Note:
This is volatile & risky — patience and strict position sizing required.
⚠️ Clarification:
This is an independent analysis based purely on technical and market study. No part of Religare is involved in this view or recommendation.
📝 Important:
I am not responsible for any loss or profit incurred. I am not taking any fees for these views – just sharing my analysis for educational and informational purposes.
📉 Disclaimer: Not SEBI-registered. Please do your own research or consult a financial advisor before taking any investment decision.
READY TECH HOLDINGS LTDREADY TECH HOLDINGS LTD made double with divergence along MACD cross over and RSI UPTICK. We can go long with first target of $2.77 and Final target of $3.5 in short tern view.
We can seen minor support level at $2.9.
PLease make your own analysis before taking any trade. ASX:RDY

$Btc Faces Rejection Near 91K — Key Price Action Levels to WaBitcoin is currently showing clear rejection near its previous resistance zone between $90,000 and $91,000, with repeated rejections forming around the $90,500–$90,600 area. This zone is acting as a strong supply region, and price action is struggling to sustain above it.
From a structure perspective, the market needs confirmation before considering long positions. Ideally, Bitcoin should either form a clear higher low after a controlled pullback or print a double bottom pattern while holding above the critical $80,500 support zone. If this support remains intact and buyers step in with strong volume, upside continuation can be expected.
However, if $80,500 fails, the structure weakens significantly. In that scenario, downside pressure may accelerate, opening the door for a deeper move toward the $75,000 region, which aligns with previous demand zones.
At the moment, the market structure does not favor aggressive long entries. Long positions should only be considered after confirmed price action signals such as support validation or bullish structure shift. On the other hand, short positions remain valid near resistance, especially when taken close to rejection zones with proper risk management.
Key Levels to Watch:
Resistance: $90,500 – $91,000
Immediate Support: $80,500
Breakdown Target: $75,000
Patience is key here. Let the market show its intent before committing to directional bias.

ETHUSDT Bearish Double Bottom chart patternTrading plan = Bearish ( long )
Trading pair = CRYPTOCAP:ETH
Confluence = Market Structure. Double bottom chart pattern
Take Profit = Above previous lower High
Risk Reward = 1 into 2
Time Frame = 2 hours
⚠️ Disclaimer:
This setup is shared for educational purposes only. It is not financial advice. Always do your own analysis and apply proper risk management before trading any setup

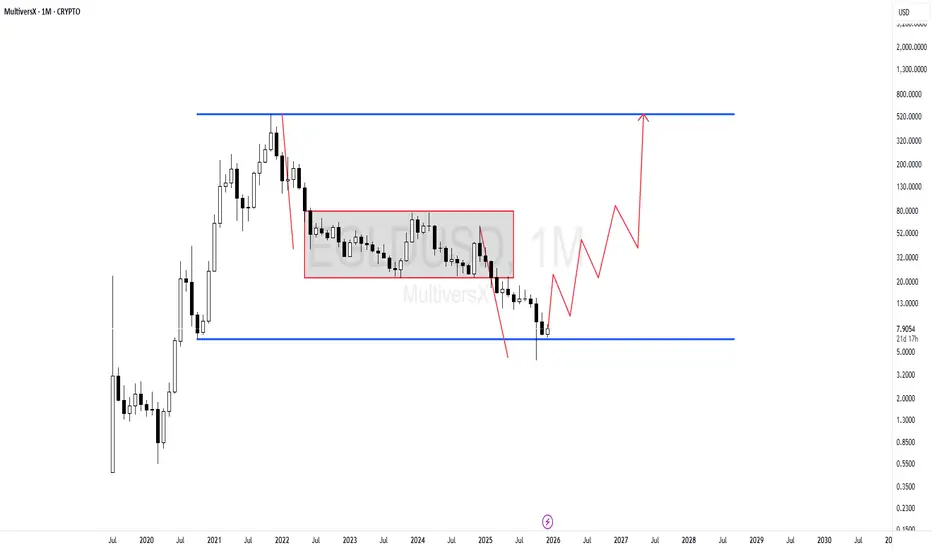
EGLD The target has given two legs of the same size and we shoulThe target has given two legs of the same size and we should wait for a micro double bottom at the bottom of the trading range.
I am waiting for a move down up down up on a monthly or weekly time frame.
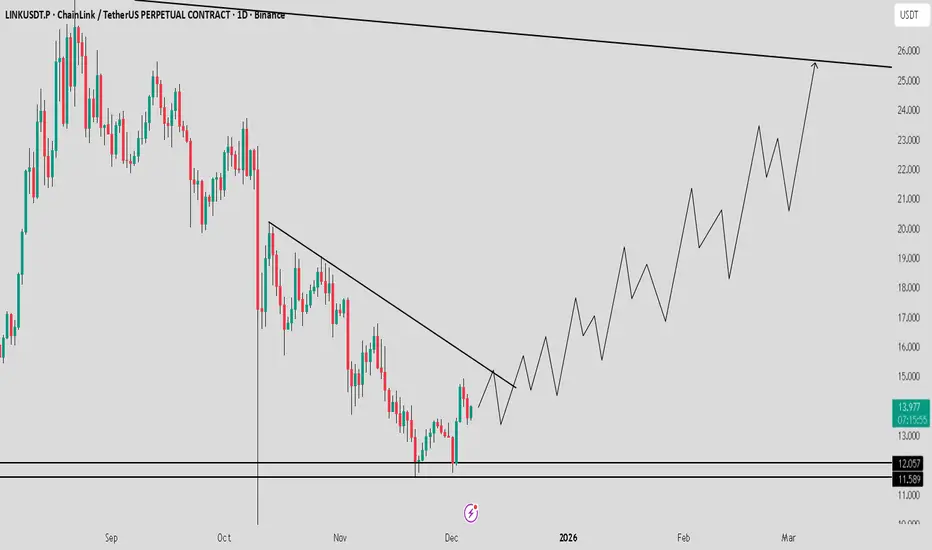
LINK Showing Strong Spot Structure_Double Bottom Point Toward 25If you want to accumulate a strong spot coin, LINK / USDT is one of the best options right now. It has formed a clean double bottom and is showing strong upward momentum. I expect a continuation move toward $25 soon. Manage risk wisely and always follow confirmations.
XAUUSD- GOLD FORMING "W" PATTERN KEY (READ CAPTION)Hello trader's what do you think about gold
Gold (XAUUSD) is currently forming a clear W Pattern / Double Bottom structure, which is a strong indication of a potential bullish reversal in the market.
Support Levels
Support 1: 4180 — A strong reaction zone where buyers have previously held the market multiple times.
Support 2: 4293 — A higher support zone that can act as a continuation level if price respects it on a pullback.
Market Outlook
The price action is showing a clean W pattern, suggesting that if the neckline breaks, we can expect a strong bullish move.
If price retraces downward, both 4180 and 4293 serve as ideal buy zones for buyers preparing for the next bullish leg.
Technical Summary
W Pattern → Potential bullish reversal
4180 → Deep correction support
4293 → Continuation support
please don't forget to like comment and follow

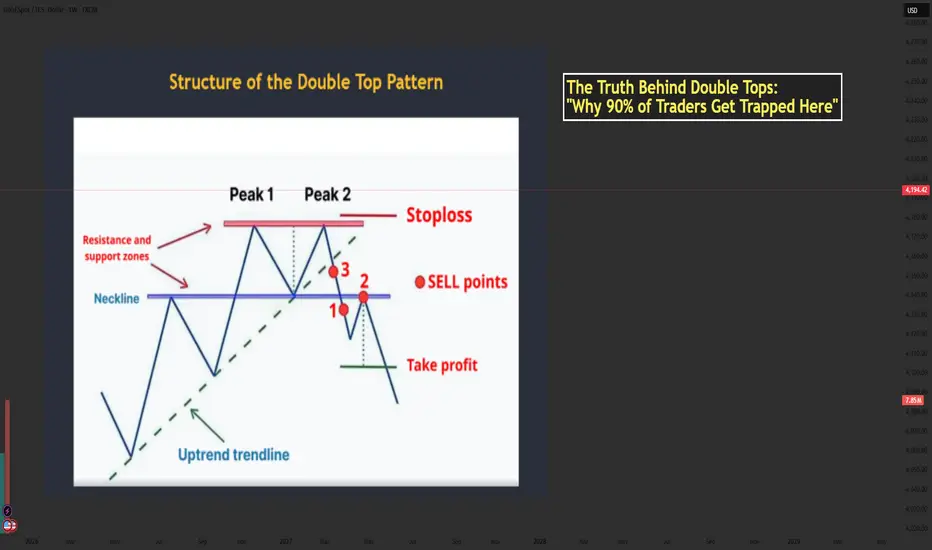
The Truth Behind Double Tops: Why 90% of Traders Get Trapped...📘 Mastering the Double Top Pattern — Structure, Psychology & How Smart Money Uses It
- The Double Top is one of the most powerful reversal patterns in technical analysis. When used correctly, it helps traders catch the transition from bullish momentum → bearish reversal with high accuracy.
- Let’s break down the structure using the chart you provided and enhance it with professional-level insights.
🔶 1. Structure of the Double Top
1️⃣ The First Top
- Price pushes upward strongly during an uptrend.
- Buyers are in full control and create the first peak.
- After reaching resistance, price pulls back → forming the neckline.
This pullback is normal and represents the market taking profits.
2️⃣ The Second Top
- Price rallies again but fails to break above Peak 1.
- This failure is extremely important — it shows bulls are losing strength.
- The second top traps late buyers who expect a breakout.
3️⃣ The Neckline Break
- Once price breaks below the neckline, the structure is officially confirmed.
- This represents sellers overwhelming buyers.
- A break of structure → shift in market control.
📌 Professional traders only consider the pattern valid AFTER the neckline break.
🔶 2. Market Psychology Behind the Double Top
Understanding the pattern’s psychology is what separates beginners from professional traders.
1️⃣ At Peak 1
Bulls believe the trend will continue.
Retail traders buy aggressively.
2️⃣ Pullback to Neckline
A healthy correction occurs; no one expects a reversal yet.
3️⃣ At Peak 2
This is where emotions start to shift:
- Retail buyers expect a breakout.
- Smart Money uses this area as a liquidity zone to trigger buy stops.
- Institutions often sell into this liquidity, creating the foundation for reversal.
4️⃣ Neckline Break
Panic begins:
Buyers trapped at Peak 2 start closing positions.
Sellers enter aggressively.
Momentum shifts — the trend has reversed.
5️⃣ Retest
The retest is a psychological trap:
- Trapped buyers hope for “one more push up.”
- Sellers add positions at better prices.
- When price rejects the neckline → the downtrend accelerates.
💡 This is why the retest is the safest sell entry.
🔶 3. Conditions for a High-Quality Double Top
To avoid fake patterns, check these criteria:
✔️ Must appear after a clear uptrend
✔️ Both tops should be similar in height
✔️ Volume should decrease on the second top
✔️ Neckline breakout must be decisive and clean
✔️ Better if second peak creates a stop-hunt wicking above Peak 1
✔️ Even more powerful when aligned with:
- HTF resistance
- Institutional zones
- Liquidity sweeps
- Overbought RSI
- Divergence
🔶 4. How to Trade the Double Top
1️⃣ Entry (Sell Zone)
Best Entry:
👉 SELL on the neckline retest after the breakout.
This gives:
- Best accuracy
- Best risk–reward
- Confirmation that the market has shifted bearish
2️⃣ Stop Loss Placement
Place SL:
- Above Peak 2
- Or above Peak 1 (more conservative)
🛑 SL must sit outside the structure to avoid fake moves.
3️⃣ Take Profit Target
The classic measurement:
- Distance from Peak → Neckline
- Projected downward
This gives the first TP.
TP2 can be placed at:
Next support zone
- Fib 1.618 extension
- HTF demand area
🔶 5. Real Market Example
Your image shows:
- Two clear peaks forming under a resistance zone
- Neckline support holding price
- A strong break below the neckline
- Sell entries at the ideal points:
+ Point 1 → aggressive breakout trader
+ Point 2 → safest retest entry
+ Point 3 → early anticipation entry (riskier)
The downward projection after the pattern aligns perfectly with the expected target zone.
🔶 6. Trader Psychology: Why People Lose with Double Tops
Most traders get trapped because they:
❌ Sell too early (before neckline break)
❌ Expect the second top to drop immediately
❌ Ignore volume or candle strength
❌ Enter without waiting for retest
❌ Fear missing out and chase price after the big drop
Smart Money uses these emotions:
- Greed → traps buyers at Peak 2
- Fear → forces panic selling at neckline break
- FOMO → attracts late sellers at the worst price
Your job is to stay patient and enter only at the retest, where probability is highest.
🔶 7. Professional Tips to Master the Double Top
✔️ Wait for structure confirmation → neckline break
✔️ Don’t sell inside the range between the two peaks
✔️ Use RSI divergence to strengthen accuracy
✔️ Look for stop-hunt wicks above Peak 2
✔️ Combine with trendline breaks for timing
✔️ Use a top-down approach (H4 + H1 → M15 entry)
✨ Final Message for Traders
The Double Top is not just a pattern it is a reflection of fear, greed, and trapped liquidity.
Master the psychology behind it, and it becomes one of your most reliable reversal tools.
If this helped your trading, drop a comment and share your thoughts!
Let’s grow together. ❤️📈

SPX Forms Global Double-Bottom PatternThe SPX has formed a global W pattern, or double bottom , and is currently in the final phase of the formation, which is likely to reach the liquidation zone highlighted in purple.
Current price: $0.6333
If the price breaks the level where the previous peak bottomed, the ascending structure is more likely to be broken, and the movement may continue downward.
Full breakdown on website

Cognex (CGNX) – Downtrend Breakout + Double Bottom ConfirmationOn the Weekly timeframe , NASDAQ:CGNX is showing strong bullish technical signals:
The long-term downtrend line has been broken both on body and shadow, confirmed with high volume .
The last weekly candle is forming near a retest, while on the Daily chart, a strong bullish candle confirms buyers stepping in.
A clear Double Bottom pattern has formed, with the neckline overlapping the downtrend line, providing stronger confirmation.
Price is trading above EMA50 & EMA100 , with EMA50 attempting a bullish cross over EMA100.
The stock has also broken through local resistance , opening the way for higher targets.
MACD is bullish, showing positive momentum.
RSI is already inside the overbought zone. However, since no divergence is present, this could still support bullish continuation, though short-term pullbacks are possible.
Key Levels:
If the breakout and retest confirm, the first target is the nearby resistance zone.
A further move towards the next resistance level (~$72–73) is possible if momentum sustains.
Important Note:
This analysis is not a buy/sell signal , but rather an educational outlook. While technicals are bullish, traders should remain cautious as RSI is in the overbought zone, where short-term corrections are common.
(For educational purposes only, not financial advice.)

GOLD (XAU/USD): Bullish Sentiment ConfirmedGold is currently exhibiting a bullish trend.
Following the establishment of a new higher high, the pair retraced to a rising trend line.
Upon testing this trend line, the market formed a double bottom formation and subsequently violated its neckline.
It is anticipated that buyers will continue to drive the pair upward.
The target is 4,200.

USD/JPY –Bullish Double-Bottom Targeting Major Weekly ResistanceThis USD/JPY weekly chart is showing a clean double-bottom reversal structure formed at a strong higher-timeframe support zone (≈138.00–140.00). The first rejection created Swing Low 1, and the second rejection created Swing Low 2, both tapping the same demand block — a classic sign that buyers are aggressively defending this level.
Price then pushed upward, breaking toward the neckline, confirming early bullish momentum. Volume Profile on the right shows a clear low-volume pocket above current price, meaning once price breaks through the neckline area, it can accelerate very quickly toward the next major liquidity pool.
The primary upside target is the weekly resistance zone around 160.00–163.00, where previous supply and liquidity reside. The dotted projection on the chart represents bullish continuation, showing buyers likely stepping in on minor pullbacks.
Overall, this chart is signaling a high-probability bullish continuation, as structure, support, and volume profile all align for upside movement.

US DOLLAR INDEX (DXY): Bullish Movement Confirmed?!Following a recent bearish movement, the 📈DXY has corrected to a previously breached key structural level.
I have identified two significant bullish confirmations after this test: the price has violated the neckline of a double bottom pattern and the resistance line of a falling parallel channel pattern.
Both breakouts suggest a high probability of a bullish trend resumption.
The market will probably continue its upward trajectory and reach the 99.70 level in the near term.

$TZA: BULLISH PATTERNS AMEX:TZA : This chart is quite interesting.
Starting point: The MACD indicates a buy signal, and the 14-period RSI is at 60 (though not shown). Therefore, everything considered, the trend appears to be bullish.
I can identify two possible patterns:
1) Since the low on October 27, AMEX:TZA is unfolding a Zigzag (ABC) pattern. The 1x1 extension for the wave (C) at 9.22. Additionally, a double bottom pattern is present with a target of 9.45.
2) AMEX:TZA has formed an inverse head and shoulders (IHS) pattern with a target at 10.52. It’s worth noting that the right shoulder may be somewhat indistinct.
In any case, we will see how the price develops.

Bitcoin Falling Wedge Signals Breakout or Breakdown ZoneBitcoin is trading inside a falling wedge, a pattern that traditionally leans bullish when the breakout occurs.
At the same time, the price is approaching a historically sensitive region — the 112,000 USD zone, which is acting as the potential Point A (left shoulder zone).
If Bitcoin rejects from 112k–113k, this level may complete the left side of a developing head and shoulder formation, especially if the market loses its neckline later.
Important Supports to Watch
$97,000 → The most crucial support on the daily.
$97,500–$98,000 → Double-bottom demand zone.
$92,000 → The next major support & unfilled gap region.
A clean break below 97k will flip the entire market structure bearish and likely trigger a rapid decline toward 92k, confirming the neckline breakdown of a head and shoulder setup.
Bullish Scenario
If BTC forms a double bottom around 97.5k–98k, or if it sweeps liquidity and reclaims the level:
The falling wedge can break upward.
A push toward 112k becomes highly probable next week.
A breakout above 113k invalidates the bearish reversal and opens the way for continuation to higher levels.
This scenario requires a successful retest of the falling wedge breakout and strong volume.If BTC gets rejected at 112k–113k, and later breaks down below 98k, the chart will complete:
A textbook head and shoulder
A lost wedge structure
Momentum shift from bullish to bearish
This breakdown can trigger a high-velocity dump into the 92k gap zone.What Traders Should Focus On
112k–113k → Critical rejection zone to confirm the left shoulder.
97k–98k → Most important support and possible double-bottom area.
92k → Final downside target if BTC loses the neckline.
Watch for liquidity sweeps and volume strength to validate direction.Final View
Bitcoin is entering a decision phase.
The chart is offering both bullish wedge breakout potential and bearish head and shoulder risk, depending on how price reacts at 112k and 97k.
This is a position where traders should stay alert and wait for clean confirmation from either the breakout or the breakdown before placing major trades.

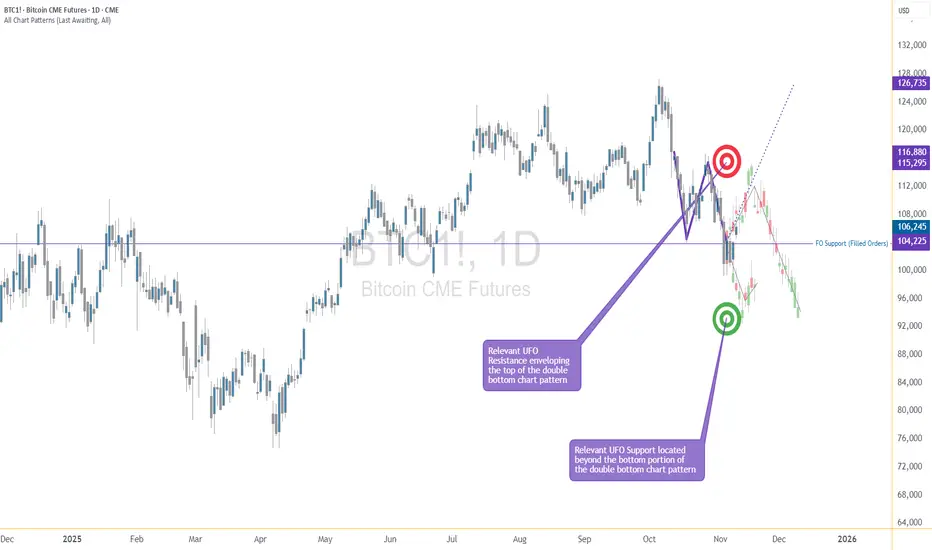
The Pattern That Looked Bullish… Until It Didn’t1. The “Too Good to Be True” Setup
You’ve seen it a hundred times — that shiny W-shaped pattern that screams reversal.
Traders spot it, celebrate it, and rush in before it even completes.
But not every double bottom deserves a standing ovation. Sometimes, what looks like a powerful comeback is actually the calm before another dip.
2. Meet the Real Players: FO vs. UFO
Behind every pattern hides a tug-of-war between two invisible forces:
FO (Filled Orders): Where buyers already did their job. The gas tank’s empty.
UFO (UnFilled Orders): Where fresh buyers are still waiting. That’s where the real fuel sits.
In our current setup, price bounced from an FO zone that already spent its energy.
The next UFO zone — the untouched demand — sits lower.
Translation? The market might need one more leg down to refuel before any real rally begins.
3. The Bear Hiding Inside the Bull
Chart shapes can lie.
Order flow doesn’t tend to.
When price sits on an FO support and the next UFO level is far below, odds tilt toward a break, not a bounce.
It’s like jumping on a trampoline that’s already been stretched too far — it might not spring you up again this time.
4. Rethink “Confirmation”
Pattern traders often buy the moment they spot symmetry. Smart traders wait for liquidity confirmation — the moment unfilled demand actually engages.
If that doesn’t happen, all you’ve got is a good-looking shape on a tired level.
5. The Real Lesson
Patterns attract attention.
Order flow reveals intent.
Patience separates analysis from impulse.
The next time a chart whispers “reversal,” ask yourself: Is it running on new energy or recycled hope?
Want More Depth?
If you’d like to go deeper into the building blocks of trading, check out our From Mystery to Mastery trilogy, three cornerstone articles that complement this one:
🔗 From Mystery to Mastery: Trading Essentials
🔗 From Mystery to Mastery: Futures Explained
🔗 From Mystery to Mastery: Options Explained
When charting futures, the data provided could be delayed. Traders working with the ticker symbols discussed in this idea may prefer to use CME Group real-time data plan on TradingView: www.tradingview.com - This consideration is particularly important for shorter-term traders, whereas it may be less critical for those focused on longer-term trading strategies.
General Disclaimer:
The trade ideas presented herein are solely for illustrative purposes forming a part of a case study intended to demonstrate key principles in risk management within the context of the specific market scenarios discussed. These ideas are not to be interpreted as investment recommendations or financial advice. They do not endorse or promote any specific trading strategies, financial products, or services. The information provided is based on data believed to be reliable; however, its accuracy or completeness cannot be guaranteed. Trading in financial markets involves risks, including the potential loss of principal. Each individual should conduct their own research and consult with professional financial advisors before making any investment decisions. The author or publisher of this content bears no responsibility for any actions taken based on the information provided or for any resultant financial or other losses.
Multiple pattern breakoutThe stock has broken down trendline with volumes. It has broken double bottom pattern. It is trading above 50 Ema. Targets are marked on the chart.

$BTC Double Bottom Near 98K, Eyes on 109K Liquidity HuntBitcoin is currently retesting the crucial 98K support area, forming a potential double bottom pattern on the 4H chart. This zone is acting as a decisive pivot — a confirmed bullish 4H close from here could trigger a sharp liquidity grab toward the 109K region, where late short positions might get squeezed.
However, if the 98K support fails to hold and the candle closes below it, the structure weakens, opening room for a deeper correction toward 95K–90K.
For now, this area remains a high-reward zone for cautious long entries, only after confirmation of a bullish 4H close.
📊 Trade Plan Summary:
Bullish scenario: Longs above 98K confirmation → Target 109K
Bearish scenario: Breakdown below 98K → Downside to 95K–90K
Key zone: 98K (Major structural support)
⚠️ Always wait for confirmation before entering; market may still sweep liquidity before the real move begins.
