The Pattern That Looked Bullish… Until It Didn’t1. The “Too Good to Be True” Setup
You’ve seen it a hundred times — that shiny W-shaped pattern that screams reversal.
Traders spot it, celebrate it, and rush in before it even completes.
But not every double bottom deserves a standing ovation. Sometimes, what looks like a powerful comeback is actually the calm before another dip.
2. Meet the Real Players: FO vs. UFO
Behind every pattern hides a tug-of-war between two invisible forces:
FO (Filled Orders): Where buyers already did their job. The gas tank’s empty.
UFO (UnFilled Orders): Where fresh buyers are still waiting. That’s where the real fuel sits.
In our current setup, price bounced from an FO zone that already spent its energy.
The next UFO zone — the untouched demand — sits lower.
Translation? The market might need one more leg down to refuel before any real rally begins.
3. The Bear Hiding Inside the Bull
Chart shapes can lie.
Order flow doesn’t tend to.
When price sits on an FO support and the next UFO level is far below, odds tilt toward a break, not a bounce.
It’s like jumping on a trampoline that’s already been stretched too far — it might not spring you up again this time.
4. Rethink “Confirmation”
Pattern traders often buy the moment they spot symmetry. Smart traders wait for liquidity confirmation — the moment unfilled demand actually engages.
If that doesn’t happen, all you’ve got is a good-looking shape on a tired level.
5. The Real Lesson
Patterns attract attention.
Order flow reveals intent.
Patience separates analysis from impulse.
The next time a chart whispers “reversal,” ask yourself: Is it running on new energy or recycled hope?
Want More Depth?
If you’d like to go deeper into the building blocks of trading, check out our From Mystery to Mastery trilogy, three cornerstone articles that complement this one:
🔗 From Mystery to Mastery: Trading Essentials
🔗 From Mystery to Mastery: Futures Explained
🔗 From Mystery to Mastery: Options Explained
When charting futures, the data provided could be delayed. Traders working with the ticker symbols discussed in this idea may prefer to use CME Group real-time data plan on TradingView: www.tradingview.com - This consideration is particularly important for shorter-term traders, whereas it may be less critical for those focused on longer-term trading strategies.
General Disclaimer:
The trade ideas presented herein are solely for illustrative purposes forming a part of a case study intended to demonstrate key principles in risk management within the context of the specific market scenarios discussed. These ideas are not to be interpreted as investment recommendations or financial advice. They do not endorse or promote any specific trading strategies, financial products, or services. The information provided is based on data believed to be reliable; however, its accuracy or completeness cannot be guaranteed. Trading in financial markets involves risks, including the potential loss of principal. Each individual should conduct their own research and consult with professional financial advisors before making any investment decisions. The author or publisher of this content bears no responsibility for any actions taken based on the information provided or for any resultant financial or other losses.
Double Bottom
Multiple pattern breakoutThe stock has broken down trendline with volumes. It has broken double bottom pattern. It is trading above 50 Ema. Targets are marked on the chart.

$BTC Double Bottom Near 98K, Eyes on 109K Liquidity HuntBitcoin is currently retesting the crucial 98K support area, forming a potential double bottom pattern on the 4H chart. This zone is acting as a decisive pivot — a confirmed bullish 4H close from here could trigger a sharp liquidity grab toward the 109K region, where late short positions might get squeezed.
However, if the 98K support fails to hold and the candle closes below it, the structure weakens, opening room for a deeper correction toward 95K–90K.
For now, this area remains a high-reward zone for cautious long entries, only after confirmation of a bullish 4H close.
📊 Trade Plan Summary:
Bullish scenario: Longs above 98K confirmation → Target 109K
Bearish scenario: Breakdown below 98K → Downside to 95K–90K
Key zone: 98K (Major structural support)
⚠️ Always wait for confirmation before entering; market may still sweep liquidity before the real move begins.

The Double Bottom Trap That Traders Might Miss1. The Comfort Zone of Classic Patterns
Few formations attract traders’ attention like a double bottom. It’s one of those timeless chart patterns that promise hope after a long decline—a visual story of selling exhaustion followed by a bullish reversal.
But markets rarely reward what’s obvious. In futures trading, especially when examining instruments like Bitcoin Futures (BTC) and Micro Bitcoin Futures (MBT), patterns are only half the story. What truly moves price isn’t just the shape on the chart—it’s the order flow behind it.
That’s where understanding FO (Filled Orders) and UFO (UnFilled Orders) becomes essential. Both represent past and potential liquidity imbalances, and reading their relationship can transform how traders interpret “classic” setups.
2. The Bitcoin Setup: A Tale of Two Bottoms
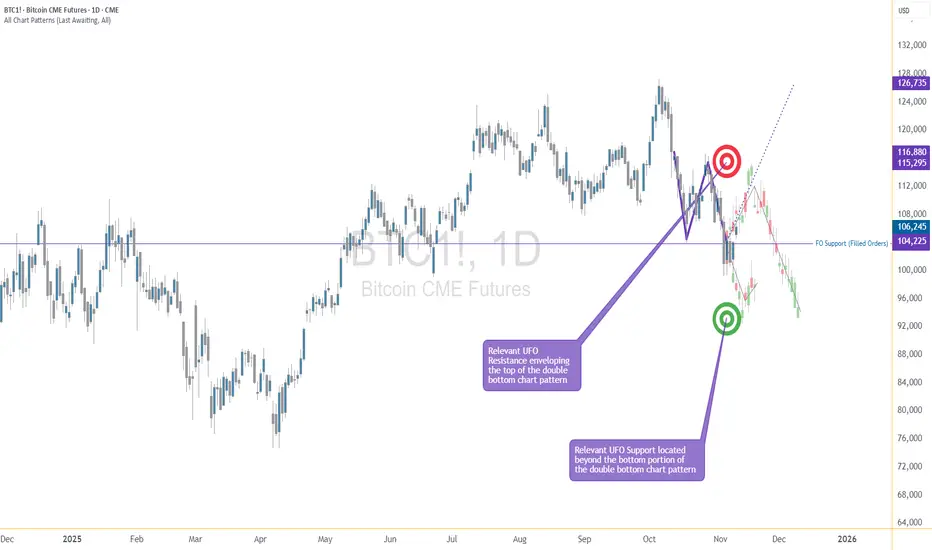
The current BTC daily chart paints what seems like a textbook double bottom. Two price troughs form near the same horizontal area around $104,000, setting up the typical “W” shape many traders see as a bullish reversal pattern.
However, when we dig deeper into the order flow structure, the illusion begins to fade.
A FO Support level exists near $103,860, meaning that this area previously attracted enough buyers to halt a decline—but those orders have already been filled and we know this given the fact that price turned at that price level before.
The next UFO Support zone sits much lower, around $95,640. That’s where unfilled buy orders are expected to remain waiting, untouched.
This distinction matters. While FO zones mark previous turning points, UFO zones highlight potential turning points that still contain resting liquidity. In simple terms, FO areas represent “used energy,” while UFO areas represent “stored energy.”
3. FO vs. UFO – The Order Flow Reality Check
Let’s define these two concepts with precision:
FO (Filled Orders): Price zones where significant buying or selling already occurred. These levels once reversed price, but because those orders were executed, fewer remain to defend the level again.
UFO (UnFilled Orders): Price zones containing pending buy or sell orders not yet triggered. They represent areas of fresh imbalance and therefore carry a higher probability of influencing future price moves.
In our Bitcoin case, the FO Support around $103,860 has done its job already—it stopped price before. But now, the unfilled buying interest lies lower, implying that the market may need to travel down to reach fresh demand at $95,640.
On the other side, UFO Resistance hovers near $112,410, enveloping the top of the double bottom structure. Should the price rebound toward that level, sellers waiting there could re-enter the scene, potentially capping any bullish recovery.
The conclusion? This pattern isn’t as bullish as it looks.
4. When Bullish Shapes Hide Bearish Probabilities
Most traders spot the double bottom and immediately think “trend reversal.” Yet, the distance between FO and UFO levels tells a more subtle story.
Since FO Support levels carry reduced strength after being tested, they’re more likely to break than hold. In this context, the probability favors a downside continuation rather than an immediate bounce.
If price breaches $103,860, the next probable destination becomes the UFO Support at $95,640. Only then, after reaching that pocket of unfilled demand, might a significant rebound have higher odds.
It’s a reminder that technical patterns, while valuable, must always be filtered through liquidity context. A pattern without order flow validation is like reading the market’s outline without its story.
5. Quantitative Insight: A Probabilistic Lens
Think of this in probabilistic terms:
When FO zones sit above UFO zones, the market often continues toward the unfilled liquidity.
When UFO zones lie closer to current price, reversals occur faster because demand (or supply) is still waiting to be executed.
In our example, BTC shows a larger gap between FO and UFO support levels, signaling lower immediate reversal odds. The chart may appear bullish, but the underlying order flow distribution points to weakness first, strength later.
This is not a prediction—it’s an observation of potential. It allows traders to structure their expectations based on where fresh participation is more likely to emerge.
6. Risk Management: Navigating the Trap
For traders considering setups around this structure, risk management is crucial.
Entry awareness: Avoid entering long positions purely because a double bottom “looks bullish.” Consider waiting for evidence of unfilled demand being triggered (confirmation at or near UFO Support).
Stop-loss placement: Stops below FO Support can easily be hunted in liquidity sweeps; better to align risk control with genuine unfilled demand areas.
Reward-to-risk thinking: A test of the UFO Support near $95,640 could later offer a more favorable upside-to-downside ratio than buying prematurely at $104,000.
Remember, pattern-based entries without liquidity confirmation often carry poor asymmetry—small upside with large downside risk.
7. Futures Structure and Margin Awareness
Both BTC and MBT represent Bitcoin exposure via futures contracts, but their sizing differs dramatically.
BTC equals 5 Bitcoin per contract, making it suitable for larger, institutional players. (1 Tick = 5 = $25. Required Margin = $132,500)
MBT, the Micro Bitcoin Futures, equals 0.1 Bitcoin per contract, offering flexibility for smaller accounts and finer position scaling. (1 Tick = 5 = $0.50. Required Margin = $2,600)
Understanding margin requirements is essential—these products are leveraged instruments, and small price changes can result in large percentage gains or losses.
8. Key Takeaway: The Hidden Lesson
This entire setup illustrates a powerful educational point:
Chart patterns may draw the eye, but order flow tells the truth.
The double bottom may invite buyers, but the imbalance between FO and UFO zones exposes an underlying weakness. Traders who rely solely on visual patterns may walk straight into a trap. Those who align patterns with liquidity insights, however, read the market at a deeper level.
In the current context, BTC and MBT might need to visit lower support levels before finding true stability. Watching how price behaves around these unfilled order zones will reveal whether this double bottom turns into a lasting floor—or just another false start.
When charting futures, the data provided could be delayed. Traders working with the ticker symbols discussed in this idea may prefer to use CME Group real-time data plan on TradingView: www.tradingview.com - This consideration is particularly important for shorter-term traders, whereas it may be less critical for those focused on longer-term trading strategies.
General Disclaimer:
The trade ideas presented herein are solely for illustrative purposes forming a part of a case study intended to demonstrate key principles in risk management within the context of the specific market scenarios discussed. These ideas are not to be interpreted as investment recommendations or financial advice. They do not endorse or promote any specific trading strategies, financial products, or services. The information provided is based on data believed to be reliable; however, its accuracy or completeness cannot be guaranteed. Trading in financial markets involves risks, including the potential loss of principal. Each individual should conduct their own research and consult with professional financial advisors before making any investment decisions. The author or publisher of this content bears no responsibility for any actions taken based on the information provided or for any resultant financial or other losses.

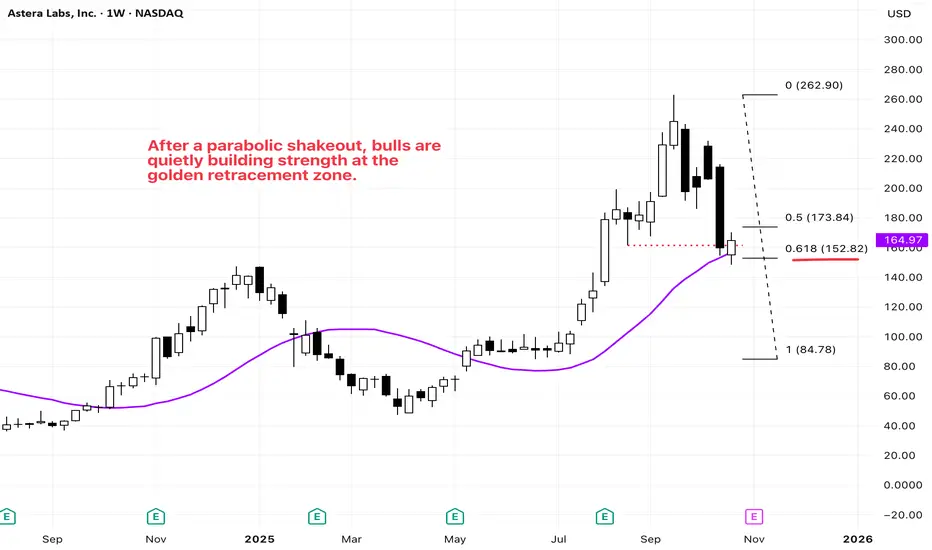
NASDAQ: ALAB — Holding the Golden Zone After a Parabolic DropALAB shows a structure similar to RDDT(see my previous idea) — a newly listed growth stock that gained strong momentum after breaking above its weekly SMA 20 in mid-May.
After reaching an all-time high, the stock started to pull back in late September.
Recently, a sharp parabolic drop drove the price down toward a confluence of supports:
* the previous swing low around $160(red dotted line),
* the weekly SMA 20 (purple),
* and the Fibonacci 0.618 retracement level of the recent rally.
This week’s candle closed bullishly, reclaiming the $160 area and confirming strong demand at this golden zone. The sharp sell-off likely flushed out retail stop orders, providing the base for a potential next leg up.
Overall, this area offers an attractive risk-to-reward setup, with technical supports aligning across multiple timeframes.
NYSE: RDDT Weekly – A Classic 0.618 Pullback in PlayRDDT has been trending higher since April, and its uptrend gained momentum after breaking above the 20-week SMA in mid-June.
The stock saw some pullback in mid-September, retesting the previous swing low around 205 (red dotted line), which also lines up with the rising trendline (green) and the 20-week SMA (purple) — right near the key Fibonacci 0.618 level.
This week, price bounced from that confluence zone and closed with a bullish candle, reclaiming the previous low. The move looks like a possible stop-hunt before the next leg higher, showing that buyers are defending this key support area.

EURUSD BTMM Analysis – Potential Reversal SetupOn the 1-hour chart, EURUSD continues to follow a clear downward trend, with price forming multiple lower highs and lower lows across the week.
Currently, the pair is trading near a potential reversal zone, where market makers may begin accumulation before a shift in direction. The MAs remain bearish, but early signs of exhaustion are visible as momentum slows near 1.1550 support.
If price forms a clear structure shift (SOC) or stop-hunt low, the setup could confirm a Day 1 reversal leading into a bullish retracement or a new cycle phase.
Bias: Preparing for possible bullish reversal
Confirmation: Structure break and hold above intraday highs
Invalidation: Sustained breakdown below 1.1530

Double Bottom + Bullish Divergence.2070 Saudi Pharmaceutical
Closed at 27.74 (10-09-2025)
Double Bottom + Bullish Divergence.
Very Important Support level around 26 - 26.70
Sustaining this level may lead it towards 30 & then 33.
However, it should not break 21 now.

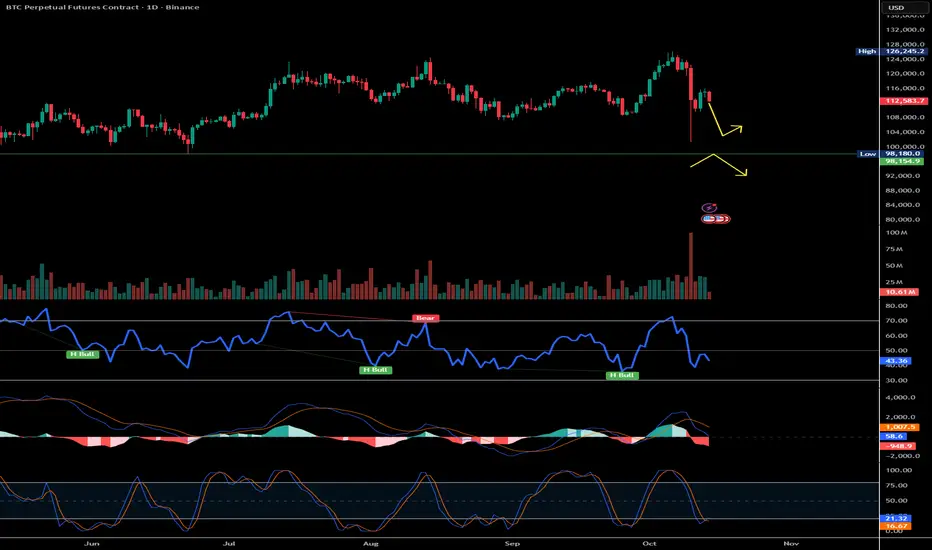
$BTC Correction : Watch for Double Bottom or Deeper Drop to 88kBitcoin faced a clear rejection around the 116,500 zone, marking a fresh lower high and confirming that a corrective phase is in play. At this stage, price action suggests a potential formation of a double bottom or a wick recovery setup — with nearly 70% of the wick zone likely to be filled as liquidity gets tapped.
In the bullish case, a rebound from the current structure could fuel an upside move once the lower support holds. However, if BTC loses the 98,000 support, it opens the door for a deeper correction toward the 88,000–90,000 range.
For now, short trades remain more favorable until we get a confirmed double-bottom or clear reversal signal. Once the market structure shifts and liquidity from the lower zones gets cleared, long setups can be reconsidered.
Let’s see how Bitcoin reacts around these levels — the next few candles will define whether the correction deepens or reverses.
#Bitcoin #BTCAnalysis
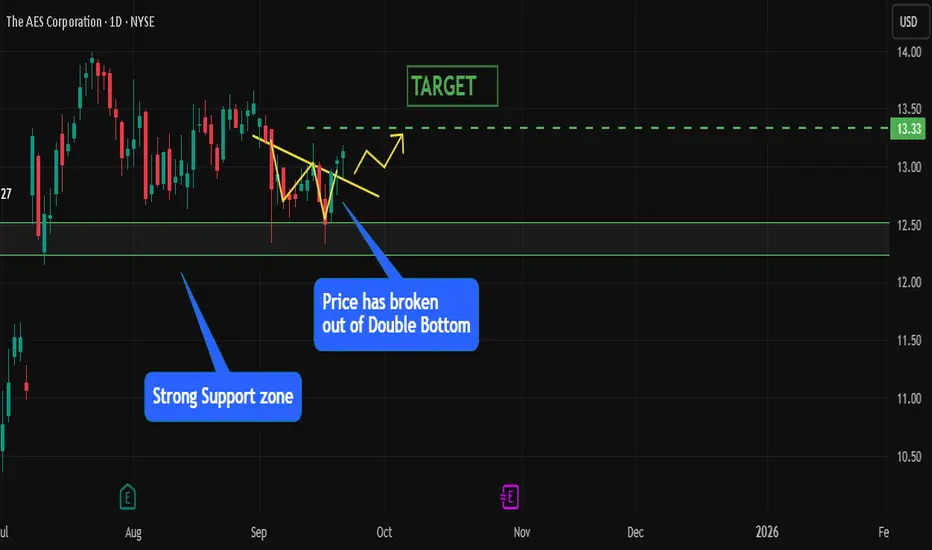
AES Springs Out of Double BottomAES has been showing a constructive setup on the charts, and the latest move looks like a clear signal from the bulls. Recently, the stock broke out of a Double Bottom pattern , which is widely considered a bullish reversal structure. This pattern often marks the end of a downtrend and the start of a potential uptrend, especially when supported by volume and clear support levels.
Adding to the strength of this breakout, AES took support from a strong support zone in the range of 12.24–12.5 . This area has acted as a solid base where buyers consistently stepped in, preventing further downside. The fact that the stock respected this zone before bouncing gives extra conviction that the downside is well protected in the near term.
Now, with the breakout confirmed and buyers back in control, the next logical upside level comes in at 13.33 . This acts as the immediate price target based on the pattern’s projection and prior resistance levels.
If AES continues to hold above the breakout area, momentum could carry it higher in the short term, attracting more participants who missed the initial move. On the flip side, a sustained break back below the 12.24 zone would weaken this bullish setup.
Overall, the technical confluence of a Double Bottom breakout , strong support zone confirmation , and a clear price target of 13.33 makes AES an attractive setup to watch in the coming sessions.
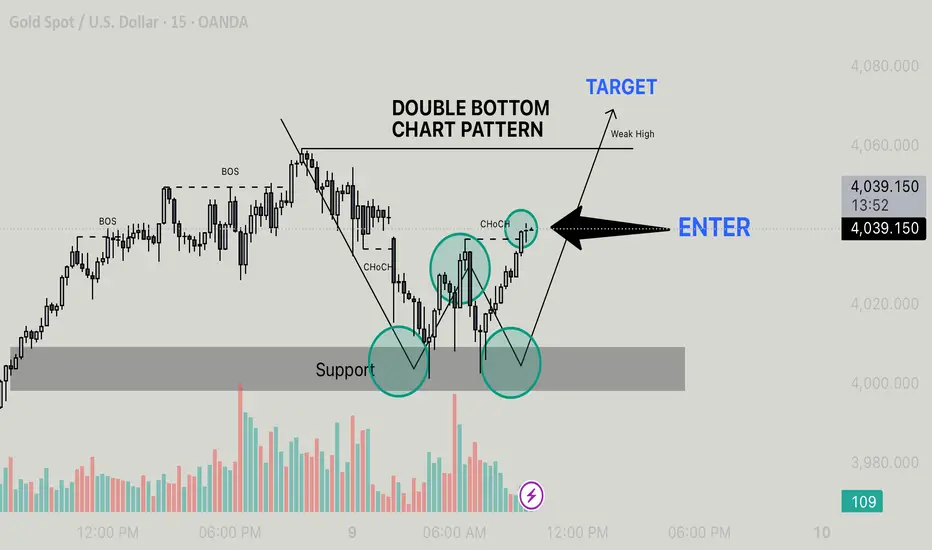
Xau/Usd - Double Bottom Breakout & Bullish Reversal Support Zone: Price tested a key support level (gray area) twice, forming a classic Double Bottom pattern.
CHoCH (Change of Character): After the second bottom, price broke above the previous minor high, signaling a potential reversal from bearish to bullish.
Volume Confirmation: Increased buying volume at the second bottom supports bullish momentum.
Trade Plan:
Entry Point: Marked at 4,037.260 after confirmation of CHoCH and bullish candle close above neckline.
Target: Aiming for the Weak High area (prior resistance level).
Risk Management:
Stop Loss: Below the second bottom and support zone (approx. < 4,000 level).
Risk-Reward: Minimum 1:2 to weak high.
Bullish Bias Justification:
Double Bottom pattern indicates accumulation.
CHoCH confirms early trend reversal.
Break of Structure (BOS) aligns with bullish continuation.
Clear breakout from bearish trendline adds confluence.
Trying to find a base (USD/CHF)Setup: Possible bottom. Two failed breaks below 0.79 + RSI bullish divergence.
Signal : Waiting for daily close above down trendline
Plan B A weekly close below 0.79 shows long term downtrend stil in tact
XAN Double bottomXAN shows us a double bottom pattern what can lead to a upwards trend and will give us about 80% profit.
Always do your own research, this is no financial advice.

DUOL - NOT FOR TREND-FOLLOWING TRADERS DUOL - CURRENT PRICE : 271.28
Duolingo, Inc. (DUOL) is in a downtrend since 14 May 2025. The stock has recently tested the support level near USD 263, which coincides with a previous demand zone. This bounce from support highlights buying pressure, indicating the likelihood of a short-term reversal.
The Relative Strength Index (RSI) has moved near 30 level, signaling that the stock is in oversold territory. Oversold conditions often precede a technical rebound as selling pressure eases.
The confluence of oversold momentum and price stabilization at support suggests a possible bounce play. If buying volume increases, the stock could recover toward USD 297 – 325, its next resistance zone.
ENTRY PRICE : 271.00 - 272.00
TARGET : 297.00 and 325.00
SUPPORT : 260.00 (CUTLOSS below 260.00 on closing basis)
Notes : As the dominant trend is clearly bearish (downtrend) since 14 May 2025, this setup is not for trend-following traders.

Adobe (ADBE) – Double Bottom + EMA50 Breakout PotentialOn the Daily timeframe, NASDAQ:ADBE is showing early signs of strength:
A Double Bottom pattern has formed, often seen as a bullish reversal signal.
RSI divergence was present at the pattern lows, and RSI has broken above its trendline, suggesting momentum shift.
Price closed above the EMA50 , an important technical milestone.
MACD is in positive territory, supporting a potential continuation upward.
Volume has not spiked dramatically, but it is gradually increasing compared to recent history.
Key Levels:
If the downtrend resistance line is broken and price retests neckline/downtrend area successfully, the pattern projects a move at least towards the next local resistance zone.
Confirmation is crucial: a breakout without retest can be a false signal.
Important Note:
This analysis is not a buy/sell signal. It highlights potential upside if key technical levels are broken and confirmed. Patience for breakout + retest may provide a clearer setup.
(For educational purposes only, not financial advice.)

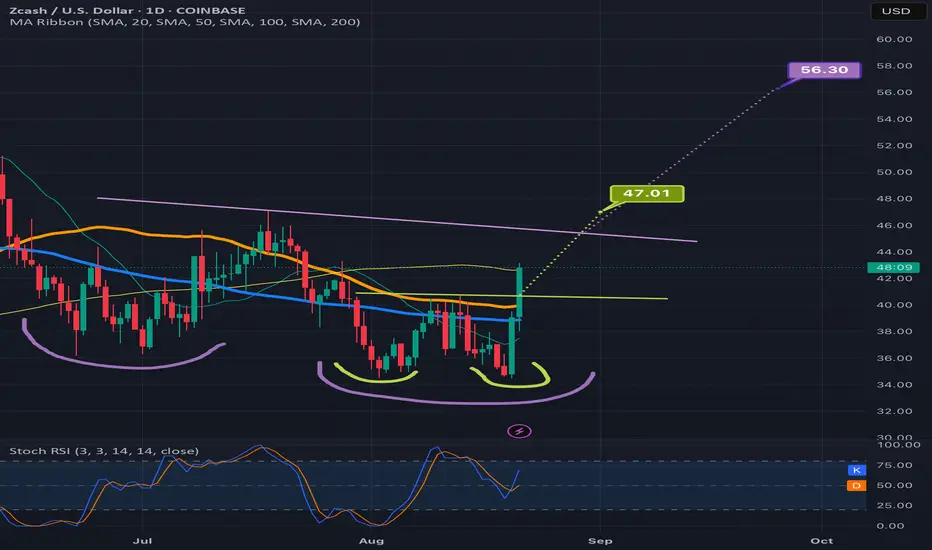
Zcash may be ready to trigger a double double bottomPrice is firmly above the smaller lime green neckline at the moment and likely to trigger the breakout, the ful target of which would send price action above the neckline of the larger double bottom pattern. *not financial adviice*
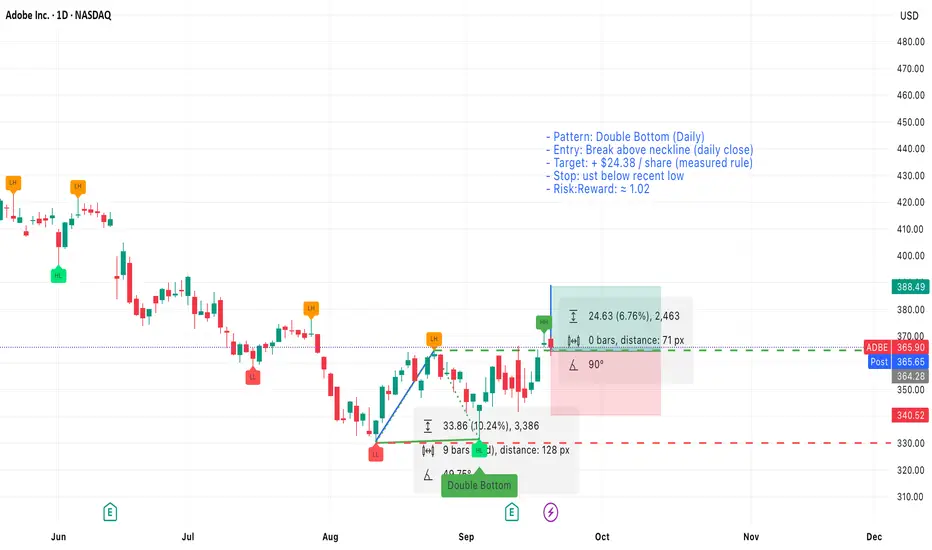
Adobe (ADBE) — Daily — Double BottomSetup
Pattern: Double bottom on the daily chart with two clear lows and a visible neckline.
Timeframe: Daily
Measuring rule (target)
Measure the vertical distance from the bottoms to the neckline and add it to the breakout point. Using this method the measured target equals +$24.38 per share from the breakout.
Entry & trigger
- Enter long on a confirmed close above the neckline (daily close above neckline).
- If you prefer an earlier entry, a volume-backed intraday break above the neckline can be used, but prefer a daily close for confirmation.
Stop loss
- Place stop loss just below the recent low (the second bottom). Use a few cents/pips buffer below that low to avoid noise.
Position sizing & risk
- Risk per share = entry price − stop loss price.
- With the stop placed just below the recent low, risk per share is small and gives a risk/reward ratio ≈ 1.02 .
Given the measured target of +$24.38, ensure your entry and stop sizing produce the stated R:R — example calculations below.
Notes & trade management
- Prefer a daily close above the neckline with increased volume for higher probability.
- If price returns to retest the neckline, consider adding only if support holds and risk remains acceptable.
- Trail stop to breakeven after a significant portion of the measured move is achieved (for example, after +50% of the $24.38 move).
$USDT Dominance Bullish Divergence Signals RotationUSDT dominance is flashing a clean bullish divergence while MACD builds a tidy double-bottom structure. When the USDT share of the market starts climbing, it usually means traders are rotating into cash for safety. That often lines up with softer BTC momentum and underperformance across altcoins.
What I’m watching:
Momentum: bullish divergence suggests buyers are defending the recent higher low on dominance.
MACD: a double bottom with a fresh uptick strengthens the case for a push higher.
Market knock-on: a rising USDT dominance tends to pressure BTC first, then bleeds into ALT/BTC pairs.
How I’m planning it:
If dominance breaks above the recent swing high with expanding momentum, I’ll trim risk on alts, favor BTC over high-beta names, and wait for cleaner entries after a reset.
If dominance stalls at resistance and rolls over, that’s my cue for a short-term risk-on bounce, with attention on strong ALT/BTC setups.
Alerts: prior swing high on dominance, MACD signal cross, and any bearish divergence that hints at a rollover.
Invalidation:
A daily close back below the most recent higher low on dominance plus a MACD roll-down would weaken the thesis and point to a relief phase for alts.
TL;DR: USDT dominance looks ready to push higher on bullish divergence and a MACD double bottom. Historically, that leans risk-off for BTC and alts until dominance cools off again.

Double Bottom Reversal likely for GBPAUDPrice has been moving in a clear downtrend inside a descending channel. After this recent fall, notice how price seems to have formed a double bottom. This particular pattern often shows up after a big decline like so.
The neckline, is a key level to watch now, and price is starting to break above it. A strong breakout candle can confirm this pattern, but the safer play is to wait for price to come back and retest the neckline. If the old resistance now holds as support, that’s the ideal spot to join the move.
The projected target comes from measuring the height of the double bottom and adding it to the neckline. In this case, the upside target points towards the 2.0539. A stop loss can be placed either below the neckline after retest, or more conservatively below the second bottom.
The one-hour double bottom can be reliable too, but its reliability is more dependent on volatility, unexpected events, and overall market conditions. For now, if the neckline holds on a retest, and shows good rejection, there's a high probability price will be pushing higher.

$SOL / $BTC 50WMA Reclaimed - Alt Season Confirmed!Ladies and Gentlemen,
CRYPTOCAP:SOL / CRYPTOCAP:BTC has officially closed the Week above the 50WMA and is back within the POI.
Double bottom confirmed this setup.
Along with the longest cup and handle I’ve ever seen lol.
Let the rotation for Alt Season begin!

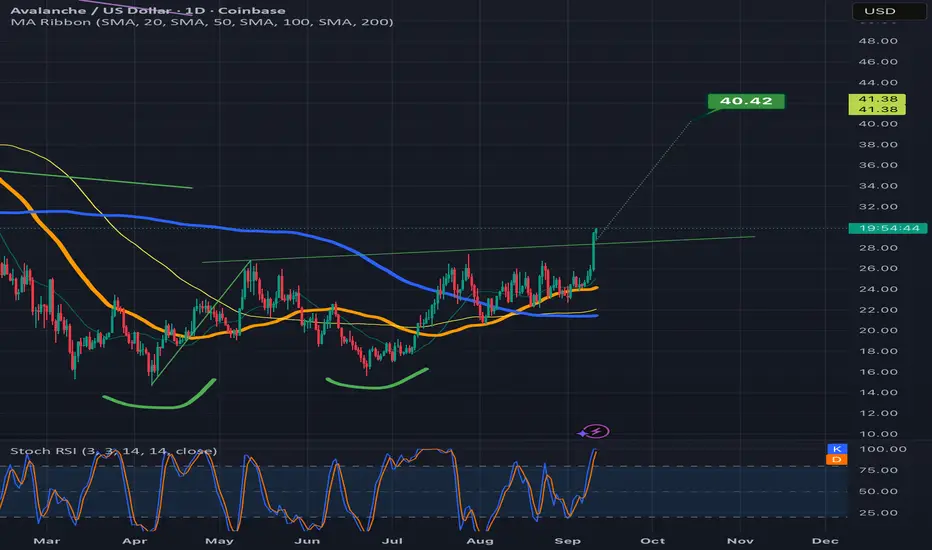
Avalanche with a close above the double bottom necklineNot sure whether it will validate the breakout here or go back below the neckline, but that was a very convincing bullish candle close above the neckline on the previous daily candle so it should give it some reasonable probability. *not financial advice*
DAX40 Quick Trade Double Bottom Buy ChanceDouble bottom on the 1 hour candle chart and inverted head and shoulder on the line chart.
Good luck
Markets Titan

ADA Double BottomADA gets a double bottom signal from early April to mid June. The chart momentum broke the neckline twice, confirming the double bottom signal, promising a break to the upside. (LONG) I'm hoping for a break at $1.01.
