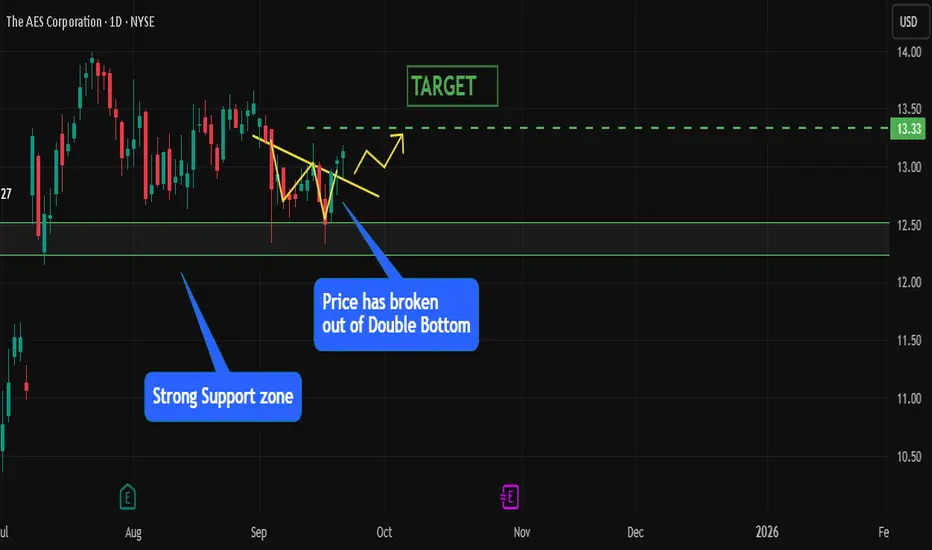
AES Springs Out of Double BottomAES has been showing a constructive setup on the charts, and the latest move looks like a clear signal from the bulls. Recently, the stock broke out of a Double Bottom pattern , which is widely considered a bullish reversal structure. This pattern often marks the end of a downtrend and the start of a potential uptrend, especially when supported by volume and clear support levels.
Adding to the strength of this breakout, AES took support from a strong support zone in the range of 12.24–12.5 . This area has acted as a solid base where buyers consistently stepped in, preventing further downside. The fact that the stock respected this zone before bouncing gives extra conviction that the downside is well protected in the near term.
Now, with the breakout confirmed and buyers back in control, the next logical upside level comes in at 13.33 . This acts as the immediate price target based on the pattern’s projection and prior resistance levels.
If AES continues to hold above the breakout area, momentum could carry it higher in the short term, attracting more participants who missed the initial move. On the flip side, a sustained break back below the 12.24 zone would weaken this bullish setup.
Overall, the technical confluence of a Double Bottom breakout , strong support zone confirmation , and a clear price target of 13.33 makes AES an attractive setup to watch in the coming sessions.
Double Top or Bottom
Walmart Breaks Out of Double Bottom — Bullish MomentumWalmart Inc. (NYSE:WMT) has confirmed a bullish breakout from a well-defined double bottom pattern , signaling a potential trend reversal from recent consolidation.
📈 What’s Happening:
After forming two distinct troughs near the same support zone, Walmart has broken above the neckline resistance , confirming the double bottom formation.
Price action now suggests that bulls have regained control, setting the stage for further upside momentum.
🧩 Interpretation:
This technical structure typically marks the end of a downtrend and the beginning of a new bullish leg . Sustained price action above the neckline would strengthen the bullish bias and open room for continuation toward the projected target zone.
Reversal from 30D SMA:
price has taken reversal from 30D SMA recently indicating more upward momentum for the stock
🎯 Target: 103.82

MSTR Looking at the marco charts, this looks like a classic wyckoff accumulation bottom. Typically at these zones, theres no confidence sentiment in hopes of the stock market to fully recover. Prehistoric data has shown these are the best times to start buying into the fear & uncertainty.
With bloody interest rates dropping, this might create an upwards short term inverse affect on assets before the whole house crashes

CAN USDCAD GO HIGHERAfter a recent accumulation and breakout of this box, we can see USCAD go higher of deep into the annual lows. This is a technical look from my perspective and not a signla

FET post liquidation double bottomAfter a brutal weekend, FET managed to recover and finish the week above the macro long treandline. This means the multi year bullish structure is still intact.
While doing this FET has also formed a double bottom on it's USDT pair, matching the price from the April 2025 low.
Technically this should be a very good sign for future price action. As long as the overall crypto bullmarket holds, FET should see some strong gains from this point on. The amount will depend on further news from the project and continuing interest in the AI-crypto sector.

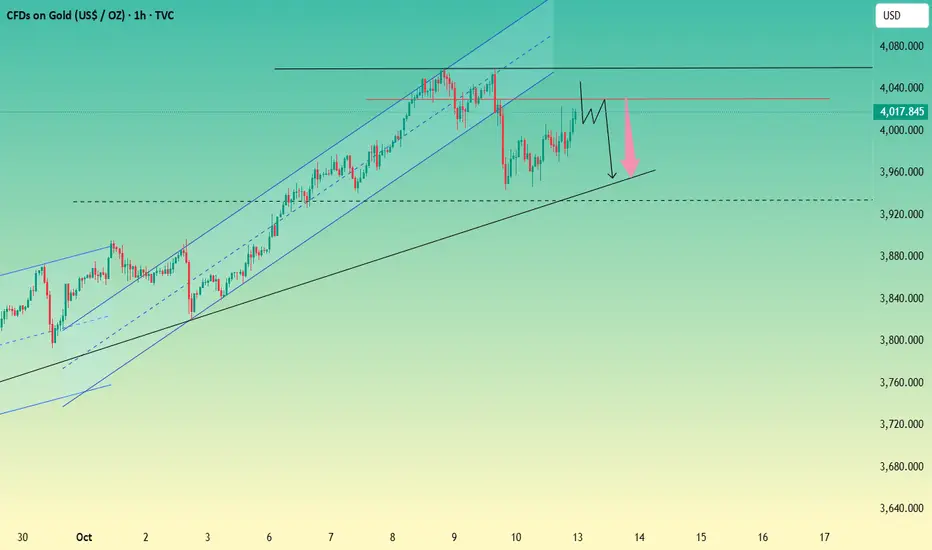
Going Short On Gold. (I might Be Crazy) Gold is currently sitting at an all time high, and overall sentiment remains extremely bullish. However, when you zoom into the 1 hour timeframe, you can clearly see some resistance forming at the 1st, 2nd, and 3rd touches, suggesting that price might be facing short term exhaustion.
It is also worth noting that liquidity has been taken from traders holding short (sell) positions, meaning the market may now be ready to reverse or pull back slightly.
On the 5 minute timeframe, a double bottom pattern has been formed, indicating potential for a deeper move. Based on this structure, price could head towards 3946 and possibly even further down.
I might be crazy 😅, but let’s see how it plays out.

XAUUSD 15M – Channeling Higher After Demand Reaction TVC:GOLD
Structure | Trend | Key Reaction Zones
Price tapped perfectly into the previous support zone, triggering a sharp bullish recovery.
The market is now moving inside a rising channel, showing healthy bullish correction.
Key focus remains around 4 020 – 4 058, where rejection or breakout will confirm the next phase.
Market Overview
Gold reacted sharply from the prior demand zone, forming a textbook W-reversal structure followed by clean channel continuation. Buyers are currently maintaining control as long as price holds above 3 985 – 3 962 levels. A breakout above 4 020 could extend momentum toward the rejection zone near 4 058, completing the full bullish leg.
Key Scenarios
✅ Bullish Case 🚀 → 🎯 Target 1 : 4 020 | 🎯 Target 2 : 4 058 | 🎯 Target 3 : 4 080
❌ Bearish Case 📉 → 🎯 Target 1 : 3 985 | 🎯 Target 2 : 3 926
Current Levels to Watch
Resistance 🔴 : 4 020 – 4 058
Support 🟢 : 3 962 – 3 926
⚠️ Disclaimer: For educational purposes only. Not financial advice.

GBPCHF - Waiting for Bearish Wedge to Resolve Strong Level of Support waiting to be broken.
Wait for re-test of level and enter on BE or Pin bar
Bearish activity - M pattern (Double top) combined with a neckline break
Buyside activity on October 1st completely taken out.
No historical level for downside target
Plan to short @ 1.07000 depending on price action (candlestick rejections)
Target = 1.05500
Stop Loss @ prev. daily high
can yield a 3:1 R/R, maybe more if momentum kicks in.

Trade idea on XausdHere is what I will be looking out this week :
Our bullish move continues on market open but I will be looking for some retest and bullish confirmations around these key levels:
-4001.459 - 4000.000,
-3991.062-3983.022
Else if the orders from Friday are still in(which obviously there is much demand on this safe heaven asset from last weeks panic liquidations), price might just continue from where it is @4012.500
fingers crossed let’s see what happens

Gold → Peak or correction? Market forecast for next weekLast Friday, we shorted gold at 3977 and 4000 points. Gold prices fell as low as 3946, and both of our short positions yielded profits. During the US trading session, gold prices rallied again, rising above 4000 points on the back of safe-haven sentiment.
Trade conflicts are volatile. Since Trump took office on January 20th of this year, the tariff issue has fluctuated between intense and easing. Now, the Sino-US tariff trade friction has escalated again, with Trump announcing an additional 100% tariff on Chinese goods effective November 1st. This was the main reason for last Friday's rebound.
The key lies in the Federal Reserve's October interest rate cut. While the probability of a 25 basis point cut is as high as 92.4%, the government shutdown has raised concerns that it may be delayed. Furthermore, the Fed minutes revealed that some officials, concerned about a rebound in inflation, oppose further rate cuts.
A brief ceasefire agreement between Israel and Hamas in the Middle East has eased geopolitical risks, raising concerns about boosting safe-haven demand. Gold prices have risen over 15% in the past two months. While a large number of profit-taking investors remain bullish on future gold prices, they are quick to flee at the slightest sign of trouble, especially during a rapid price drop.
Technically, after a relatively high daily and weekly close, there may be further upward momentum in the coming trading days. A new round of extreme gains followed by a sharp decline cannot be ruled out.
Resistance: 4030, 4058
Support: 4000, 3980
Trading Strategy:
Currently, the market is trading within the broad range of 3944-4058. The direction of the breakout will determine whether this is a correction or a peak. Shorting rallies within this range is the primary strategy. (Specific trading signals will be determined based on intraday trends.)
Next week, I will continue to share my personal trading signals. Wishing everyone gets what they hope for when the market opens tomorrow.
For specific trading decisions, please follow my live updates. I will update my trading ideas and strategies daily. If you don't have a plan or strategy for gold trading and are struggling to achieve consistent profits, you can refer to and follow my updates for guidance and help you avoid mistakes.
NUMIUSDT.P Short IdeaExpecting price to hit resistance at 0.0810, if a bearish reaction is confirmed there forming a potential double top then I expect to see drop to 0.0620. Follow for more ideas.

$BTC Double Top - Business Cycle & Global Liquidity Analysis TWIN PEAKS 🎄🌲
How the Business Cycle Supercharges Liquidity (and Crushes Cycles
Many of you may remember my BTC cycle thesis I wrote ~1.5 years ago. It was based solely on technical analysis covering previous cycles and did not take into account macro conditions such as global liquidity and the business cycle.
While that has been a guiding light to get me to this point, after further macro analysis, my views have changed a bit.
Based on my technical analysis, a price target north of $200k remains for CRYPTOCAP:BTC , but I now believe we will see some sort of a DOUBLE TOP like we did in 2021; this time in mid-December 2025 and late-March / early April 2026.
The December 2025 top will fulfill the “4-Year Cycle prophecy” which has been fueled by the current boom in global liquidity.
Whereas the March / April 2026 top will come from a booming business cycle (measured by the ISM PMI); something we have yet to see.
As you can see in the 2017 and 2021 cycles, the business cycle cues Alt Season.
I don’t think we see a real one without it.
That’s where people spend the money they made through safer assets such as Gold > Stonks > ₿itcoin etc.
We saw Altcoins, NFTs, Sports Cards, Sneakers, Watches, Collectibles etc go parabolic during this time in 2021. And it just so happened that the market for a lot of these high-risk assets topped around that time.
Here's a link to a Michael Jordan rookie card in PSA 9 condition that peaked around February 2021 right before the business cycle topped.
www.psacard.com
I think Altcoins went on for a bit longer after the business cycle topped because they were native on-chain and had less friction to transact (crime season anyone?).
NFTs saw sustained speculation because of the novelty and innovation they were bringing to the space. NFTs should act more like traditional risk assets this time around, and top slightly after the business cycle.
THE FURTHER WE ARE IN THE BUSINESS CYCLE, THE FASTER LIQUIDITY REACHES RISK ASSETS.
Think about it… everyone and their mother are making a ton of money from a booming business cycle ie hairdressers, uber drivers, personal trainers etc and dumb money finds high-risk assets near instantly. We see this with an uptick in google searches, youtube views etc.
This is why global liquidity with a 10-12 week lead overshoots cycle tops in the past.
An immense amount of Global QE in 2021 created an outlier for a continued pump in liquidity, even after the business cycle topped.
Then in the bear market, liquidity deviates from risk assets again as money moves back to safe havens first such as GOLD, which is a near 1:1 injection, and we see ₿itcoin lag by 10-12 weeks.
We should continue to see large caps do well for the remainder of the year as money slowly rotates out of BTC into ETH, SOL, BNB etc, but small caps don’t start to outperform until the business cycle starts convincingly rising well above 50.
Alternative investments such as sports cards are starting to see a similar rotation. Michael Jordan is the ₿itcoin of sports cards, and many of his cards are well above 2021 all-time highs. Other high-end cards from GOATs such as Tom Brady, Mickey Mantle, Wayne Gretzky etc continue to shatter prior records.
NFTs are also starting to see a resurgence with high-end collections such as Crypto Punks, X-Copy etc.
I’m not completely sure if the first or second top will be higher for CRYPTOCAP:BTC yet, but I’m leaning towards the first one in December.
The aforementioned riskier assets should get the lion’s share of business cycle capital in March / April.
At this nexus we will see the Treasury General Account refill suck liquidity out of markets due to tax season. TGA refills have marked previous tops in 2017 and 2021, so I see no reason for this time to be different.
Yes, this will be a much shorter business cycle, which is caused by a historic amount of money printing during the pandemic. The outcome left the US economy in a high-inflation / high-interest rate environment.
The business cycle represents Main Street, and it is clear that the aftermath of the pandemic has crushed middle and lower income households.
~FIN~
JK
POST REFERENCES:
-The 4-Year Boom and Bust Cycle is by design
-Synchronized Bear Market Bottoms
-If you want to dive deeper into the current macro landscape, you should definitely read the playbook I wrote ~10 months ago. It’s been playing out near-perfectly.

My bullish positionYou saw what happened at the beginning of Q4 how indices fell then Trump announced a cooling pressure but an ice meltdown to the dollar so
All indices will go long till next year, bye dollar shorts, welcome zzzusd longs contiunation. Hedge funds already bought till last year now they just adding on dips
📈📉📊📈📉📊🗂️📂

SOL; Trend Breakout.Hello Traders..
Lets take a look at SOLUSDT..it reveals to have been moving on a circle momentum of Uptrend for this couple of days, which after failing to hold and detain into this region. The price fell and broke the higher lows zone there by triggering it to go below the down division area.
We are considering a target at sections of $155-$125 as the next potential support.
Thanks for reading

NAS100USD 1M – Tariff Shock After Record HighsThe NAS100 reached a new all-time high earlier this month, extending its recovery from the April 2025 low. However, October has turned into a sharp selloff after Trump’s announcement of a 100% tariff on China starting November 1st, triggering heavy liquidation and breaking multiple support levels. The key focus now is whether the 23,367.28 zone will hold as support or open the way for deeper downside.
Support at: 23,367.28 / 21,800.00 / 16,400.00 / 10,700.00 🔽
Resistance at: 25,249.79 🔼
🔎 Bias:
🔼 Bullish: A monthly close back above 25,249.79 would suggest renewed strength, keeping the long-term uptrend intact.
🔽 Bearish: Failure to hold 23,367.28 confirms October’s selloff continuation, exposing 21,800.00 as the next key downside target.
📛 Disclaimer: This is not financial advice. Trade at your own risk.

EURUSD 4H – Testing Major Holding Zone FX:EURUSD
Price has followed a clean descending channel, rejecting from the top resistance zone.
Current candles are reacting inside the yellow holding zone, which aligns with previous accumulation structure.
A potential W-formation could build here if bulls defend this level — otherwise, the next demand layer waits lower.
Market Overview
EURUSD has reached a critical zone after an extended bearish leg. Liquidity beneath equal lows has been swept, suggesting smart-money absorption before a possible reversal. If the market holds above the 1.15 region, buyers could step in for a corrective rally toward mid-channel levels. However, if the zone fails, price may dip toward the deeper support box before a larger bullish correction begins.
Key Scenarios
✅ Bullish Case 🚀 → 🎯 Target 1: 1.1620 | 🎯 Target 2: 1.1720 | 🎯 Target 3: 1.1860
❌ Bearish Case 📉 → 🎯 Target 1: 1.1490 | 🎯 Target 2: 1.1420 (deeper support zone)
Current Levels to Watch
Resistance 🔴: 1.1620 – 1.1720
Support 🟢: 1.1500 – 1.1420
⚠️ Disclaimer: This analysis is for educational purposes only. It is not financial advice.

VNOM LongLong term uptrend - Energy play
Holding 2014 high price of $36.
Double bottom at this level.
Confirmation low is consolidating.
Sellers unable to push price below it for now.
Dragon pattern, breakout of the spine.
Fib level targets
TP1 - 0.618
TP2 - 0.786
TP3 - 1.272
Exit if stop is reached.

GBPUSD short continuing the momentum downwards.
price created a double top reversal pattern.
on the selloff
price may reject at the level stated, but also if it breaks that flag we could go all the way down to the next level.

Gold Tests 4000 Again After Double Top SelloffGold formed a double top and reached the 3,940 formation target during yesterday’s selloff. It is now testing the 4,000 level from below. If this level holds, a slightly negative outlook for the next couple of days will be the base case, with gold moving closer to the main trendline. The trend currently sits around 3,885 and is rising.
If gold manages to recapture 4,000 on a sustained basis, upward pressure toward 4,060 may continue. Traders should beware of possible traps around the 4,000 level.

GOLD (XAU/USD): Bullish Wave ContinuesI believe that the price of 📈GOLD is likely to continue rising.
I have spotted another bullish pattern today.
We have a confirmed breakout above the neckline of a double bottom.
It appears that the market will likely experience a bullish trend and reach the 4040 level in the near future.

GOLD:head and shoulder breakdown Gold is moving aggressively in last month
It crosses over round number 4000
It could not sustain and formed a M pattern or double top pattern above round level 4000 in smaller timeframe. Collapsed below 4000 yesterday
Now it is treding near the head and shoulder neckline near 3945
Any break of this level could slip the gold price by 100 dollers @3850 zone
Beawar of dynamic support ema 21 around 3860
SL and target mentioned in the chart.
A 1:8 RR
Trade with psychology and monoy management
Educational purpose only

Going Long On Gold Gold is overall bullish in the long run. However, today we have witnessed a strong bearish move that dropped all the way to a key support level on the 1 hour timeframe. This move has had a significant impact on the structure of the market at that level.
Now, on the lower timeframe, specifically the 5 minute chart, all short term support levels have been mitigated. Price has formed a clear double bottom pattern, suggesting a potential reversal. This indicates that after the liquidity sweep, the market is now preparing for a strong bullish move back toward the previously broken support level, which may now act as resistanc

Litecoin - LTC HUGE Upside Likely MID TERM (6 months)Litecoin has always been one of the giants of crypto, although it's growing slower than before.
This is likely due to all the innovation in the market, newer alts with better offerings etc.
However - LTC can, and will still be traded or many years to come. This is just because whales will trade almost ANY coin. (and if they can trade XRP to a new all time high, they can and will trade LTC ).
Every few odd months, LTC trades up+50% and above. This is every 5-7 months, or at least annually. And after the bullish W Bottom in the WEEKLY - I have high hopes for LTC.
________________
BINANCE:LTCUSDT
