XAUUSD Short: Rejection From Supply Targets $4,070 Demand LineHello traders! Gold (XAUUSD) is showing signs of a potential corrective move after a strong bullish rally from the $3,950–$3,970 Demand Zone, where multiple fake breakouts confirmed the presence of strong buyers. This area coincides with the ascending Demand Line, which has provided consistent support for price growth. Each touch on this line has led to notable bullish impulses, signaling accumulation and strengthening buyer momentum.
Currently, the price approached the $4,140–$4,160 Supply Zone, which aligns with both a Supply Line and the neckline of a previous Double Top pattern. This confluence area represents a critical resistance zone where sellers have historically regained control. The current rejection from this level suggests that a short-term pullback could be underway as the market seeks to retest lower support.
I expect the first key area to watch is the $4,070 pivot level, which aligns with the Demand Line. This zone is expected to act as dynamic support for a potential rebound. If price holds above this level, the bullish structure remains valid, with a possible retest of the $4,150–$4,160 Supply Zone. However, a confirmed break below $4,070 could trigger a deeper correction toward the $3,950 Demand Zone, where fresh buying opportunities may emerge. Manage your risk!
Double Top or Bottom

Ethereum#ETH 1H chart is showing signs of a Double Bottom forming a potential reversal structure.
If the neckline breaks and price holds above the 1h FVG zone, next target aligns with the 4h FVG area around +$3.8k.
Structure looks clean smart money might already be positioning.
Thank me later for this setup.
#Ethereum #Crypto #YodaXCalls

AUROPHARMA MOVE from gapAUROPHARMA, how gap works and enter in stock. this is recent exp. learn and earn

Bitcoin Falling Wedge Signals Breakout or Breakdown ZoneBitcoin is trading inside a falling wedge, a pattern that traditionally leans bullish when the breakout occurs.
At the same time, the price is approaching a historically sensitive region — the 112,000 USD zone, which is acting as the potential Point A (left shoulder zone).
If Bitcoin rejects from 112k–113k, this level may complete the left side of a developing head and shoulder formation, especially if the market loses its neckline later.
Important Supports to Watch
$97,000 → The most crucial support on the daily.
$97,500–$98,000 → Double-bottom demand zone.
$92,000 → The next major support & unfilled gap region.
A clean break below 97k will flip the entire market structure bearish and likely trigger a rapid decline toward 92k, confirming the neckline breakdown of a head and shoulder setup.
Bullish Scenario
If BTC forms a double bottom around 97.5k–98k, or if it sweeps liquidity and reclaims the level:
The falling wedge can break upward.
A push toward 112k becomes highly probable next week.
A breakout above 113k invalidates the bearish reversal and opens the way for continuation to higher levels.
This scenario requires a successful retest of the falling wedge breakout and strong volume.If BTC gets rejected at 112k–113k, and later breaks down below 98k, the chart will complete:
A textbook head and shoulder
A lost wedge structure
Momentum shift from bullish to bearish
This breakdown can trigger a high-velocity dump into the 92k gap zone.What Traders Should Focus On
112k–113k → Critical rejection zone to confirm the left shoulder.
97k–98k → Most important support and possible double-bottom area.
92k → Final downside target if BTC loses the neckline.
Watch for liquidity sweeps and volume strength to validate direction.Final View
Bitcoin is entering a decision phase.
The chart is offering both bullish wedge breakout potential and bearish head and shoulder risk, depending on how price reacts at 112k and 97k.
This is a position where traders should stay alert and wait for clean confirmation from either the breakout or the breakdown before placing major trades.

Momentum exhaustedThe price can no longer hold above the blue trendline that has supported the recent upward move.
A double top formation is also present, with a neckline at $324 and a bearish target around $260, where the daily SMA200 (blue line) passes.
Just below the neckline, there is a large gap down to $308, highlighted in orange.
It’s best to wait for a confirmed close below the neckline for greater safety

BTCUSDT.P : positionHello friends
Given the decline we had, the price has now made a good floor and is supported, but it is still early for confirmation. We must let the resistance break and form a higher ceiling for us.
Everything is clear and transparent. If you have any questions, ask.
Don't forget risk and capital management.
*Trade safely with us*

USDCHF Long trade IdeaTrend: Bearish
Divergence: Bullish
Reversal Pattern: Double Bottom
Bias: Bullish
Scenario: Entry at LH Breakout
Trade Plan
Stop Loss 0.7983
Entry Level 0.802
TP 0.8057

NZDUSD idea 12.11.2025For nzdusd I have the following scenario: sfp above the nearest high for a short at a price around 0.581 where the daily level and fibo 0.5 are nearby. for a possible long, I would like sfp below the low because it would mean a drop to the level of 0.552 where, among other things, the monthly level is also located, which will be essential.

XAGUSD idea 11.11.2025I'm primarily looking at two scenarios here: a short could potentially be at sfp above high at a price of around 53.1 and a short that I would like is sfp below low at a price of around 46.7

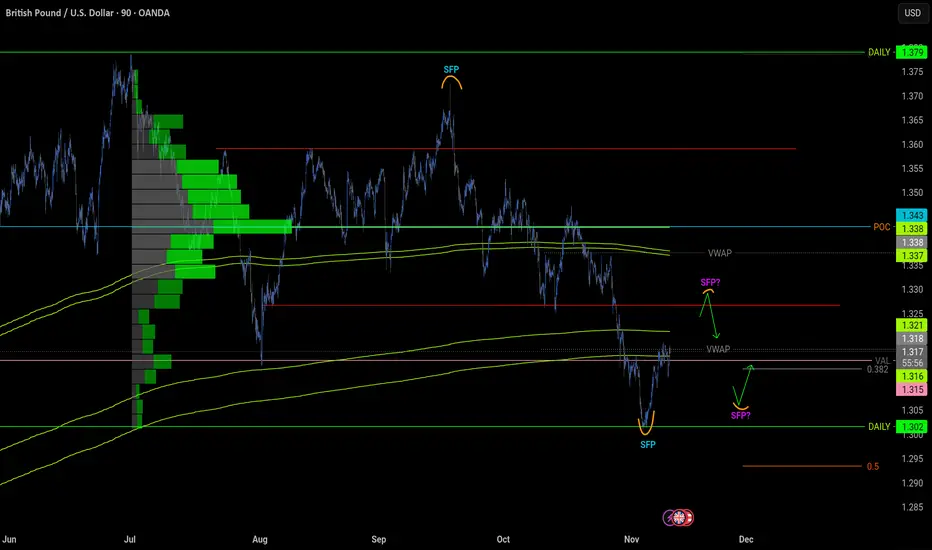
GBPUSD idea 11.11.2025On this chart I am currently looking for a short from around 1.32 where the price could react. I would first take a long around 1.307 where the SFP could be below the local bottom, but I don't know if it will hold and we don't look at another level below.
USDCAD - Bullish Continuation Using Multiple Forms of DivergenceHere on the USDCAD we have a bullish continuation trade which represents a perfect example of how countertrend & trend continuation trading can be used together.
Following a violation of our most recent level of structure price has given us a pullback and a double bottom which I used for my reason for entry into the trade.
Other forms of confluence come from psychological numbers, Fibonacci levels & both hidden and regular divergence on the RSI.
If you have any questions or comments please leave them below.
Akil

SHORT ON EUR/JPYEJ has formed bearish divergence at a major supply area.
I will be selling EJ to the previous swing low looking to make 150-200 pips

My XAU USD idea for this trding sessionIn htis video i took a look at what price action is taking place and where I think probabilistically, price might go next for the next bullish run.

AUDUSD: Bullish Move From Support 🇦🇺🇺🇸
AUDUSD will likely bounce from a key intraday/daily support.
A double bottom pattern on that provides a reliable confirmation.
Expect a rise at least to 0.6535
❤️Please, support my work with like, thank you!❤️
I am part of Trade Nation's Influencer program and receive a monthly fee for using their TradingView charts in my analysis.

EURUSD Long: Bullish Correction Toward 1.16100 ResistanceHello traders! EURUSD is showing signs of recovery after an extended period of bearish movement inside a descending channel, where sellers controlled the market structure. After several failed attempts to break above the upper boundary, the price has formed a Pivot Point near the Demand Zone around 1.15300, a level where buyers have previously shown strong reaction.
Currently, a rising Demand Line now supports the bullish correction, helping price break out of the descending channel to the upside. The pair is currently moving toward the Supply Zone located at 1.15900–1.16100, which aligns with a key resistance level that previously triggered reversals.For now, the 1.15300 area remains the critical support for buyers.
I expect, holding above this level may allow EURUSD to continue pushing toward the 1.16100 resistance. However, any bearish rejection pattern in the 1.15900–1.16100 zone would signal a potential pullback toward the Demand Line or a retest of 1.15300. On the other hand, a confirmed break and close above 1.16100 would indicate a possible shift toward a medium-term bullish structure. Manage your risk!

NEW BREAKOUT - BITCOINHello traders,
The Bitcoin price has formed a double bottom pattern, and the neckline has been broken!
This confirms a potential bullish reversal — momentum is shifting upward 🚀
🎯 Target: 107,000

GBPJPY: Bearish Move From Resistance 🇬🇧🇯🇵
There is a high probability that GBPJPY will retrace
from the underlined resistance.
A double top pattern on that and a formation of a bearish imbalance
provide a strong signal.
Goal - 202.7
❤️Please, support my work with like, thank you!❤️
I am part of Trade Nation's Influencer program and receive a monthly fee for using their TradingView charts in my analysis.

FORTIS is on gap FORTIS is on gap and today earning day . i am looking a pattern on smaller time frame to enter

GAP and Double Doji SolarINdusTalked about gap an double doji , should watch at least two time and learn

S&P 500 Extreme Breadth Reading! Caution!Why It Matters
Strong breadth = healthy rally, broad participation → more sustainable trend.
Weak breadth = top-heavy rally, fragile momentum → prone to correction.
Think of it like an airplane:
If all four engines (hundreds of stocks) are pushing, you can climb easily.
If one engine (a few mega-caps) is doing all the work, you can stay aloft — but not for long!
CAUTION! is in order!
Click boost, follow, comment nicely for more authentic, no BS, raw analysis. Let's get to 6,000 followers. ))

UK100 DOUBLE TOPHey awesome traders! Hope you’re snagging pips. FTSE just printed a clean Double Top—first peak near 9,790, second swing failed beneath it, and price is hovering under the short EL ~9,739.7. This puts sellers in control if we confirm below the neckline.
Key Levels
Peaks: 9,788–9,790
Short EL: 9,739.7
Mid level: 9,679.8 (0.5)
Neckline / Trendline break: 9,571.2
200-SMA: 9,488.3
Measured move T1: ~9,355.7
Trading Plan
Aggressive short: Fade the second top / EL 9,739–9,745 on bearish rejection (engulfing/pin).
Stop: above 9,795 (beyond tops).
TPs: 9,680 → 9,571 → 9,488 → 9,355.
Conservative short (confirmation): Wait for a 4H close below 9,571, then sell the retest as resistance.
Invalidation: sustained reclaim back above 9,571, or especially above 9,740–9,790.

Double top after ascending triangle: 163$ will be retestedDouble top occurred at COINBASE:BTCUSD and at $COINBASE:SOLUSD. 163$ will be retested. I think we will see a bounce from there.

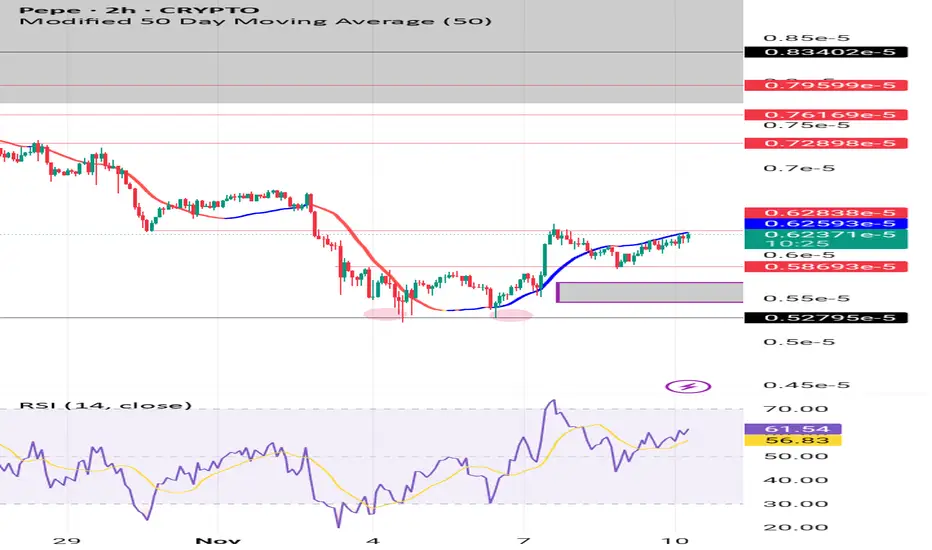
PEPE/USD (2 hour chart Analysis)🟢 PEPE/USD (2-Hour Chart Analysis)
PEPE is currently trading around $0.00000620, sitting slightly below its 50-period moving average, which shows that the short-term trend is still under pressure. The RSI on the 2-hour chart is hovering below 50 — meaning momentum remains weak, but not oversold enough to confirm exhaustion. Price has formed a shallow base near the $0.00000590-$0.00000600 zone, an area that also aligns with a small fair value gap (FVG), suggesting it could act as short-term support if buyers step back in. This area will likely determine whether the next move is a bounce or another slide.
My bias is mildly bullish, but only if confirmation steps in. If PEPE breaks above the 50-period MA with convincing volume, it could trigger a short-term upside move toward $0.00000640-$0.00000650. However, if the price fails to reclaim that moving average and loses support near $0.00000590, a deeper correction could follow. The best move here is patience — let the market show its hand before reacting. As always, PEPE is a high-volatility meme token, so manage risk wisely and never trade with emotions.