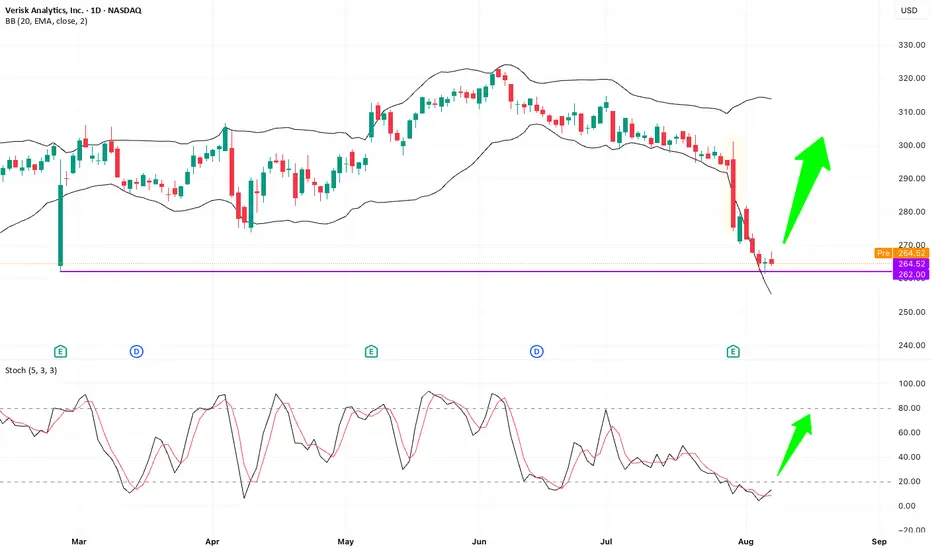
VRSK – Bullish Pin Bar at Key Support after Earnings Flush?NASDAQ: VRSK delivered good quarterly results, yet price action showed a sharp flush-down bar breaking below the lower Bollinger Band. Recently, price retested the key previous low level at $262, triggered some small stop-losses, and closed back at $262 with a bullish small pin bar. Double bottom setup on VRSK.
Key factors supporting this level:
1. Flush-down move likely to stop out weak holders.
2. Break below lower Bollinger Band, indicating short-term oversold condition.
3. Stochastic oversold and attempting a bullish cross.
4. Bullish pin bar closing back above support.
Double Top or Bottom
NZDCAD - Bearish Price Action, Bearish confluencesNZDCAD has been shaping up to see a bearish move as we can see the price correctively retested a double top level which had corrective movement indicating sellers are present and we can see the next push downward.
Good Luck

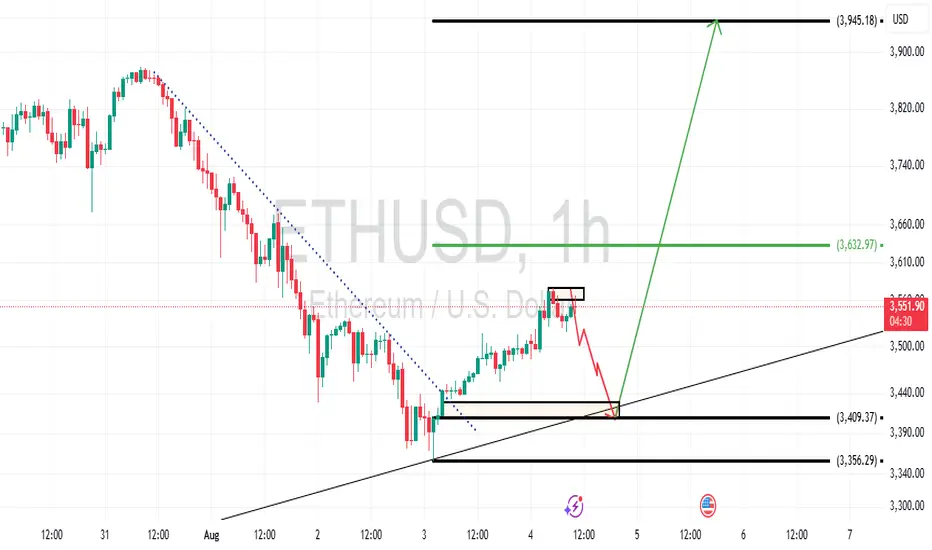
Eth/Usd Possible pathEthereum declared a possible bullish move that pends a retest. Depending on the momentum of the market, the market is likely to retest today or tomorrow in order to keep the week bullish.
LINK : You want the link for the pump?Hello friends🙌
✅considering the recent market decline, the LINK market has also fallen like other currencies, and many of you are afraid that this is the end and the rise is over or is there still a rise?
✅Well, as we have indicated on the chart, after the price fell to the support area marked with Fibonacci, a double bottom pattern was formed and then the price was increased by buyers.
✅In this wave, we drew another Fibonacci and identified the area where the price pulled back, and we believe this currency has good potential for growth.
✅Now you can buy in steps in the specified areas with capital and risk management and move to the specified targets.
🔥Follow us for more signals🔥
*Trade safely with us*

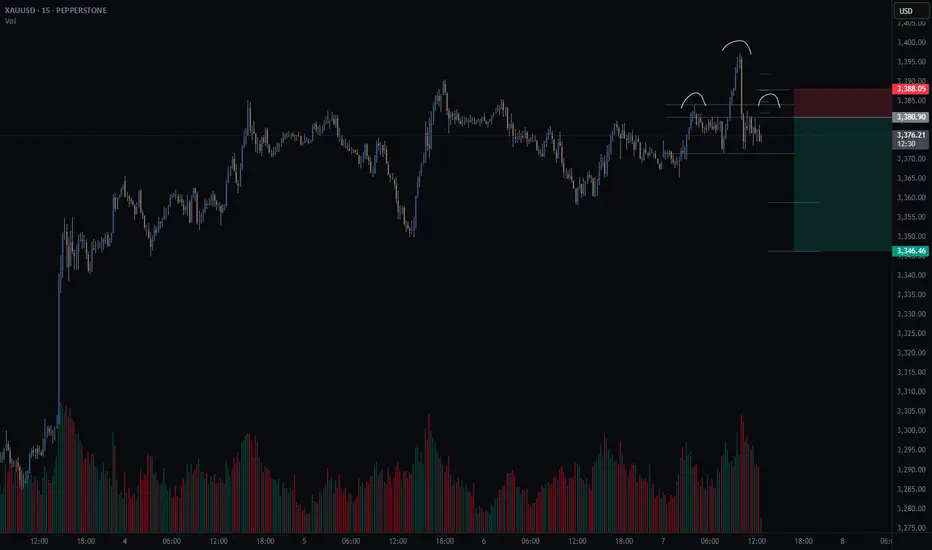
Gold short – Head and Shoulders Setting Up on 15min?There’s a potential head and shoulders pattern forming on the 15-minute chart.
📌 What I’m watching for:
A 15min candle close back inside the neckline range
Lower volume on the right shoulder vs. the left (to confirm weakening momentum)
🧠 Trade Idea (Short bias)
🎯 Entry: 3380.9
❌ Stop Loss: 3388.0
✅ Take Profit 1 (50%): 3358.9
✅ Take Profit 2 (50%): 3346.3
⚖️ Risk/Reward: 3.8R
This setup lines up with my trading method that focuses on structure, volume, and clean risk/reward.
🤔 What are your thoughts on gold today?
Are we about to roll over — or will bulls push through resistance?
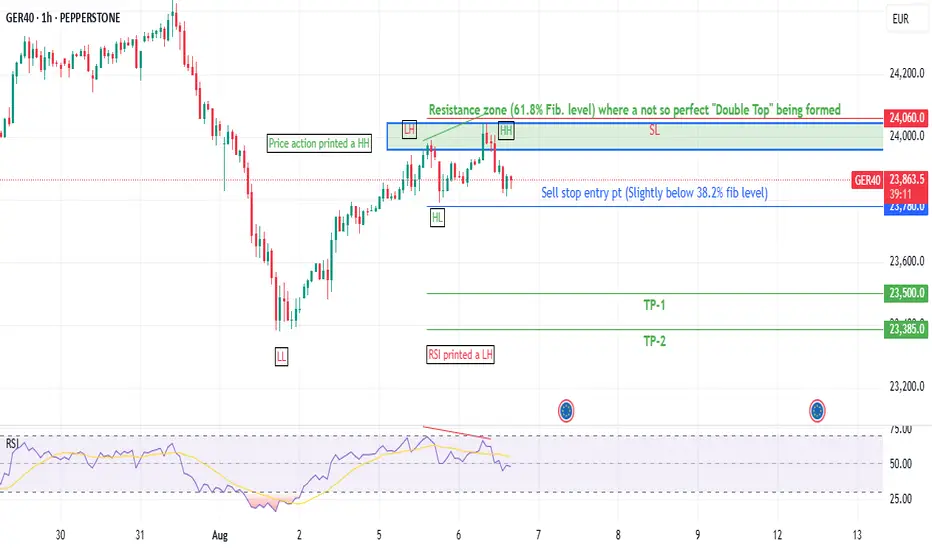
Potential GER40 (DAX) Short SetupHey everyone,
Just wanted to share my personal analysis and the trade plan I've put together for the GER40 on the 1-hour chart. I'm still learning, so a big part of my process is documenting my ideas to see how they play out. I would be grateful for any thoughts or feedback you might have.
What I'm Seeing on the Chart:
A Potential Double Top: I've spotted what appears to be a double top pattern forming up near the €24,000 - €24,060 area. To me, it looks like the recent rally might be showing signs of exhaustion here.
Bearish Divergence: What makes this setup more interesting to me is the bearish divergence on the RSI. Even though the price pushed to a slightly higher high, the RSI indicator made a lower high. My understanding is that this can suggest fading buying momentum.
Fibonacci Level: I also noticed that this rejection seems to be happening right around the key 61.8% Fibonacci retracement level from the last major down-move. When a few different signs seem to line up like this, I tend to pay closer attention.
My Personal Trade Plan:
My game plan is to be patient and only consider an entry if the price breaks below the recent lows, which would help confirm the bearish idea for me.
Entry (Sell Stop): $23,780
Stop Loss: $24,060 (I'll place this above the recent high, as a move above here would suggest my bearish idea is likely wrong).
Take Profit 1: $23,500
Take Profit 2: $23,385
Important: Please remember, I'm a humble trader from Pakistan still on my learning journey. This is simply me sharing my trade journal and thoughts, and it is not financial advice. Please always do your own analysis. Stay safe out there!
#GER40 #DAX #TechnicalAnalysis #Short #TradingJournal #LearningToTrade #Tradingidea #Sarmaaya
BTCUSD Bearish Correction and retest of W formationPossible correction to the downside following a breakot out of a Double Bottom pattern on H1

SHORT ON SPX/USDSpy has created a Double top followed by a CHOC and retest to the downside.
Their is plenty sell side liquidity to be collected as I expect a major drop on spy.
Looking to catch 300-400 points on SPY.

EURCHF: Intraday Bearish Move?! 🇪🇺🇨🇭
EURCHF reached a key horizontal resistance level.
I think that there is a high probability that the price
will retrace from that.
The closest intraday support is 0.93825,
it will be the goal for the sellers.
❤️Please, support my work with like, thank you!❤️
I am part of Trade Nation's Influencer program and receive a monthly fee for using their TradingView charts in my analysis.

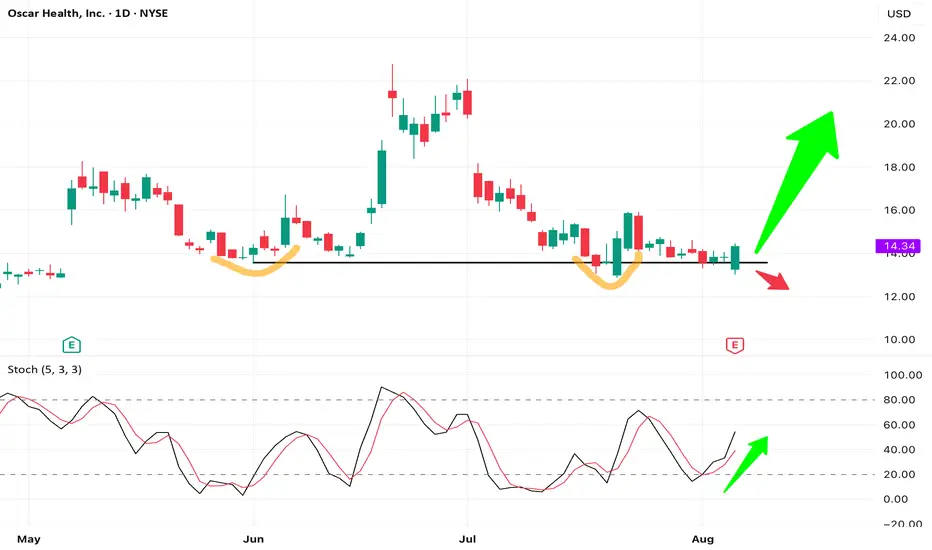
OSCR forming a Double Bottom – Bullish Reversal PotentialNYSE: OSCR - Oscar Health shows a potential double bottom, with a force bottom likely clearing stop-losses. Price has reclaimed key support, and stochastic is turning up, suggesting early bullish momentum.
Despite earnings missing estimates, the stock closed strong above support — a positive reaction to bad news. Risk and reward looks favorable at current levels.
8/6: Watch for a Potential Double Top FormationGood morning, everyone!
Yesterday, gold experienced its first significant supply pressure around the 3386 level, but with support near 3350—helped by positive data—prices rebounded and climbed back toward 3390, resulting in solid overall gains.
From the 1-day chart (1D) perspective, the technical structure remains bullish, with MA20 providing firm support. Although short-term moving averages are currently converging, the overall bias remains towards a bullish divergence, suggesting further upside potential. There's a possibility for price to test the 3400–3420 zone in today’s session.
That said, the 3386–3398 region may still pose minor selling pressure, although it is not expected to be particularly strong. Key intraday support is seen in the 3378/3372–3362 range. If the market encounters another wave of heavy selling that damages the daily bullish setup, then the 3343–3348 area will become a critical battleground between bulls and bears.
📌 Trading Strategy for Today:
Maintain a sell-on-strength approach, especially if prices approach the 3418–3438 resistance area, where short opportunities become more attractive;
If a pullback occurs, monitor the aforementioned support zones for potential buy-on-dip opportunities, contingent on stability.
⚠️ Market Risk Reminder:
There will be key economic speeches during the US session, which could trigger heightened volatility. Ensure proper risk management and stop-loss settings are in place.

CADCHFTriple Bottom with bulish Divergence .
Buy stop 0.59054
Stop Loss 0.57942
Take profit 0.60166
RRR 1:1

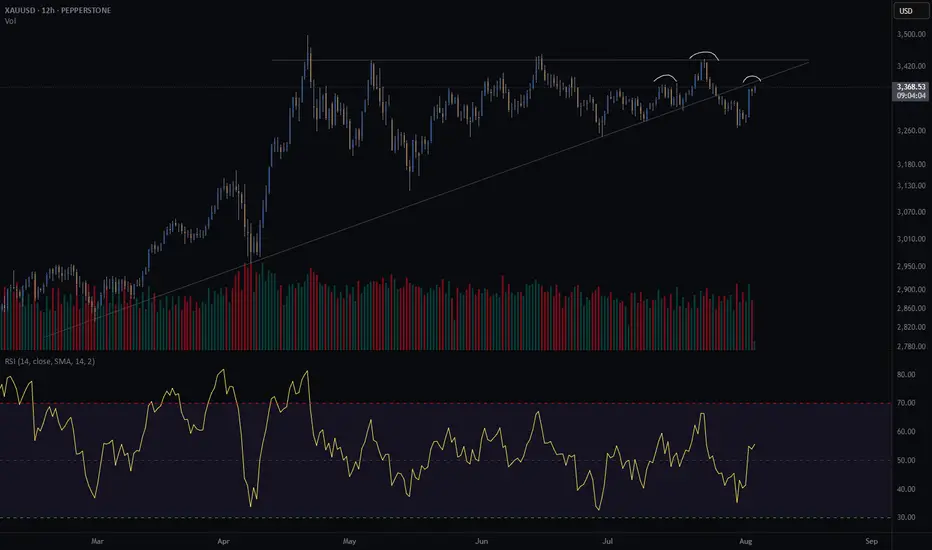
Gold crash (SHORT) - head and shouldersGold is at an interesting crossroad.
It broke through its diagonal support on Friday the 25th of July.
Price is retesting previous support. Does it turn into resistance?
Further confluence is a head and shoulders of the H8 and H12, with the right shoulder coinciding with the retest of the diagonal.
Since I am long gold with my investments, I am hesitant to short gold through my trading business. However, if my pattern is available, I take the trade. This will be a very short term trade - a few days at most if the trade goes in my favour.
Risk/reward = 12.6
Entry price = 3382.5
Stop loss price = 3396.2
Take profit level 1 (50%) = 3230
Take profit level 2 (50%) = 3181
The risk reward is exceptionally high. However, I have taken a more conservative approach with my entry because of my apprehension to short gold. For this trade I will enter at the extreme end of the range in which I will look for entries. This is the reason for such a high RR. It might result in me missing an entry.
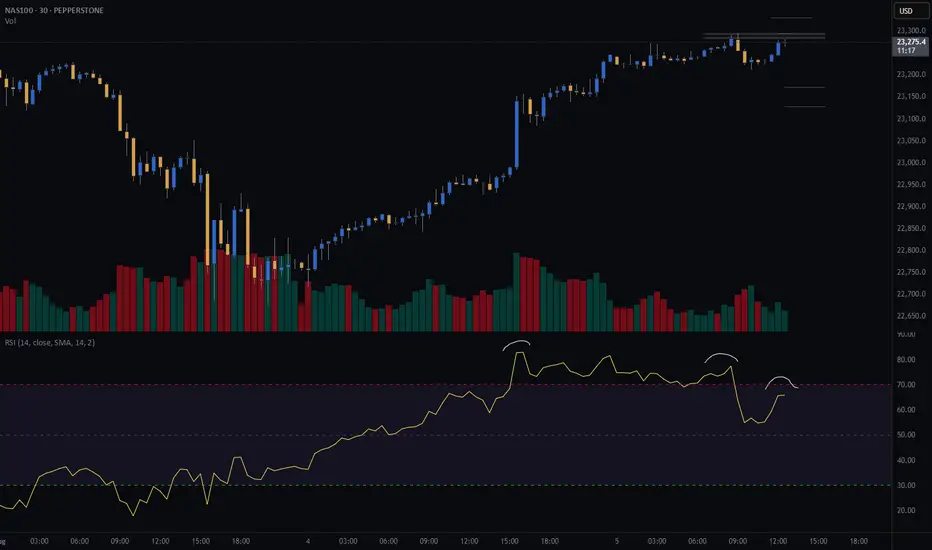
NAS100 (CASH100) Short - Double top 30minThe 15min head and shoulders setup got invalidated.
However, my double top variables are currently being met.
Still need confirmation before entering trade.
Risk/reward = 2.7
Entry price = 23 284
Stop loss price = 23 331
Take profit level 1 (50%) = 23 173
Take profit level 2 (50%) = 23 129
What does everyone thing the NASDAQ is going to do today?
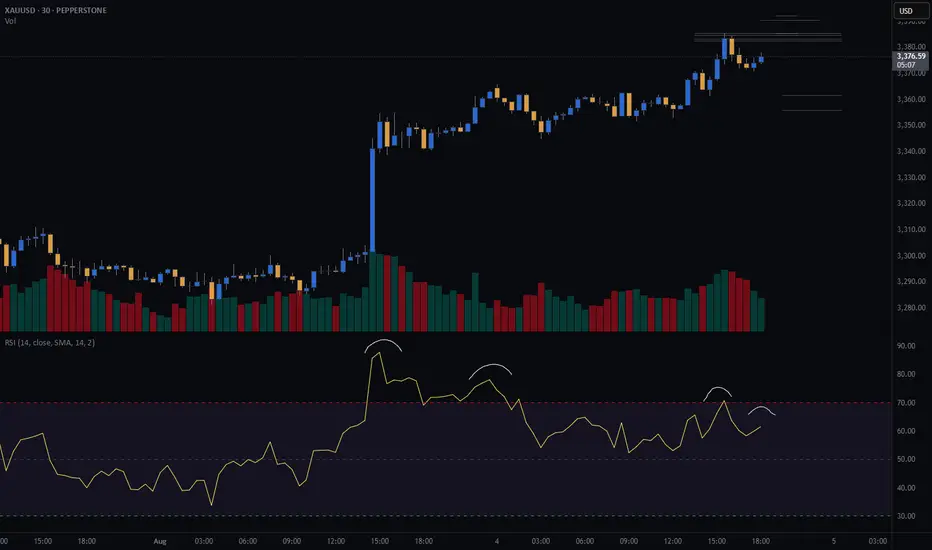
GOLD (XAU) SHORT - Double top 30minRisk/reward = 2.8
Entry price = 3382.5
Stop loss price = 3390.5
Take profit level 1 (50%) = 3361.7
Take profit level 2 (50%) = 3356
I am considering a short on gold.
Still need some variables to fall into place before I enter the trade.
There is nice RSI negative divergence showing declining momentum.
Further confluence:
- Potential head and shoulders on higher time frame
- At area of previous diagonal support which could be turned into resistance if the 30min double top plays out
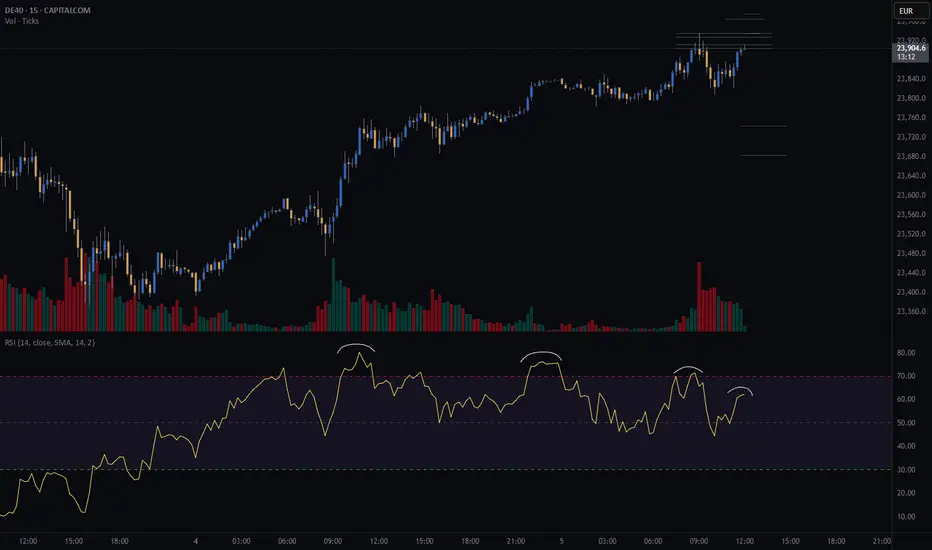
GER40 (DE40) SHORT - Double top 15minPotential short on GER40 with a double top on the 15min.
There is negative rsi divergence which is one of the indicators I use to look for double tops.
Still waiting on further confirmation before I take the trade.
Risk/reward = 3.2
Entry price = 23 905
Stop loss price = 23 965
Take profit level 1 (50%) = 23745
Take profit level 2 (50%) = 23684
What do you guys and girls think the GER40 is going to do from here?
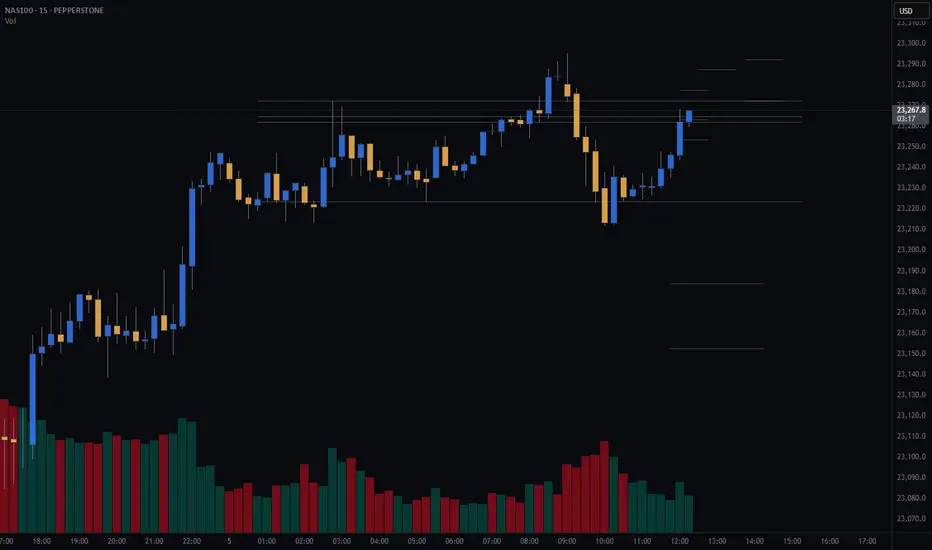
NASDAQ (CASH100) SHORT - head and shoulders 15minPotential short on nas100 (cash100) with head and shoulders on the 15min.
Still waiting for confirmation on some of my variables before I enter.
Risk/reward = 3.3
Entry price = 23 262
Stop loss price = 23 287.3
Take profit level 1 (50%) = 23 184
Take profit level 2 (50%) = 23 153
What do you guys and girls think the nasdaq is going to do?
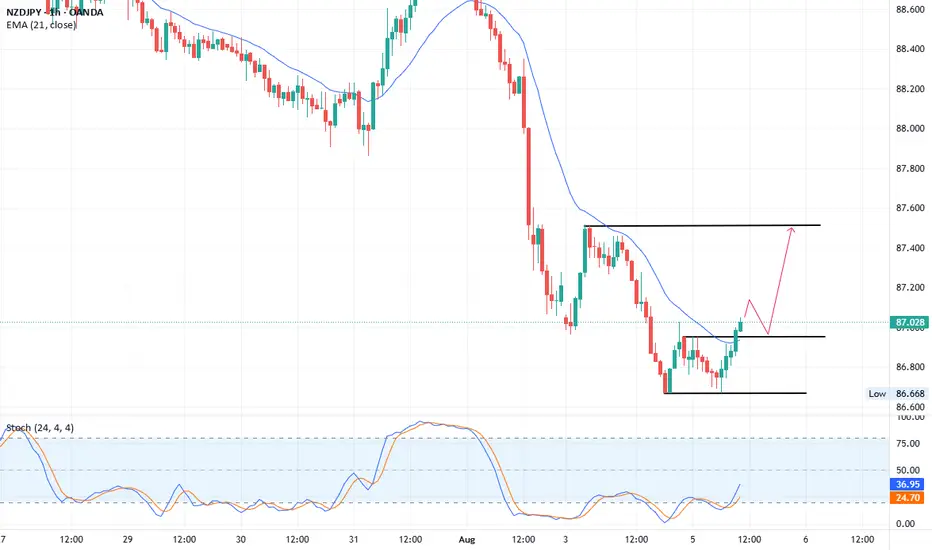
NZDJPY TradeNZDUSD hourly chart double bottom formation confirmed.
Buy above: 86.95
Stop Loss: 86.65
1st TP: 87.30
2nd TP: 87.50
If break 87.50 level then next target 88.00 and 88.30.
CADJPY: Bullish Move Confirmed?! 🇨🇦🇯🇵
CADJPY is going to bounce from a key daily support.
With a high probability, 107.28 level will be reached soon.
❤️Please, support my work with like, thank you!❤️

USDCAD Daily AnalysisUSDCAD has recently completed a clean 5-wave Elliott Wave decline, reaching a significant low at 1.3540 on June 16, 2025. This low marks the end of the bearish cycle, followed by an accumulation phase. During this phase, price formed a triple bottom pattern, confirming strong demand around the 1.3540–1.3560 zone.
The breakout above the neckline confirms this reversal pattern, and price is now retesting the previous resistance zone (1.3750–1.3770), which has turned into support.
The pair is also trading above the 21-period EMA, reinforcing the bullish momentum.
Elliott Wave & Structure Outlook
Elliott Wave count shows a completed 1–5 bearish wave, followed by a corrective bullish structure in progress.
Wave A of the corrective move has likely completed, and Wave B retracement is underway.
A continuation toward Wave C is expected, targeting the 1.4180–1.4300 resistance area, aligning with prior major supply zones.
Trade Plan
Buy Entry Zone: 1.3750 – 1.3700
Stop Loss: 1.3560 (below structure support and trendline)
Take Profit Targets:
🎯 TP1: 1.4000
🎯 TP2: 1.4180
🎯 TP3: 1.4300
USDCAD has shifted from a prolonged bearish trend into a bullish corrective phase. A successful retest of the breakout zone offers a high-probability long trade setup. Breakout and continuation toward 1.4180–1.4300 aligns with wave theory and technical resistance zones.

CHFJPY: Pullback Confirmed?! 🇨🇭🇯🇵
CHFJPY may pull back from a key daily support.
A formation of a bullish imbalance candle on an hourly time frame
with a bullish CHoCH provide a reliable confirmation.
Goal - 182.45
❤️Please, support my work with like, thank you!❤️
I am part of Trade Nation's Influencer program and receive a monthly fee for using their TradingView charts in my analysis.

ETH forming double topETH is forming a double top, nice confluence to what BTC is doing rn
Maybe that's the turnaround and its going back down for now.

8/5: Watch for Short Opportunities Near 3400Good morning, everyone!
On Wednesday, gold held above the key support area at 3343–3337, and subsequently broke through the 3372–3378 resistance zone, leading to a strong bullish move and solid long-side gains.
Today, attention should shift to the major resistance around 3400. If bullish momentum continues, price may approach the secondary resistance near 3420. However, from a technical perspective, signs of bearish divergence have begun to emerge. Should price continue rising while momentum weakens, the risk of a short-term correction increases accordingly.
Key levels to monitor:
Primary resistance zone: 3404–3416
Intermediate supply area: around 3398
Crucial support zone: 3372–3363 (a hold here could support further upside)
⚠️ Cautionary Note:
The US PMI data release during the New York session could introduce volatility. Be sure to maintain strict risk management and stop-loss discipline during periods of increased uncertainty.
🔁 Trading Bias for Today:
Prefer selling into strength near resistance, while cautiously considering buying on dips near support.
The 3343–3337 area continues to serve as the primary support zone, and price action around this level will be critical in determining the next directional move
