EUR AUD In trading range. Buying at the bottomRR 1:4
Risking 100 pips for 400 pips
adding the the winner if 100 pip profit is made, where I would move up the stop loss.
Double Top or Bottom


AUDUSD Retest of An Ascending Triangle.Price formed an ascending Triangle with rising higher lows and break of Resistance level at (0.65351 - 0.65204).
Price later retested Resistance of the Ascending Triangle and formed double bottom a bullish reversal pattern.

GBP/USD 4H Analysis Based on the W Formation on the H4 Timeframe, I'd be looking for GBPUSD to pullback before breaking the structure high.

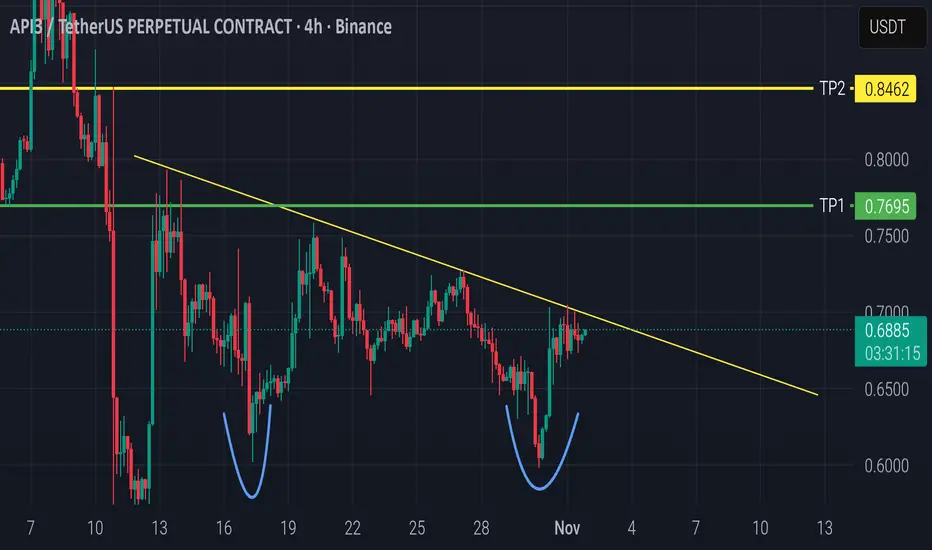
Possible Double Bottom Breakout FormingThe chart shows a clear Double Bottom pattern around the 0.60 zone, indicating a potential bullish reversal.
Price is now testing the descending trendline (neckline), and a confirmed 4H candle close above 0.69 with strong volume could trigger a breakout move.
🎯 Targets:
TP1: 0.7412
TP2: 0.8462
🛡️ Stop Loss: Below 0.67 or the previous low.
Volume is increasing, supporting the potential breakout — so entry can be considered now if volume keeps rising, or after a retest of the trendline for safer confirmation.
#API3USDT #Crypto #TradingView #TechnicalAnalysis #DoubleBottom #TrendlineBreakout
Double bottom with potential doubling!The price appears to have found a bottom at $23.2, and the high trading volume suggests growing interest from major investors.
The current pattern is a double bottom with a neckline at $35.6 (black line). A breakout above this level could target the resistance at $48.9 (blue line).
On Friday, the price was rejected by the daily SMA200. I believe it’s best to wait for a close above that level before starting to accumulate.

GBPNZD · 4HGBPNZD · 4H
Price has formed a Double Bottom at a key support level.
Now, price has pulled back for a retest of the neckline / zone, which could confirm bullish momentum.
🎯 Target: 2.30354
FOREXCOM:GBPNZD

STO/USDT (4H)A clear Double Bottom pattern is forming, and the rising volume confirms strong buying pressure — suggesting that a long entry can be taken now.
Price has broken above the neckline resistance around 0.169 – 0.170, showing potential for a bullish continuation.
🟢 Entry: Current levels (0.169 – 0.171)
🛡️ Stop Loss: Below 0.155
🎯 Targets:
TP1: 0.1835
TP2: 0.2000
The breakout with increasing volume supports the idea of a mid-term trend reversal.
#STO #USDT #CryptoAnalysis #DoubleBottom #TradingView #BullishSetup #Breakout #VolumeConfirmation

US30 Double topDouble top with multipal Divergence
Going for Short
Sell stop
47261.0
SL: 48101
TP: 46420
RRR 1:1

EURGBP Short ( Double Top)EURGBP Short ( Double Top) with Bearish Divergence on RSI
Trade Plan
EP:0.87734
SL:0.88253
TP:0.87209
RRR 1:1

Gold Technical Outlook: Breakout or Breakdown Ahead?Market Context
Gold recently hit fresh all-time highs near $4,400 in mid-October after dovish comments from the Federal Reserve, but has since paused as traders digest the news. The price is consolidating around the $4,000 area, with bulls and bears locked in a tug-of-war, creating a crucial juncture for gold’s short-term trend.
Technical Breakdown
• Trend:
Gold had been climbing steadily along a rising support trendline , but that line has now been broken . This signals that the recent uptrend may be on hold or reversing in the near term.
• Resistances:
The chart shows a classic double-top pattern , with peaks around 4,210–4,225 . After retesting this zone and failing, sellers took control. There’s also a minor resistance zone near 4,040 , which capped a recent bounce.
In short, bulls must reclaim 4,040 first, a breakout above this would open the path toward 4,210–4,225 .
• Support:
Key support lies near 3,914 . This level held strong during earlier pullbacks even after the trendline broke.
If gold retests 3,914 and holds, it could provide a solid base for buyers, but a decisive break below it would confirm downside continuation.
• RSI (Momentum):
The 14-period RSI is hovering near 50 , showing a neutral stance. We can observe both bearish divergence (as price formed a double top while RSI made a lower high) and bullish divergence (as RSI formed higher lows while price dipped).
This mix of signals means momentum is indecisive , traders should wait for confirmation.
What to Watch Next
1. Price Reaction at Key Levels
Watch how price reacts around 4,040 and 3,914 .
A break and hold above 4,040 could shift short-term momentum bullish, targeting 4,210–4,225 .
A rejection or breakdown below 3,914 could trigger further selling pressure.
2. RSI Confirmation
A sustained move of RSI above 50 supports bullish momentum, especially if price also rises.
Conversely, a drop below 45–40 would reinforce bearish sentiment.
If price breaks above the double top and RSI makes a higher high , bearish divergence is invalidated, confirming strength.
But if price breaks below support and RSI follows with new lows , the bullish divergence fails, favoring sellers.
Summary
Gold’s short-term trend depends on how it reacts at these key levels (4,040 and 3,914) .
The market is at a decision point, either breakout or breakdown.
Combining price structure with RSI confirmation can help traders stay aligned with the next impulsive move.
Analysis by @TraderRahulPal | More analysis & educational content on my profile.
Disclaimer: This analysis is for educational purposes only and should not be considered financial advice. Trade responsibly with proper risk management.

AUDNZD — 4H ChartAUDNZD — 4H Chart 📈
A Market Structure Shift (MSS) / Change of Character (CHoCH) has occurred at the BOS line.
However, to confirm a full structure change, I’ll wait for a breakout of the neckline of the Double Bottom pattern, followed by a pullback and price action confirmation.
Target: Nearest resistance zone
🎯 Goal 001 → 1.14091
OANDA:AUDNZD

CADJPY: Overbought Market & Pullback 🇨🇦🇯🇵
In my view, CADJPY turned too overbought and there is
a high chance that it will continue correction.
The closest support is 108.87
❤️Please, support my work with like, thank you!❤️

Buy Dax at supportRisking 100 points in DAX for a 250 points swing up over the weekend.Buying at support in what looks like a range bound market.
Ethereum confirmation of breakout, downside targetEthereum confirmed a breakout below the 4050–4100 zone, completing the double top pattern. The price stays under the 50 and 100 EMA, showing continued bearish pressure. Priority remains on short positions during pullbacks.
Nearest downside targets: 3463 (Target 1) and 3007 (Target 2). A move above 4100 would cancel the bearish scenario.
Amid expectations of the Fed’s rate decision and rising bond yields, risk assets remain under pressure. Inflows to crypto funds are declining, increasing the downside risks for ETH. In the short term, correction may continue until new bullish catalysts appear.
ETHUSD remains in a bearish setup. Downside targets — 3460 and 3000. Long positions should be considered only after a confirmed move above 4100.

ETHUSDT Sell Position smashed the TPAfter predicting a Sell on ETHUSDT on the 4hr timeframe due to a crazy 4hr Double Top pattern that formed on a bullish Trendline, I presumed that the Trendline would be no match for the HTF chart pattern and the rest was history. 1:2 Risk to Reward ratio achieved.

ETHUSDT: Price Aims For $4,200 ?- Here Is Why...Hi Teams,
Lets take a view on ETHUSDT. it have been scaling on a momentum range of support and resistance for this couple of days. presently the price is at the support zone, retracing slowly as seen in the chart formation.
Key points;
More clear confirmation above the support level would set off a bullish rise toward $4,200 as next partial target.
However a breakout below the support level would be triggering the price to downward movement.
Thanks for reading.

GOLD ; How far down?Hello friends
Well, after the good rise we had, the price needed a correction, which happened with a double top pattern.
Now the main question is, how far will the fall go?
Well, in the short term, the price can fall to the specified limits, and if the support areas are broken, the fall will continue, and on the other hand, an important resistance has been created, which the price needs to break for the new ATH.
With this decline, it is unlikely that the price will suffer for a while and correct because it has grown a lot and everything will end one day...
Support levels can be good points for buying, of course with capital and risk management.
*Trade safely with us*

DAILY RR 1:3 BUY GBPUSD Buying triple bottom / support in GBPUSD On the daily chart with a risk reward of 1:3.

MANKIND making double bottom MANKIND making double bottom after exit all long . let see where it will go

BTCUSD Breakout: Daily Neckline Close Targets 122,000–124,500Hello, traders—BTCUSD is coiling inside a broad 1D range after topping near 126,000. Buyers defended the demand zone at 104,000–108,000 and price has since pushed back toward a clear neckline around 116,000 formed by a developing double-bottom (lows from early September and mid-October). The structure is neutral-to-bullish, with momentum improving as price rebounds from the lower boundary.
Primary path: a daily close above 116,000 confirms the neckline break and opens room toward 122,000 first, then the 124,500–125,000 resistance where supply repeatedly capped rallies. If strength persists, watch for a break-and-hold above 125,000 to transition the range into continuation. Trade-wise, the cleaner confirmation is a daily close ≥116,000/116,500 with targets at 122,000 and 124,500 while using the prior breakout area to trail risk.
Alternative: a firm rejection at 116,000 would keep the range intact and invite a pullback toward 111,500. A decisive daily close below 111,500 puts 108,000 back in play; a loss of 108,000 risks a deeper sweep toward the 104,000 floor.
Invalidation for the bullish idea is a daily close back below 111,500 after breakout, or any decisive failure of 108,000 that negates the base. This is a study, not financial advice. Manage risk and invalidations

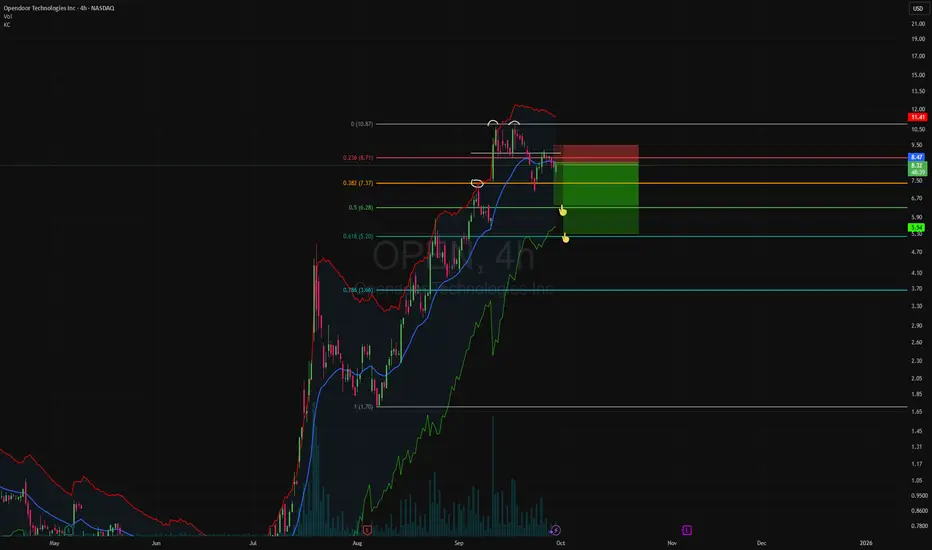
Simple short shortOpen interest for this stock looks funny 🤔
Sep. 17th: 4H Double top completely skipped any attempt at retesting reaching its technical target in 2 days. Medium time frame market structure broken after breaking the 0.382 fib higher high at $7.37. Seems sellers are starting to get eager on the 4h-1D.
I will look to scale out significantly just above ~$6.35. Of course holding a golden ticket if it tries to hit the 0.618 fib at $5.20
BTCUSD - Spring Loading (Wyckoff Accumulation in Progress)The current BTC structure resembles a classic Wyckoff accumulation phase.
After the Selling Climax (SC) and Automatic Rally (AR), the market forms a sequence of Secondary Tests (ST), showing absorption.
A final Spring could complete the structure before the SOS → LPS → Markup sequence unfolds.
In FRL terms, the AR level represents the neckline = start of the last impulse, confirming structural symmetry between Wyckoff and FRL logic.
