AUDUSD Intraday Technical Analysis - 10 Nov 2025AUDUSD Intraday Technical Analysis - 10 Nov 2025
Australian Dollar/US Dollar at 0.65320 (3:40 PM UTC+4) — consolidation breakout imminent.
📌 Market Context: Wyckoff Phase D accumulation post-August correction; Dow Theory secondary uptrend forming; Gann Square-of-9 targets 0.6580/0.6480.
🗺️ Multi-Timeframe Pulse:
1D: Inverted head-and-shoulders pattern neckline at 0.6500; RSI 55 (neutral); Ichimoku cloud support 0.6420; bullish reversal signal forming.
4H: Rising channel 0.6480-0.6580; EMA21>EMA50 (golden cross); VWAP from Sept 20 = 0.6510 (support level).
1H: Cup-and-handle breakout attempt from 0.6480 base; BB midline 0.6520; VWAP slope neutral-bullish.
30M: Symmetrical triangle 0.6500-0.6560; hidden bull divergence on RSI; volume contracting.
15M: Bull flag over 0.6510; Tenkan>Kijun bullish alignment; stochastic RSI ready for extension.
5M: Falling wedge retest 0.6500; hammer candlestick signals intraday demand; false breakout risk above 0.6560.
🎯 PRIMARY LONG SETUP
Entry: 0.6510-0.6525 (triangle support + VWAP) — confirm on 15M bullish close >0.6535.
Stop Loss: 0.6485 (below triangle base).
Target 1: 0.6555 (+35 pips).
Target 2: 0.6580 (+60 pips — channel top).
Target 3: 0.6620 (+100 pips — harmonic extension).
Confirmation: RSI>55, volume +20%, VWAP support holding.
⚡ MOMENTUM ADD: Scale above 0.6580 ONLY if RSI>65 + volume surge; trail stop to 0.6560.
🔻 REVERSAL SHORT SETUP
Entry: 0.6600-0.6625 (supply zone) — trigger on bearish engulfing + RSI divergence.
Stop Loss: 0.6650 (above channel resistance).
Targets: 0.6560 → 0.6520 → 0.6480 (Gann support).
Confirmation: 5M/15M RSI bearish divergence; BB upper band rejection.
🚨 BREAKOUT PROTOCOL:
BULL: 1H close >0.6580 confirms H&S breakout; target 0.6700; move stop to BE+15.
BEAR: 1H close <0.6500 with volume expansion triggers retest of 0.6420 cloud support.
📊 INDICATOR SNAPSHOT: BB squeeze (30M) tightening; MACD histogram positive; VWAP slope neutral-up; EMA21 acting as trigger line on 1H.
⚠️ PATTERN ALERTS: Harmonic bat PRZ at 0.6600; H&S neckline breakout >0.6500 = trend confirmation; channel failure <0.6510 = Wyckoff spring risk.
📈 TIMING & RISK: RBA decision watch; Gann 90° cycle 20:00 UTC; expect 0.80% intraday range. Risk ≤1% per setup; avoid chasing; lock gains at TP1.
Educational analysis only. Trade with your plan, manage risk, adapt to live price action.
DXY

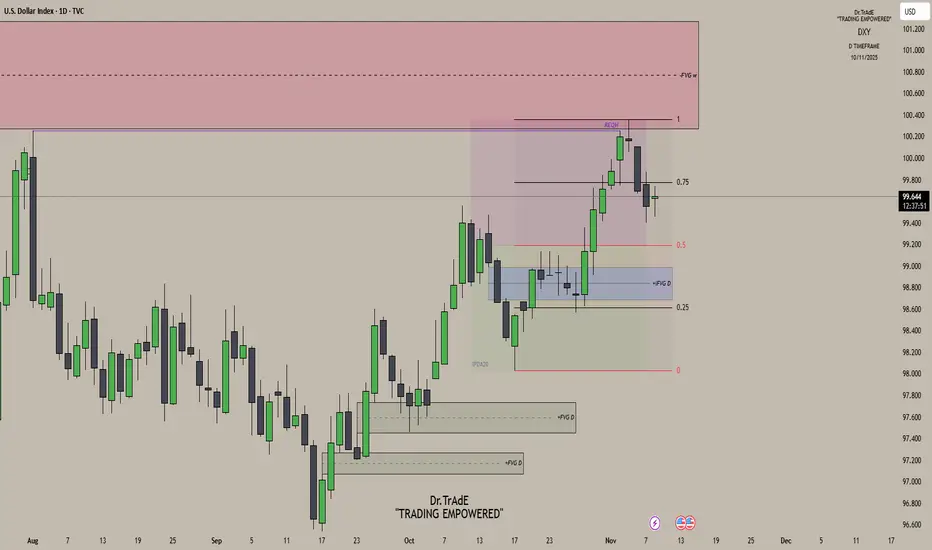
DXY Daily AnalysisLast Week’s Review:
Monday: Bullish delivery as price continued higher.
Tuesday: Price maintained bullish momentum but failed to take out the previous high, leaving equal highs — liquidity resting above.
Wednesday: That liquidity was swept as price reached into the weekly fair value gap, completing delivery to the premium array and initiating bearish distribution.
Current Outlook:
On the daily chart, we’re still trading deep inside premium, and price is showing clear signs of exhaustion after that delivery into the weekly FVG. With bearish distribution now in play, my bias remains bearish. Any short-term push back into the 0.75 quadrant, I’ll treat as a retracement — a chance for price to reprice some lower-timeframe inefficiencies before the next leg lower. On the 4H chart, I’ll be watching for price to trade back into short-term FVGs or inefficiencies that align with this overall bearish narrative.
GBPUSD Intraday Technical AnalysisGBPUSD Intraday Technical Analysis - 10 Nov 2025
British Pound/US Dollar at 1.31545 (3:15 PM UTC+4) — key confluence setup emerging.
📌 Market Context: Wyckoff accumulation phase post-September swing; Dow Theory secondary correction fading; Gann Square-of-9 targets 1.3180/1.3120.
🗺️ Multi-Timeframe Pulse:
1D: Double-bottom pattern near 1.3050; RSI 52 (neutral bias); Ichimoku cloud support 1.3020; bullish pennant forming.
4H: Rising channel 1.3120-1.3200; EMA21>EMA50>EMA200 (golden cross); VWAP from Oct 15 = 1.3145 (neutral pivot).
1H: Flag continuation above 1.3140; BB midline 1.3150; VWAP slope slightly bullish after 1.3100 test.
30M: Symmetrical triangle 1.3120-1.3170; hidden bull divergence on RSI; volume declining pre-breakout.
15M: Bull flag over 1.3140; Tenkan>Kijun bullish cross; stochastic RSI reset ready.
5M: Falling wedge retest 1.3140; hammer candlestick confirms intraday support; watch false breakout above 1.3175.
🎯 PRIMARY LONG SETUP
Entry: 1.3140-1.3155 (flag support + VWAP) — confirm on 15M bullish close >1.3160.
Stop Loss: 1.3115 (below triangle base).
Target 1: 1.3175 (+30 pips).
Target 2: 1.3200 (+55 pips — channel top).
Target 3: 1.3240 (+95 pips — harmonic extension).
Confirmation: RSI>55, volume spike >20% avg, VWAP support intact.
⚡ MOMENTUM SCALP: Add above 1.3200 ONLY if RSI>65 + sustained volume; trail stop to 1.3180.
🔻 REVERSAL SHORT SETUP
Entry: 1.3225-1.3250 (supply zone) — trigger on bearish engulfing + RSI divergence.
Stop Loss: 1.3280 (above channel resistance).
Targets: 1.3190 → 1.3150 → 1.3110 (Gann support).
Confirmation: 5M/15M RSI bearish divergence; BB upper band rejection on 1H.
🚨 BREAKOUT PROTOCOL:
BULL: 1H close >1.3200 confirms breakout; target 1.3300; move stop to BE+10.
BEAR: 1H close <1.3120 with volume expansion = retest 1.3050 double-bottom support.
📊 INDICATOR SNAPSHOT: BB squeeze (30M) tightening; MACD histogram positive; VWAP slope neutral-bullish; EMA21 acting as trigger line.
⚠️ PATTERN ALERTS: Harmonic bat PRZ at 1.3250; rising channel failure <1.3140 = Wyckoff spring signal; H&S risk if neckline 1.3090 breaks.
📈 TIMING & RISK: UK inflation data Nov 12 elevates volatility; BoE speakers expected; Gann 90° window 18:00 UTC. Risk ≤1% per setup; avoid chasing; lock partials at TP1.
Educational analysis only. Align entries with your plan, manage risk, adapt to price action.

Bullish momentum to extend?The US Dollar Index (DXY) is declining toward the pivot level, which serves as an overlap support zone, and may rebound toward the 1st resistance.
Pivot: 98.29
1st Support: 97.14
1st Resistance: 101.91
Disclaimer:
The above opinions given constitute general market commentary, and do not constitute the opinion or advice of IC Markets or any form of personal or investment advice.
Any opinions, news, research, analyses, prices, other information, or links to third-party sites contained on this website are provided on an "as-is" basis, are intended only to be informative, is not an advice nor a recommendation, nor research, or a record of our trading prices, or an offer of, or solicitation for a transaction in any financial instrument and thus should not be treated as such. The information provided does not involve any specific investment objectives, financial situation and needs of any specific person who may receive it. Please be aware, that past performance is not a reliable indicator of future performance and/or results. Past Performance or Forward-looking scenarios based upon the reasonable beliefs of the third-party provider are not a guarantee of future performance. Actual results may differ materially from those anticipated in forward-looking or past performance statements. IC Markets makes no representation or warranty and assumes no liability as to the accuracy or completeness of the information provided, nor any loss arising from any investment based on a recommendation, forecast or any information supplied by any third-party.

Gold | Oil | Dollar | Silver | Natural Gas Price ForecastGold | Oil | Dollar | Silver | Natural Gas Price Forecast
NYMEX:NG1! NYMEX:CL1! COMEX:SI1! COMEX:GC1!

US Dollar: Buy The Rally!Welcome back to the Weekly Forex Forecast for the week of Nov. 10-14th
In this video, we will analyze the following FX market: USD Dollar
The USD is in a pullback... that I believe is ending. Buying is the best bet! Once price gives the signature of a market shift from bearish to bullish, buys are valid!
Enjoy!
May profits be upon you.
Leave any questions or comments in the comment section.
I appreciate any feedback from my viewers!
Disclaimer:
I do not provide personal investment advice and I am not a qualified licensed investment advisor.
All information found here, including any ideas, opinions, views, predictions, forecasts, commentaries, suggestions, expressed or implied herein, are for informational, entertainment or educational purposes only and should not be construed as personal investment advice. While the information provided is believed to be accurate, it may include errors or inaccuracies.
I will not and cannot be held liable for any actions you take as a result of anything you read here.
Conduct your own due diligence, or consult a licensed financial advisor or broker before making any and all investment decisions. Any investments, trades, speculations, or decisions made on the basis of any information found on this channel, expressed or implied herein, are committed at your own risk, financial or otherwise.

Major Triad. Dollar Index, Euro and Pound. November 2nd weekFX:EURUSD
FX:GBPUSD
TVC:DXY
Onesided delivery towards the buyside on DXY. Outlined in the previous weekly outlook.

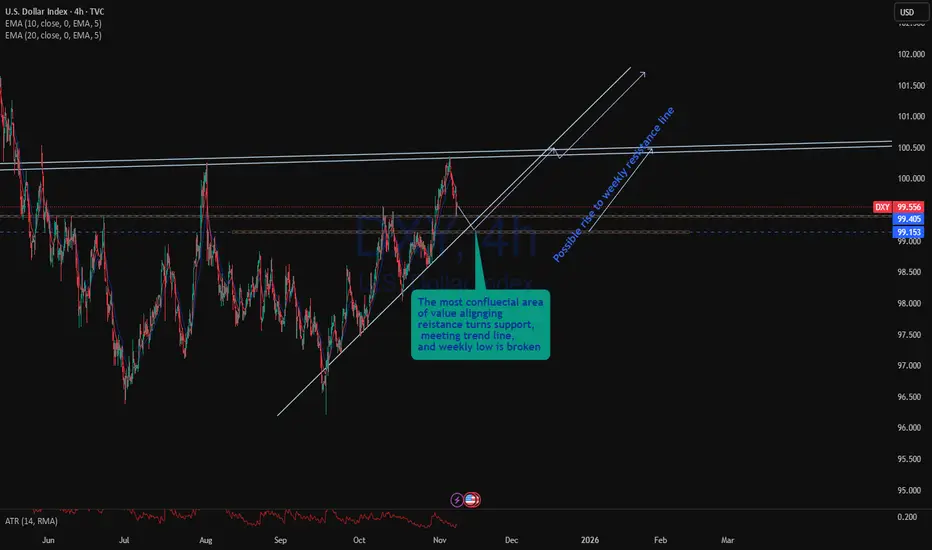
DXY is approaching a very area of value!As the US government shudtown started along with DXY's bullish trend is continuing except past weeks, needed pullback. with price formed a weekly pin par, which could bring early this week price to further down and, which may approach the most confluenced point of 99.15 which is the previous reistance turn support leading a possible buy zone for trend continuation.
Aligning 3 high confluence of
1. Trend line
2. Resistance turns support and
3. weekly low
upon price action rejection, and reversal confirmation to bullish it is a probability bullish market.
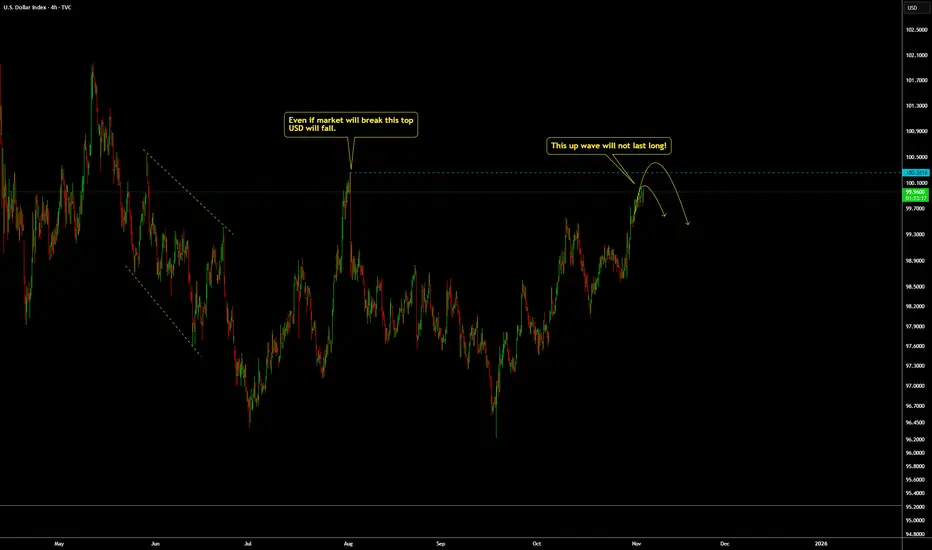
DXY : This Up Wave Won’t Last Long!The U.S. Dollar Index has made a corrective push up, but momentum looks weak. Structure suggests this “up wave” could soon fade, paving the way for another bearish move. Watch closely a potential reversal could be near!
Disclosure: We are part of Trade Nation's Influencer program and receive a monthly fee for using their TradingView charts in our analysis.*

1980 Redux? SILVER set to Outshine the NYSE Composite.Has Silver set the stage to approach its all time high's versus the "Big Index" that was last seen close to 50 years ago.?
Why this chart is spectacular:
Silver has moved sharply higher this year, breaching it's historic $50 threshold, a feat last seen in 1980 and 2011.
Notable the Silver/US Equities ratio (using the TVC:NYA as a broad proxy) is forming a multi year bottom structure. Suggesting we are in the process of a powerful repricing from equities to commodities.
This is not a crash call on Stocks.
Simply put Metals and commodities are just likely be faster horses and receive higher capital allocations.
We've seen the Big short during the GFC.
We've seen Saylor's Big long trade on #BTC
is Silver the Big Reversal?

DXY Will Go Lower! Short!
Please, check our technical outlook for DXY.
Time Frame: 5h
Current Trend: Bearish
Sentiment: Overbought (based on 7-period RSI)
Forecast: Bearish
The market is approaching a significant resistance area 99.554.
Due to the fact that we see a positive bearish reaction from the underlined area, I strongly believe that sellers will manage to push the price all the way down to 99.097 level.
P.S
We determine oversold/overbought condition with RSI indicator.
When it drops below 30 - the market is considered to be oversold.
When it bounces above 70 - the market is considered to be overbought.
Like and subscribe and comment my ideas if you enjoy them!

DXY FRGNT Weekly Forecast -Q4 | W46 | Y25 |📅 Q4 | W46 | Y25 |
📊 DXY FRGNT Weekly Forecast
🔍 Analysis Approach:
I’m applying Smart Money Concepts, focusing on:
Identifying Points of Interest on the Higher Time Frames (HTFs) 🕰️
Using those POIs to define a clear trading range 📐
Refining those zones on Lower Time Frames (LTFs) 🔎
Waiting for a Break of Structure (BoS) for confirmation ✅
This method allows me to stay precise, disciplined, and aligned with the market narrative, rather than chasing price.
💡 My Motto:
"Capital management, discipline, and consistency in your trading edge."
A positive risk-to-reward ratio, paired with a high win rate, is the backbone of any solid trading plan 📈🔐
⚠️ Losses?
They’re part of the mathematical game of trading 🎲
They don’t define you — they’re necessary, they happen, and we move forward 📊➡️
🙏 I appreciate you taking the time to review my Daily Forecast.
Stay sharp, stay consistent, and protect your capital
— FRNGT 🚀
TVC:DXY

DXY (DOLLAR INDEX) outlook for this weekDXY Weekly Outlook
Looking at the dollar this week, it’s aligning nicely with my setups on EU and GU. I’m watching to see if price will mitigate the 8hr supply zone, which fits perfectly with my plan to buy EU and GU from their demand zones — since a move down in the dollar typically means those pairs will push higher.
Alternatively, if the dollar bounces from demand and continues up, then I’ll be looking for sell opportunities on EU and GU instead.
Overall, DXY still looks bullish long term, and I believe this current downside move is just a temporary bearish correction before continuing higher.

FRGNT FUN COUPON FRIDAY -Q4 | W45 | D7| Y25 | DXY📅 Q4 | W45 | D7| Y25 |
📊 DXY FRGNT Daily Forecast
FRGNT FUN COUPON FRIDAY
🔍 Analysis Approach:
I’m applying Smart Money Concepts, focusing on:
Identifying Points of Interest on the Higher Time Frames (HTFs) 🕰️
Using those POIs to define a clear trading range 📐
Refining those zones on Lower Time Frames (LTFs) 🔎
Waiting for a Break of Structure (BoS) for confirmation ✅
This method allows me to stay precise, disciplined, and aligned with the market narrative, rather than chasing price.
💡 My Motto:
"Capital management, discipline, and consistency in your trading edge."
A positive risk-to-reward ratio, paired with a high win rate, is the backbone of any solid trading plan 📈🔐
⚠️ Losses?
They’re part of the mathematical game of trading 🎲
They don’t define you — they’re necessary, they happen, and we move forward 📊➡️
🙏 I appreciate you taking the time to review my Daily Forecast.
Stay sharp, stay consistent, and protect your capital
— FRNGT 🚀
TVC:DXY

Stop!Loss|Market View: USDJPY🙌 Stop!Loss team welcomes you❗️
In this post, we're going to talk about the near-term outlook for the USDJPY currency pair☝️
Potential trade setup:
🔔Entry level: 154.304
💰TP: 156.111
⛔️SL: 153.446
"Market View" - a brief analysis of trading instruments, covering the most important aspects of the FOREX market.
👇 In the comments 👇 you can type the trading instrument you'd like to analyze, and we'll talk about it in our next posts.
💬 Description: A second test of the 153.446 support level isn't a good buy signal, and it's best to take aside from buy positions near current levels for now. The most attractive option for buyers remains near the 154.310 resistance level. If the price does reach that level soon, it's highly likely that the price will continue moving toward 155-156 as sellers liquidate their positions.
Thanks for your support 🚀
Profits for all ✅
❗️ Updates on this idea can be found below 👇

Stop!Loss|Market View: GBPUSD🙌 Stop!Loss team welcomes you❗️
In this post, we're going to talk about the near-term outlook for the GBPUSD currency pair☝️
Potential trade setup:
🔔Entry level: 1.31268
💰TP: 1.28032
⛔️SL: 1.32581
"Market View" - a brief analysis of trading instruments, covering the most important aspects of the FOREX market.
👇 In the comments 👇 you can type the trading instrument you'd like to analyze, and we'll talk about it in our next posts.
💬 Description: As previously predicted, the USD's dominance is strengthening and is likely to continue in the mid-term. For the pound, all key short-term targets have been completed, as have the mid-term targets outlined in previous reviews. Further downward movement is currently expected toward 1.27130, which is the next significant support level. Given the current situation, sell opportunities are currently only located above 1.31590, should the price return there for a retest.
Thanks for your support 🚀
Profits for all ✅
❗️ Updates on this idea can be found below 👇

GBP/USD – BoE Rate Decision Ahead |(06.11.2025)🧠 Setup Overview:
GBP/USD is trading inside a descending channel, with price recently rebounding from a strong support zone near 1.3000.
Ahead of the Bank of England (BoE) interest rate decision, the pair is positioned for a possible bullish breakout if the BoE maintains rates and highlights inflation risks.
📊 Trading Plan:
Bullish Scenario:
If the BoE holds rates and remains cautious on inflation → expect GBP/USD to rebound toward 1.3120 – 1.3180.
Breakout confirmation above channel resistance will strengthen the bullish view.
Bearish Scenario:
If the BoE signals dovish tone or hints at future rate cuts, GBP/USD could drop below 1.3000, targeting 1.2850 – 1.2710.
⚙️ Technical Levels:
🟢 1st Resistance: 1.3133
🟢 2nd Resistance: 1.3171
🔴 Support Zone: 1.3000 – 1.3020
Pattern: Falling Channel → Potential Breakout
🧩 Fundamental Insight (Today – 6 Nov 2025)
1.Markets price a 1-in-3 chance of a BoE rate cut to 3.75%, but consensus expects a hold at 4.00%.
2.UK inflation at 3.8% YoY remains above the BoE’s target, supporting a hawkish stance.
3.A surprise dovish tone, however, could hit the pound hard against the USD, especially as US data remains resilient and the dollar stays firm.
#GBPUSD #BoE #Forex #TechnicalAnalysis #PriceAction #ChartPatterns #KABHI_TA_TRADING #FundamentalAnalysis #BankOfEngland #InterestRates #FXMarket #TradingPlan #ForexSetup #ChartsDontLieTradersDontQuit #GBP #USD #TradingView
⚠️ Disclaimer:
This analysis is for educational purposes only and not financial advice. Always do your own analysis and manage risk carefully before trading news events.
💬 Support My Work ❤️
If you find this chart helpful — LIKE 👍, COMMENT 💭, and FOLLOW 🔔 to stay updated with more daily Forex setups and price action insights!

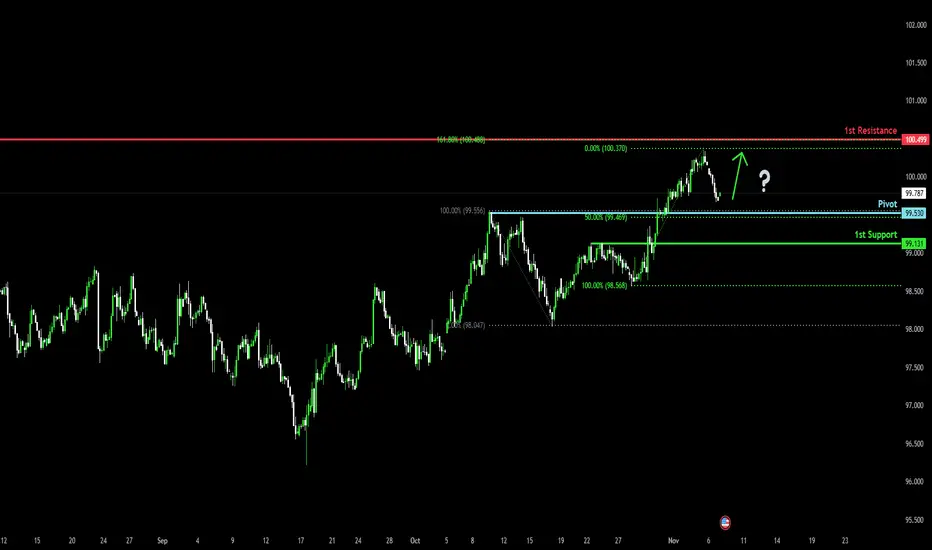
Bullish bounce off 50% Fibonacci support?The US Dollar Index (DXY) is falling towards the pivot, which has been identified as a pullback support that aligns with the 50% Fibonacci retracement and could bounce to the 1st resistance.
Pivot: 99.53
1st Support: 99.13
1st Resistance: 100.49
Disclaimer:
The above opinions given constitute general market commentary, and do not constitute the opinion or advice of IC Markets or any form of personal or investment advice.
Any opinions, news, research, analyses, prices, other information, or links to third-party sites contained on this website are provided on an "as-is" basis, are intended only to be informative, is not an advice nor a recommendation, nor research, or a record of our trading prices, or an offer of, or solicitation for a transaction in any financial instrument and thus should not be treated as such. The information provided does not involve any specific investment objectives, financial situation and needs of any specific person who may receive it. Please be aware, that past performance is not a reliable indicator of future performance and/or results. Past Performance or Forward-looking scenarios based upon the reasonable beliefs of the third-party provider are not a guarantee of future performance. Actual results may differ materially from those anticipated in forward-looking or past performance statements. IC Markets makes no representation or warranty and assumes no liability as to the accuracy or completeness of the information provided, nor any loss arising from any investment based on a recommendation, forecast or any information supplied by any third-party.
DXY(Dollar Index): This up wave will not last long.For TVC:DXY , don't be trapped with this up wave, it should not last long. What is happening now is only manipulation based on what we see.
Fed will continue to cut rates if not this year, next year and they are printing money, ending the QT and also things are not okay. Based on that, on the fundamental part of things and We Trade Waves wave analysis concept. Any sell setup we get for DXY we will go for it BUT:
Always remember WTW 4 Golder Rules:
1) Do not jump in
2) Do not over risk/trade
3) Do not trade without Stop Loss
4) Never ever add to a losing position!
Trade with care
We Trade Waves
WTW Team
Disclosure: We are part of Trade Nation's Influencer program and receive a monthly fee for using their TradingView charts in our analysis.
DOLLAR INDEX (DXY): Too Overbought Now
Looks like Dollar Index finally starts correction.
A test of a significant hisotric daily resistance triggered
a bearish movement and an intraday change of character
on a 4H time frame.
I think that the market may drop lower.
Goal - 99.8
❤️Please, support my work with like, thank you!❤️

DXY Near 100 as Rate-Cut Odds Fade and Uptrend Remains IntactHey Traders,
In today’s trading session we are monitoring the US Dollar Index (DXY) for a buying opportunity around the 100.000 zone. The Index is trading in a broader uptrend and currently is in a correction phase, approaching the trend support/resistance area near 100.000.
Structure:
The prevailing trend remains bullish, though price is consolidating and retesting the support/resistance level at 100.000. A solid rebound here could signal a resumption of the upward trajectory.
Fundamentals:
Recent commentary from the Federal Reserve indicates that a rate cut in December is increasingly unlikely. This hawkish tilt supports the Dollar and reinforces the up-trend scenario.
Next move:
Watching how price behaves around 100.000 — if the level holds, the bias remains bullish; a break below would call structural risk into question.
Trade safe,
Joe.

URUSD Faces Pressure Near 1.15100 as DXY Holds Strong Above 100!Hey Traders,
In today’s trading session we are monitoring EURUSD for a selling opportunity around the 1.15100 zone. The pair is trading within a broader downtrend and is currently in a correction phase, approaching the trend resistance at 1.15100.
Structure:
EURUSD continues to form lower highs and lower lows, suggesting that sellers remain in control. The 1.15100 zone stands as a key resistance where bearish momentum could resume.
Fundamentals:
This setup aligns with the recent DXY analysis, where the Dollar Index is holding firm around 100.000 after hawkish Fed remarks downplayed the likelihood of a December rate cut. A resilient Dollar backdrop strengthens the bearish case for EURUSD as policy divergence continues to favor the greenback.
Next move:
We’ll be watching price action at 1.15100 for potential rejection and continuation lower.
Trade safe,
Joe.

DXY — London Session🧭 Market Context
Dollar capped down overnight from 99.762 to 99.704 but still trades above the key bullish structure point at 99.525. The structure remains bullish overall, yet price keeps failing to break through 99.875 — the current cap. London session has filled yesterday’s balance range, leaving us in neutral territory.
We’re sitting on zero deviation — meaning equal chance to push higher or rotate lower.
Before taking any position, we need confirmation.
📈 Technical Frame DSM + VFA
Structure stays constructive but momentum is fading.
Volume shows thinning participation near 99.875 — professionals aren’t chasing.
If we see clear volume conviction through that level, we likely drive higher and fill the capped zone. If price slips below 99.525, expect a liquidity sweep into the lower volume pocket near 99.40. Right now, this is observation mode — not engagement mode.
🌍 Fundamental Frame (Macro Logic)
Overnight softness came from mild risk-on sentiment — Asia equities up, yields down.
Still, the Fed’s tone stays restrictive, and dollar demand remains under the surface.
This move looks more like positioning ahead of NFP than any real shift in trend.
🏛️ Coach’s Lens
When the market sits in balance, patience becomes the edge.
Professionals wait for clarity; amateurs act on hope.
Bias follows structure — not emotion.
🎯 Operator Rule
Confirmation defines conviction.
— CORE5DAN
Institutional Logic. Modern Technology. Real Freedom.
