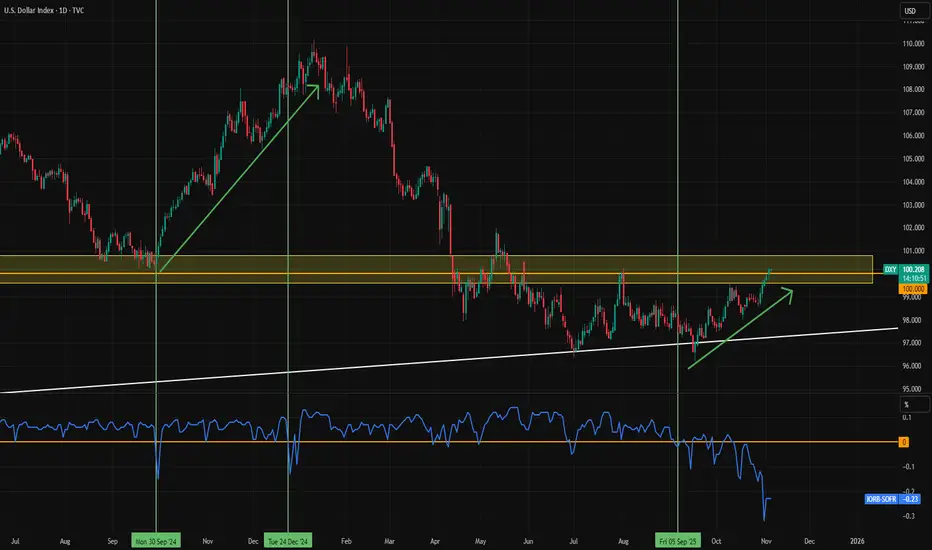
Dollar Rises Amid Record US Shutdown and Liquidity ShortageThe dollar index is climbing as the US faces its longest government shutdown on record. The FRED:SOFR rate is trading 0.23 percentage points above the FRED:IORB , signaling a liquidity shortage. Unfortunately, TradingView data doesn’t cover the 2019 liquidity crunch, but the current situation looks similar.
Earlier this week, Logan highlighted the elevated repo rate and noted that the Fed may need to step in and purchase assets if conditions persist. The liquidity shortage is putting upward pressure on the dollar index. A breakout above 101 could accelerate that pressure further.
If the US shutdown ends, renewed government spending could ease the liquidity strain, allowing the dollar to retreat. Until then, upward momentum is likely to continue.
DXY
EUR/CAD: Bullish Outlook📈EURCAD formed a significant inverted head and shoulders pattern on a 4-hour timeframe.
The neckline for this pattern is identified between 1.6226 and 1.6210.
Should the price successfully break and close above this neckline, it would indicate a strong bullish signal.
In such a scenario, the market could potentially advance towards the 1.6560 level.
Please note that the neckline currently acts as a robust demand area. Shorting opportunities should only be considered after a confirmed breakout of this level.

DXY FRGNT Daily Forecast -Q4 | W45 | D5| Y25 |📅 Q4 | W45 | D5| Y25 |
📊 DXY FRGNT Daily Forecast
🔍 Analysis Approach:
I’m applying Smart Money Concepts, focusing on:
Identifying Points of Interest on the Higher Time Frames (HTFs) 🕰️
Using those POIs to define a clear trading range 📐
Refining those zones on Lower Time Frames (LTFs) 🔎
Waiting for a Break of Structure (BoS) for confirmation ✅
This method allows me to stay precise, disciplined, and aligned with the market narrative, rather than chasing price.
💡 My Motto:
"Capital management, discipline, and consistency in your trading edge."
A positive risk-to-reward ratio, paired with a high win rate, is the backbone of any solid trading plan 📈🔐
⚠️ Losses?
They’re part of the mathematical game of trading 🎲
They don’t define you — they’re necessary, they happen, and we move forward 📊➡️
🙏 I appreciate you taking the time to review my Daily Forecast.
Stay sharp, stay consistent, and protect your capital
— FRNGT 🚀
TVC:DXY

DXY Institutional Pullback Setup – Smart Money Buying the Dip!💰 DXY: The Dollar Flexing Hard - Institutional Swing Play! 🎯
📊 Market Overview
The U.S. Dollar Index (DXY) is showing serious institutional strength! After a clean pullback to the 786 Triangular Moving Average, we're locked and loaded for a bullish continuation play. This setup screams "smart money accumulation" and we're positioning for the ride up! 💪
🎯 The Setup: Bullish Confirmation ✅
Asset: DXY (U.S. Dollar Index CFD)
Bias: 🟢 BULLISH - Confirmed on institutional timeframes
Strategy Type: Swing/Day Trade Hybrid
📈 Technical Confluence:
✅ 786 TMA Pullback - Textbook institutional support zone
✅ Price action holding above key structure
✅ Volume profile showing accumulation
✅ Smart money footprint evident
🎲 The "Layered Entry" Gameplan (Thief Style 😎)
Instead of going all-in at one price, we're using multiple limit orders (layering strategy) to build our position like the institutions do:
💵 Entry Zones (Layer Your Orders):
Layer 1: 98.400
Layer 2: 98.600
Layer 3: 98.800
Note: You can add more layers based on your risk appetite and account size! The beauty of layering? You average into the move without FOMO-ing at the worst price. 🧠
Current Price Entry: Yes, you can enter at market if you're confident in the setup, but layering gives you better risk management.
🛡️ Risk Management (Thief OG Edition)
🚨 Stop Loss: 98.100
This is MY stop loss based on my risk tolerance. IMPORTANT: I'm NOT telling you to blindly copy this. Set your SL based on YOUR account size, risk percentage, and comfort level. Trade your plan, not mine! 🎰
🎯 Profit Target: 100.000 (The Big Round Number!)
🧲 Why 100.000?
Simple Moving Average acting as strong resistance
Psychological round number = liquidity magnet 🧲
Overbought conditions likely near this zone
Trap potential for late longs - we want to exit before the crowd panics!
Exit Strategy: Take profits in stages! Don't be greedy. 💰 Consider taking 50% off at 99.500 and letting the rest ride to 100.000 with a trailing stop.
DISCLAIMER: This target is MY analysis. You decide when to take profits based on your strategy. If you see your account glowing green, TAKE THE MONEY! 💸
🔗 Related Pairs to Watch (Correlation Game 🕹️)
The DXY doesn't move in isolation! Here are the correlated plays:
📉 Inverse Correlations (These typically move OPPOSITE to DXY):
FX:EURUSD - Strong negative correlation (~-95%). DXY up = EUR/USD down
FX:GBPUSD - Cable follows Euro's lead, watch for breakdown
OANDA:AUDUSD & OANDA:NZDUSD - Commodity currencies get crushed when DXY rips
Gold ( OANDA:XAUUSD ) - Dollar strength = gold weakness (classic inverse)
📈 Positive Correlations (These move WITH DXY):
FX:USDJPY - Yen pairs amplify dollar moves
OANDA:USDCHF - Swissy follows dollar strength
OANDA:USDCAD - Loonie weakens on DXY strength (unless oil goes parabolic)
Pro Tip: If DXY is pumping but EUR/USD isn't dumping proportionally, something's off - be careful! 🚩
🧠 Key Points & Edge:
Institutional Level Confirmed - The 786 TMA is a proven reversal/continuation zone used by big money
Swing Trading Sweet Spot - This isn't a scalp; give it room to breathe
Layer Like a Pro - Don't blow your load on one entry; scale in strategically
Risk First, Profits Second - Protect your capital like it's your only child 👶
Watch Correlations - DXY strength impacts EVERYTHING in Forex
⚠️ Risk Disclosure & "Thief Style" Disclaimer
THIS IS THE "THIEF STYLE" TRADING STRATEGY - JUST FOR FUN AND EDUCATIONAL PURPOSES! 🎲
This analysis represents MY personal trading plan and bias. I am NOT a financial advisor, and this is NOT financial advice. Trading involves substantial risk of loss, and you could lose more than your initial investment.
✅ Do your own research (DYOR)
✅ Never risk more than you can afford to lose
✅ Past performance ≠ future results
✅ Markets can remain irrational longer than you can remain solvent
Trade at your own risk! I'm sharing my playbook, but YOU are responsible for your account. If you make money, congrats! 🎉 If you lose money, that's on you, not me. Manage your risk like a pro! 💪
🚀 Let's Catch This Move Together!
The setup is ripe, the levels are clear, and the plan is locked in. Now we wait for the market to come to us - patience pays in this game! ⏰
✨ If you find value in my analysis, a 👍 and 🚀 boost is much appreciated — it helps me share more setups with the community!
#DXY #USDollarIndex #ForexTrading #SwingTrading #InstitutionalTrading #TechnicalAnalysis #TradingStrategy #ForexSignals #PriceAction #SupportAndResistance #RiskManagement #EURUSD #ForexCorrelation #SmartMoney #TradingView #MarketAnalysis #DayTrading #ForexLife #ThiefStyle #LayeredEntry #DollarBull
Happy Trading, Thief OGs! 💎🙌

EURJPY SELL SETUP🎯 4. Entry Strategy
✅ Step 1 – Wait for Price to Enter Supply Zone
Be patient and wait until price reaches the red zone (176.600–176.700).
This ensures you’re not entering early during the retracement.
✅ Step 2 – Look for Confirmation (on Lower Timeframes)
Switch to a 5-minute or 1-minute chart inside the supply zone and look for:
Liquidity grab (a wick or small breakout above previous highs).
Change of Character (ChoCH) to the downside (break of minor structure).
Bearish engulfing candle or strong downward move confirming seller presence.
✅ Step 3 – Execute the Entry
Sell after confirmation of bearish structure shift (post-ChoCH).
Place Stop Loss just above the zone (above 176.700).
Place Take Profit at the next demand zone (175.400 area).

Stop!Loss|Market View: GOLD🙌 Stop!Loss team welcomes you❗️
In this post, we're going to talk about the near-term outlook for GOLD ☝️
Potential trade setup:
🔔Entry level: 3973.498
💰TP: 3652.481
⛔️SL: 4079.122
"Market View" - a brief analysis of trading instruments, covering the most important aspects of the FOREX market.
👇 In the comments 👇 you can type the trading instrument you'd like to analyze, and we'll talk about it in our next posts.
💬 Description: There is still a lot of pressure on metals to sell because the point of control (POC) has shifted to current prices. This situation suggests attempts to buy back the metal amid a downward correction, but as we can see, the price is not yet favoring buying. However, a retest of the 4100-4150 area is not ruled out, which could also prompt a sell-off. The main sell scenario is a decline from current prices toward the previously mentioned 3600-3700 area.
Thanks for your support 🚀
Profits for all ✅
❗️ Updates on this idea can be found below 👇

Stop!Loss|Market View: EURUSD🙌 Stop!Loss team welcomes you❗️
In this post, we're going to talk about the near-term outlook for the EURUSD currency pair☝️
Potential trade setup:
🔔Entry level: 1.15376
💰TP: 1.14037
⛔️SL: 1.16344
"Market View" - a brief analysis of trading instruments, covering the most important aspects of the FOREX market.
👇 In the comments 👇 you can type the trading instrument you'd like to analyze, and we'll talk about it in our next posts.
💬 Description: The euro continues to be under pressure to sell this week. The USD index (DXY) is testing the area near 100 and is likely to move higher to 105-107, as noted earlier. EURUSD is already trading below 1.15500, but we're not seeing any strong downward momentum as expected. Even so, there is still pressure to sell, and the price is likely to go back to 1.15500. After that, it will likely head toward 1.14000.
Thanks for your support 🚀
Profits for all ✅
❗️ Updates on this idea can be found below 👇

XAUUSD BUY OR SELL ?🎯 Entry Plan
Step 1 – Wait for Price to Reach Supply Zone
Don’t enter early. Wait until price comes into the highlighted supply area.
Step 2 – Look for Reversal Confirmation
Once price is inside the zone, look for lower timeframe confirmations (on 5m or 15m):
Break of structure (BoS) to the downside within the zone.
Rejection candles (like bearish engulfing, pin bar).
Liquidity grab above previous highs.
Step 3 – Entry
After confirmation, enter a short position when price breaks the internal structure downward (mini BoS).
This ensures you are entering after momentum shifts.
Step 4 – Stop Loss & Take Profit
Stop Loss (SL): Just above the supply zone (e.g., above 4,005).
Take Profit (TP):
First target: Previous low (around 3,930).
Extended target: 3,910 or lower depending on continuation.

$ Up - Emerging Markets Down?As you can see, there is a huge relationship between the DXY and EMM that most people do not understand.
I won't go into the macroeconomics of it all since most are just traders. All you need to know is that they work in opposite directions. Strong $ bad for merging markets and vice versa.
As you can see, the $ has popped off of support while EMM is still in a very tight, tight channel that usually collapses out of this structure.
Needless to say EEM price does not like to be above $50.
Simultaneously, EMM is hitting a key area at 17-year highs. This presents us with a wonderful risk-reward trade for a short with a well-defined stop-out.
This opportunity has only presented itself just 2 times before in 17 years!
Given the global sell-off going on at the moment, there is a very high probability this short pays off. Remember, fear causes money to run to the $, so the bounce we see in the current environment is pretty solid.
Conversely, should it fail and EEM pops while the $ breaks down from support, then you have an excellent long setup
You could ride for a while.
Remember, I am a macro investor. I don't do 2% moves and get scared out or take profits. My definition of success are big moves over time.
Click boost, like, and subscribe! Let's get to 5,000 followers! ))

Could reduced Fed rate-cut expectations keep the dollar strong?
The dollar index extended its gains as the Fed’s increasingly cautious stance on additional rate cuts strengthened sentiment.
Dallas Fed President Logan noted that without clear evidence of inflation falling or a sharp cooling in the labor market, another rate cut in December would be difficult to justify. Similarly, Cleveland Fed President Hammack emphasized the need to maintain a degree of tightening to bring inflation back to target.
Meanwhile, the federal government shutdown reached its 35th day, tying the record from Trump’s first term. The CBO estimated that the shutdown has already shaved about 1% off Q4 GDP, with the impact potentially widening to 2% by the end of November if it continues.
DXY extended its uptrend, briefly testing the resistance at 100.20. Diverging bullish EMAs indicate a potential extension of bullish momentum. If DXY breaches above 100.20, the index may advance toward the following resistance at 100.50. Conversely, if DXY breaks below 100.00, the index could retreat toward the next support at 99.50.

Waiting on the Sweep – ADP Should Provide the CatalystChoppy week so far with price distributing and grinding lower. Last week’s low still hasn’t been taken, so my macro target remains the same. I’m looking for ADP tomorrow during NY session to provide the volatility needed to run liquidity and complete that sweep.
Not predicting direction on the release itself — I’ll be waiting for a liquidity grab and displacement before considering an entry. If price runs stops above today’s Asia high or drives directly into last week’s low, I’ll be watching for the post-news retrace to an FVG/structural level to participate.
Patience here — the move is close, but confirmation > anticipation.

US Dollar Index (DXY) – 4H Technical Analysis ( Update)US Dollar Index (DXY) – 4H Technical Analysis
Current Price: 99.77 (+0.28%)
Trend: Bullish continuation within a strong uptrend
Technical Overview
The DXY continues its bullish structure, forming a Break of Structure (BOS) above 99.60, confirming a continuation of upward momentum.
Price is trading above the 14 EMA (white) and 200 EMA (yellow), indicating strong bullish momentum and trend alignment.
The market recently tapped into a supply zone near 99.75 – 99.80, showing initial signs of short-term rejection, but the broader trend remains upward.
Key Levels
Immediate Resistance: 99.75 – 99.85 (current supply zone)
Next Resistance: 100.00 (psychological level)
Immediate Support: 99.35 (minor structure)
Major Support Zone: 98.70 – 98.30 (demand area with EMA confluence)
Indicators
Stochastic
RSI currently around 75, approaching the overbought zone, which could trigger a short-term pullback before continuation.
The momentum structure remains intact, and both moving averages are sloping upward — a bullish continuation bias remains valid unless 99.35 breaks down.
Market Context
A strong DXY typically pressures risk assets, including BTC and equities.
Combined with rising USDT Dominance, this reinforces a risk-off environment — investors are moving to safety (USD and stablecoins).
If DXY breaks above 99.80, expect further crypto weakness and possible BTC retest near 104,000 – 102,000.
Summary
Bias: Bullish
Short-Term Expectation: Minor pullback → continuation toward 100.00
Invalidation: A breakdown below 99.35 would signal a shift to neutral and potential mean reversion toward 98.70

EURUSDHello Traders! 👋
What are your thoughts on EURUSD?
Euro/Dollar remains within a downward channel, forming consistent lower highs and lows.
The pair is expected to extend its decline toward the support zone that coincides with the lower boundary of the channel.
From there, a bullish rebound could occur, targeting the marked resistance levels above.
If price breaks below the support zone and a candle closes beneath it, this scenario becomes invalid.
For a safer entry, traders may wait until the channel is broken to the upside for confirmation of a trend reversal.
Don’t forget to like and share your thoughts in the comments! ❤️

Big Moves Ahead? DXY, EUR/USD & Gold at Crucial LevelsLadies and gentlemen, there was a time when forex was full of trading opportunities... to the point where most people struggled with overtrading. But these days, you need a solid watchlist to even find positions, and that's where Skeptic Lab comes in—it's a great spot for spotting good opportunities. So without further ado, let's dive into the analysis of DXY , or the dollar index.
💲 In the daily timeframe , after the drop it had, it's entered a consolidation box, and it looks like we're nearing the end of that box. The main long trigger is a break of 100.262 from a technical standpoint, but personally, after the break of 99.850, I'm already positioned on one of the USD symbols. In lower timeframes, plus the fact that breaking the ceiling of consolidations is usually not straightforward and comes with a lot of volatility, so it's better to have a pre-breakout position.
💶Let's head over to EURX in the 4H timeframe —we've had a good reaction at the 1085.9 support. Breaking it would be a great trigger if you want a EURUSD position.
Speaking of EURUSD , it's already entered a secondary bearish trend after breaking its daily trend line. If the DXY consolidation box breaks, EURUSD will officially change its HWC trend to bearish. The position I mentioned at the start of the analysis—I opened it with the break of that same daily EURUSD trend line. The key level for profit-taking will be 1.14640. I'll wait to see what reaction DXY gives—if it fakes the box break, I'll close the position; if not, I'll leave it open for now.
🪙But let's move on to gold —the commodity I'm eyeing today for opening a position. From a technical perspective, it's at a spot that gives both short and long triggers... let me explain.
In the daily timeframe, we had a strong uptrend rally that, after reaching 4377.67 , entered its secondary corrective trend. In the 4H timeframe, what's interesting is the formation of these range boxes we're seeing. So our long and short triggers are clear: break of the box ceiling = long / break of the box floor = short.
But the thing is, the targets are the same... see, opening a short here basically means going along with the secondary trend, so? Your expectations should be relative to this leg, not the weekly one... so it's better to take your targets quicker, like 3896.31 (the 0.38 fib intersection), which could be a good target. Plus, each bearish leg is weaker than the previous one, so the point I mentioned makes sense for the target.
For longs, though, you can proceed with partial profits and not close too early. Alright, that's it. Now get outta here.

BITCOIN 2025 - MAKE OR BREAKBTC is coiling. Liquidity is tightening. Momentum is fading. The market is soon to decide whether we break higher toward the next resistance leg… or lose key support and trigger a broader correction.
Two key dates stand out: November 6 and November 17.

DXY FRGNT Daily Forecast -Q4 | W45 | D4| Y25 |
📅 Q4 | W45 | D4| Y25 |
📊 DXY FRGNT Daily Forecast
🔍 Analysis Approach:
I’m applying Smart Money Concepts, focusing on:
Identifying Points of Interest on the Higher Time Frames (HTFs) 🕰️
Using those POIs to define a clear trading range 📐
Refining those zones on Lower Time Frames (LTFs) 🔎
Waiting for a Break of Structure (BoS) for confirmation ✅
This method allows me to stay precise, disciplined, and aligned with the market narrative, rather than chasing price.
💡 My Motto:
"Capital management, discipline, and consistency in your trading edge."
A positive risk-to-reward ratio, paired with a high win rate, is the backbone of any solid trading plan 📈🔐
⚠️ Losses?
They’re part of the mathematical game of trading 🎲
They don’t define you — they’re necessary, they happen, and we move forward 📊➡️
🙏 I appreciate you taking the time to review my Daily Forecast.
Stay sharp, stay consistent, and protect your capital
— FRNGT 🚀
TVC:DXY

A 30-Minute Look at USDJPY AnalysisHello friends,
I have prepared my USDJPY analysis for you.
In this analysis, I plan to open a buy position between the 154.003 and 153.831 levels, aiming for the 154.453 level.
This analysis has been carried out on the 30-minute timeframe.
Once my target is reached, I will share the updates with you here.
Friends, every single like from you is the greatest source of motivation for me to continue sharing these analyses.
I sincerely thank everyone who supports me with their appreciation.
With respect and love.

Bullish momentum set to continue?The US Dollar Index (DXY) is falling towards the pivot, which is a pullback suport and could bounce to the 1st resistance.
Pivot: 99.53
1st Support: 98.55
1st Resistance: 101.46
Disclaimer:
The above opinions given constitute general market commentary, and do not constitute the opinion or advice of IC Markets or any form of personal or investment advice.
Any opinions, news, research, analyses, prices, other information, or links to third-party sites contained on this website are provided on an "as-is" basis, are intended only to be informative, is not an advice nor a recommendation, nor research, or a record of our trading prices, or an offer of, or solicitation for a transaction in any financial instrument and thus should not be treated as such. The information provided does not involve any specific investment objectives, financial situation and needs of any specific person who may receive it. Please be aware, that past performance is not a reliable indicator of future performance and/or results. Past Performance or Forward-looking scenarios based upon the reasonable beliefs of the third-party provider are not a guarantee of future performance. Actual results may differ materially from those anticipated in forward-looking or past performance statements. IC Markets makes no representation or warranty and assumes no liability as to the accuracy or completeness of the information provided, nor any loss arising from any investment based on a recommendation, forecast or any information supplied by any third-party.

USD Index, AUD/USD Hint at Near Term ReversalsAs outlined in last week’s video, I suspect the US dollar may have the potential to break higher as part of its wave C before momentum realigns with its dominant bearish trend. However, Monday’s shooting star candle just below 100, coupled with an overbought RSI (2), warns of a potential pullback ahead of any breakout.
Also note that AUD/USD has formed a spinning top doji near the September low, suggesting that bearish momentum is waning despite closing lower for a fourth consecutive day.
With the RBA likely to deliver a hawkish tone when they hold rates today, there’s potential for a short-term bounce in the Australian dollar. However, if I’m right in expecting an eventual bullish breakout in the US dollar index, I’ll also be watching for evidence of a swing high on AUD/USD once that anticipated bounce is delivered.
Matt Simpson, Market Analyst at City Index

EURUSD: Liquidity Grab @ 1.15000EURUSD has experienced a liquidity grab as price closed below the previous low and is heading towards 1.15. CRT suggest price could go lower and wick below the previous candle or even drop further.
Alongside 1.15, there is an imbalance, which price could tap into and possibly fill, both EURUSD and GBPUSD has some divergence so it will be interesting to see how it plays out

GBPUSD: Liquidity Grab off 1.31000CRT suggests Pound/Dollar could drop further below 1.31000, however, is there enough bearish momentum to keep it dropping? With wicks to the bottom that Liquidity Grab could experience a pullback, maybe back towards the POI it created whilst dropping.

DXY Has 99 Problems, Getting Above 100 Is One!Here we have TVC:DXY on the Weekly Chart.
Now clearly outlined we can see there is a very valuable level here @ 99-100 that the USD:
- Used as Resistance from 2015 til the Bullish Breakout in April 2020
- Used as Support from 2023 til the Bearish Breakdown in April 2025
Fundamentally is a very sketchy scenario because with the Shutdown causing lack of important data needed, The Federal Reserve is making Interest Rate cuts. This weakens the Dollar because it makes it less favorable to Foreign Investing.
On the flip side, Consumers Dollars are able to stretch further allowing them to purchase more but unfortunately we still combat the inflated prices on goods. Companies have the ability to get there raw ingredients cheaper, resume hiring processes, etc.
The slow creeping rise in Inflation has the Federal Reserve in a position to want to be ready to potentially Hike Rates when the Inflation, they believe, from the Tariffs will hit but as of yet, the recent CPI numbers came out not as hot as they thought, possibly playing into the reason for making the latest cut.
Nevertheless, by the last FOMC meeting, it would seem that there is a chance that was the last cut this year that may be made, if:
- Inflation continues to rise
or
- Continued softening labor market

EUR/USD: Classic Breakout Trade - Don't Miss the Move!The 📉EURUSD pair experienced a decisive breakout and closed below a significant daily/intraday horizontal support cluster on Friday.
Following this breakout, the pair started to consolidate on an hourly timeframe, on the previously breached structure.
The bearish violation of this consolidation serves as a strong bearish confirmation.
Conversely, the price is projected to continue its downward trajectory, with a likely target of at least 1.1500.
