Stop!Loss|Market View: SILVER🙌 Stop!Loss team welcomes you❗️
In this post, we're going to talk about the near-term outlook for SILVER ☝️
Potential trade setup:
🔔Entry level: 50.07771
💰TP: 45.90144
⛔️SL: 51.62853
"Market View" - a brief analysis of trading instruments, covering the most important aspects of the FOREX market.
👇 In the comments 👇 you can type the trading instrument you'd like to analyze, and we'll talk about it in our next posts.
💬 Description: As noted earlier regarding gold, despite the aggressive short-term strengthening of metals, medium- and long-term selling pressure remains. Both gold and silver are trading near key resistance levels, indicating a potential reversal. A further approach to 52 is not ruled out for silver, so shorter-term selling is looked for if the price approaches 50, and it's best to wait for the price to close below 50.
Thanks for your support 🚀
Profits for all ✅
❗️ Updates on this idea can be found below 👇
DXY

Moon Boys don't want you to see this Bitcoin/Gold chart !Hi Guys,
We have a massive head & shoulders on the Bitcoin / Gold chart that almost nobody talks about! With all the major players being openly bullish on Bitcoin and while everyone is waiting for the AI bubble to burst ..Bitcoin will be the first one to react considering how easy it can be sold and how volatile it usually is.
The charts don't lie and all markets are clearly at the top so protect you capital at all cost while you still can.
Let me know what do you guys think about this.

Gold Testing H4 Supply – Eyes on Retrace SetupAfter a clean bullish expansion last week, Gold is now testing a 4H bearish FVG around 4,200–4,240. Price is currently holding below the day’s open (4,203), suggesting potential short-term weakness.
If we stay below 4,203, I’ll look for a corrective move toward the 4H bullish FVG just below the previous day’s low (around 4,060–4,090).
Above 4,220, the bullish continuation remains valid.
Currently in observation mode — waiting for intraday confirmation before engaging any short bias.

GBP/USD | Pound Drops 100 Pips – More Downside Ahead?By analyzing the GBP/USD chart on the 1-hour timeframe, we can see that, as expected, the price started to drop and fell by 100 pips, reaching 1.30845. With the U.S. Dollar Index (DXY) gaining strength, I expect further downside movement for GBP/USD in the short term. Keep an eye on the 1.30670 level for a potential price reaction.
Please support me with your likes and comments to motivate me to share more analysis with you and share your opinion about the possible trend of this chart with me !
Best Regards , Arman Shaban

DXY: Is it going to break the 100 level or not?Fundamental approach:
- The US Dollar Index (DXY) traded sideways this week amid stronger global risk sentiment and fading demand for safe-haven assets. The continued US government shutdown delayed key data releases.
- At the same time, the ISM Services PMI rose to an eight-month high, and the ADP report showed stronger-than-expected private job gains, supporting a cautious Fed outlook on further rate cuts. Nevertheless, weak consumer sentiment and rising weekly jobless claims reinforced downside pressure on the dollar index.
- Underlying drivers this week included mixed US data, with upbeat labor and service sector figures contrasting with deteriorating consumer and business sentiment. Investors trimmed bets on imminent Fed rate cuts.
- Looking forward, the DXY may remain heavy as long as safe-haven demand stays muted and official US data is delayed due to the shutdown.
Technical approach:
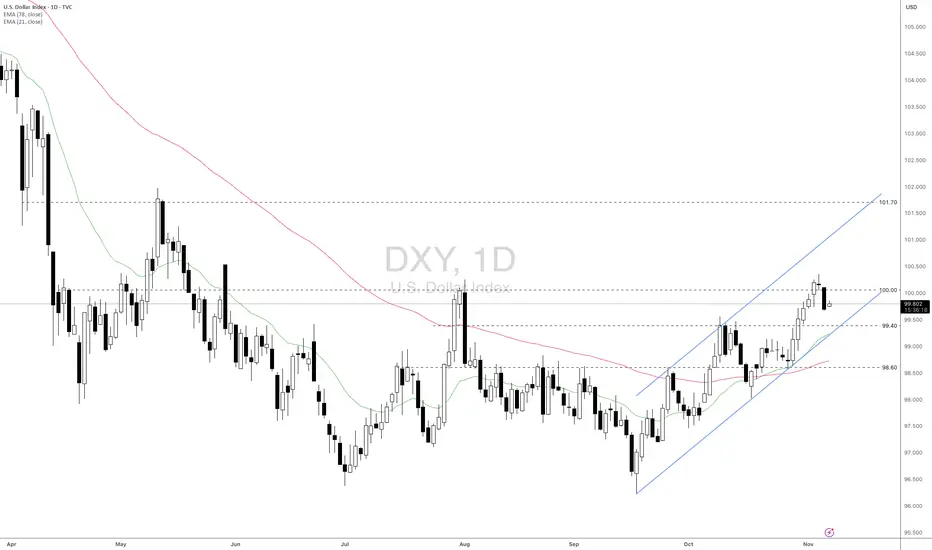
- DXY retested the psychological level at around 100 and rejected. The price is above both EMAs, indicating upward momentum is still intact.
-If DXY remains below 100, the price may retest the following support at 99.40, which is confluenced with the lower bound of the ascending channel.
- Conversely, breaching above 100 may prompt a conviction to retest the next resistance at 101.70.
Analysis by: Dat Tong, Senior Financial Markets Strategist at Exness
DXY (Dollar Index) Daily Outlook (Count 3)This is a daily timeframe outlook of the TVC:DXY . This is in alignment with my previously posted weekly outlook and is a slight alteration of the last posted Daily outlook, both shown in the related publications area.
In this update I am looking for the DXY to continue lower potentially in an ending diagonal pattern towards the red and yellow target zones at around 93.8. As mentioned on the chart, if we see price decline in a traditional impulse with no overlap between wave 4 and 1 then the measured move target will be surpassed.
I have a short trade shown on the DXY chart but this is only indicative of the move I expect, I am instead long FX:EURUSD which moves inversely to the DXY. More comments on the chart.

The dollar softens as weak data boosts Fed rate-cut expectations
According to ADP data, US companies laid off an average of 11,250 employees per week in October, reaffirming how quickly labor market conditions have softened over the past two weeks.
Meanwhile, the NFIB Small Business Optimism Index fell for a second straight month to 98.2 (prev. 98.9, cons. 98.3), marking the lowest level since April’s reciprocal tariff announcement. The NFIB noted that the government shutdown and tariffs have weighed on business sales.
The dollar may stay range-bound, awaiting fresh price catalysts between hopes for a shutdown resolution and further Fed rate cuts.
DXY briefly tested the ascending channel's lower bound before rebounding slightly. The index remains between both EMAs, suggesting a potential extension of the consolidation trend.
If DXY closes above EMA21, the index may advance toward the following resistance at 99.80.
Conversely, if DXY breaks below EMA78 and the support at 99.50, the price could fall below the channel’s lower bound.

Breakout Confirmed – Watching for 4H FVG RebalanceAfter a full week of sideways chop, Gold finally broke structure on Monday with a strong bullish impulse. The breakout clears the 7-day range and confirms higher-timeframe bullish intent.
I’m now watching the 4H FVG sitting just below the previous day’s low — that’s where I’d like to see price rebalance before continuing the next leg higher.
If price respects that zone and holds structure, it could mark the start of a sustained bullish push for the week.
Bias stays bullish unless price breaks back below the H4 FVG or fails to hold the weekly open.

USD/CHF - Trendline Rejection (10.11.2025)📊 Setup Overview : FX:USDCHF
USD/CHF continues to respect the descending trendline and Ichimoku cloud resistance, signaling potential downside pressure. Price is currently retesting the resistance zone (0.8070–0.8085) — a strong supply area that has rejected multiple times.As long as this zone holds, we expect a move toward the next support zones.
🧭 Trade Plan
Bias: 🔻 Sell / Short-term Bearish
Entry Zone: 0.8060 – 0.8080 (wait for confirmation candle or rejection)
Target 1 (1st Support): 0.8015
Target 2 (2nd Support): 0.7995
Invalidation: Break and close above 0.8085 (Resistance Zone)
⚡ Fundamental Updates
1️⃣ U.S. Treasury yields eased slightly as consumer confidence declined.
2️⃣ Markets now price a 66% chance of a rate cut in December, according to CME’s FedWatch Tool.
3️⃣ U.S. government shutdown concerns keep the dollar under mild pressure as investors watch debt issuance risk.
💬 Summary
A clear trendline rejection combined with fundamental USD weakness supports a short bias.
Wait for confirmation before entering — patience protects capital.
⚠️ Disclaimer
This analysis is for educational purposes only and not financial advice.
Always do your own research and manage risk wisely.
📢 Support My Work
💚 Like, Comment & Share this idea to motivate more chart updates!
🧠 “Charts Don’t Lie, Traders Don’t Quit.”
#USDCHF #ForexAnalysis #TradingView #PriceAction #Trendline #Ichimoku #TechnicalAnalysis #ForexTrader #Fundamentals #SwingTrading #KABHI_TA_TRADING

DXYU.S Dollar Index
- Bullish Channel as an corrective pattern in Long Time Frame
- Break of Structure
- Completed " 1234 " Impulsive Waves
- Fibonacci Level - 23.60%
- Demand Zone

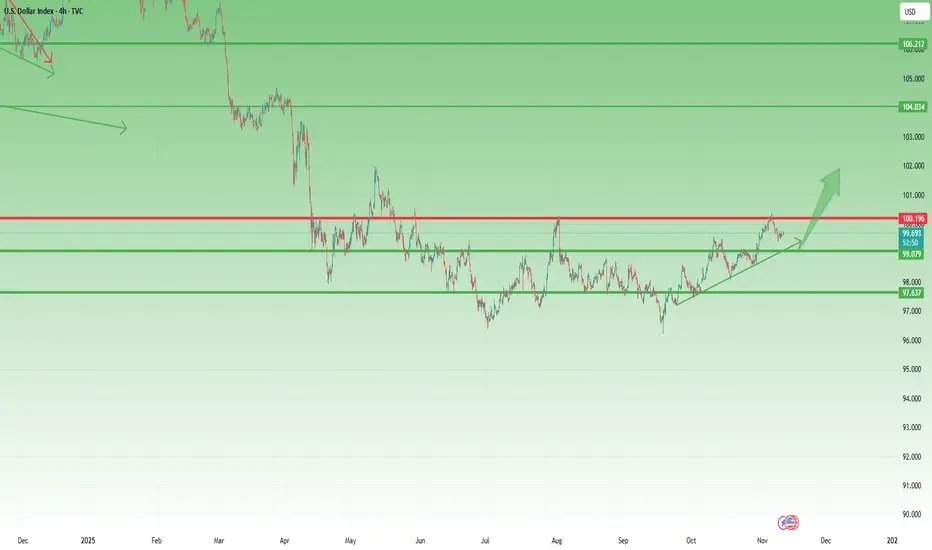
DXY Pulls Back from 100 – A Healthy Correction, Not a Reversal1. What Happened Since Last Week
In last week’s DXY analysis, I warned that although the U.S. Dollar Index remains in a broader uptrend, the 100.00 level represents both a strong technical and psychological resistance that could trigger a short-term retracement.
That scenario played out almost perfectly — after a brief spike above 100, DXY rolled over and is now trading near 99.70.
2. Market Context
The pullback so far looks orderly, not impulsive, suggesting that this move is a correction within an ongoing bullish structure, rather than the start of a major reversal. The market is simply digesting gains after a move higher.
3. Technical Outlook
The area between 99.00 and 99.20 stands out as a key confluence support zone, combining horizontal structure with the up trend line. This is where I expect buyers to reemerge if the index continues to drift lower.
4. Trading Plan
If DXY dips into 99.00–99.20, I’ll look for signs of USD strength resuming — specifically by considering short setups on GBP/USD and EUR/USD.
5. Conclusion
The dollar remains in an uptrend, and this pullback appears to be healthy, not bearish. As long as DXY holds above 99.00, the broader bullish bias remains intact, and traders should prepare for a possible rebound in the next sessions. 💵
DXY FRGNT Daily Forecast -Q4 | W46 | D11 | Y25 |📅 Q4 | W46 | D11 | Y25 |
📊 DXY FRGNT Daily Forecast
🔍 Analysis Approach:
I’m applying Smart Money Concepts, focusing on:
Identifying Points of Interest on the Higher Time Frames (HTFs) 🕰️
Using those POIs to define a clear trading range 📐
Refining those zones on Lower Time Frames (LTFs) 🔎
Waiting for a Break of Structure (BoS) for confirmation ✅
This method allows me to stay precise, disciplined, and aligned with the market narrative, rather than chasing price.
💡 My Motto:
"Capital management, discipline, and consistency in your trading edge."
A positive risk-to-reward ratio, paired with a high win rate, is the backbone of any solid trading plan 📈🔐
⚠️ Losses?
They’re part of the mathematical game of trading 🎲
They don’t define you — they’re necessary, they happen, and we move forward 📊➡️
🙏 I appreciate you taking the time to review my Daily Forecast.
Stay sharp, stay consistent, and protect your capital
— FRNGT 🚀
TVC:DXY

Bullish bounce off 50% FIbonacci support?Dollar Index (DXY) has bounced off the pivot and could rise to the 1st resistance, which acts as a swing high resistance.
Pivot: 99.41
1st Support: 99.13
1st Resistance: 100.29
Disclaimer:
The above opinions given constitute general market commentary, and do not constitute the opinion or advice of IC Markets or any form of personal or investment advice.
Any opinions, news, research, analyses, prices, other information, or links to third-party sites contained on this website are provided on an "as-is" basis, are intended only to be informative, is not an advice nor a recommendation, nor research, or a record of our trading prices, or an offer of, or solicitation for a transaction in any financial instrument and thus should not be treated as such. The information provided does not involve any specific investment objectives, financial situation and needs of any specific person who may receive it. Please be aware, that past performance is not a reliable indicator of future performance and/or results. Past Performance or Forward-looking scenarios based upon the reasonable beliefs of the third-party provider are not a guarantee of future performance. Actual results may differ materially from those anticipated in forward-looking or past performance statements. IC Markets makes no representation or warranty and assumes no liability as to the accuracy or completeness of the information provided, nor any loss arising from any investment based on a recommendation, forecast or any information supplied by any third-party.

Stop!Loss|Market View: GOLD🙌 Stop!Loss team welcomes you❗️
In this post, we're going to talk about the near-term outlook for GOLD ☝️
Potential trade setup:
🔔Entry level: 4122.884
💰TP: 3895.119
⛔️SL: 4246.000
"Market View" - a brief analysis of trading instruments, covering the most important aspects of the FOREX market.
👇 In the comments 👇 you can type the trading instrument you'd like to analyze, and we'll talk about it in our next posts.
💬 Description: According to our previous review of this metal, the price is moving according to an alternative scenario, namely, a retest of the 4150-4200 range. Currently, short-term selling is being actively looked for, and the medium-term mood remains focused on levels of 3600-3700. We can expect additional manipulation/a slight move toward 4200 in the near future, but it's not a certain thing that we'll reach this round level, and we could reverse earlier.
Thanks for your support 🚀
Profits for all ✅
❗️ Updates on this idea can be found below 👇

Stop!Loss|Market View: EURUSD🙌 Stop!Loss team welcomes you❗️
In this post, we're going to talk about the near-term outlook for the EURUSD currency pair☝️
Potential trade setup:
🔔Entry level: 1.15351
💰TP: 1.14184
⛔️SL: 1.15903
"Market View" - a brief analysis of trading instruments, covering the most important aspects of the FOREX market.
👇 In the comments 👇 you can type the trading instrument you'd like to analyze, and we'll talk about it in our next posts.
💬 Description: The euro price has returned to the 1.15500 - 1.16000 range, which is now acting as resistance. Selling trades can be actively looked for from this area, especially within the medium-term downward movement of this pair. The focus is on a breakout of the lower border of 1.15500 and a father move toward 1.14000.
Thanks for your support 🚀
Profits for all ✅
❗️ Updates on this idea can be found below 👇

EURUSD Analysis: The Battle for 1.1550 - A Trader's DispatchEURUSD Intraday Analysis: The Battle for 1.1550 - A Trader's Dispatch
November 11, 2025 - 8:25 AM UTC+4
MARKET NARRATIVE:
The EURUSD is currently caught in a technical vortex around the pivotal 1.1556 level. While the dominant trend remains bearish, dictated by a descending channel visible on the 4-hour chart, the price action is showing signs of indecision. This suggests a classic standoff between sellers capitalizing on the trend and buyers defending a historical support zone. This report dissects the structure to identify high-probability intraday setups.
STRUCTURAL ANALYSIS & KEY INDICATIONS:
Dow Theory & Trend: The primary trend is undeniably bearish, with a consistent pattern of lower highs and lower lows. The current price is hovering near the lower boundary of the descending channel, a make-or-break point.
Wyckoff Perspective: The recent price action within the 1.1550-1.1600 range hints at a potential accumulation phase . A spring below 1.1550 that quickly reverses would be a strong bullish signal. Conversely, a failure to rally and a breakdown would confirm a redistribution phase.
Indicator Snapshot:
RSI (14): The RSI on the 1H and 4H charts is lingering near oversold territory but without a strong bullish divergence yet, suggesting bearish momentum is still present.
Ichimoku Cloud: Price is trading well below the cloud on the 4H timeframe, confirming a strong bearish bias. The Kijun-sen is acting as dynamic resistance.
VWAP: The intraday VWAP is currently above the price, indicating that the average trader today is at a loss on long positions, which could add to selling pressure.
INTRADAY STRATEGIC BLUEPRINT:
Bearish Continuation Scenario (High Probability):
A decisive break and close below the support at 1.1540 would signal a continuation of the downtrend, likely targeting lower liquidity levels.
Entry (Sell): 1.1535 (On a confirmed break of support)
Stop Loss: 1.1575 (Above the recent consolidation zone)
Take Profit 1: 1.1480
Take Profit 2: 1.1450
Bullish Reversal Scenario (Lower Probability):
This scenario hinges on a defense of the 1.1550 support, potentially forming a Double Bottom pattern or a Wyckoff spring. A break above the immediate resistance and the descending trendline is required for confirmation.
Entry (Buy): 1.1595 (On a break of near-term resistance)
Stop Loss: 1.1545 (Below the recent low)
Take Profit 1: 1.1650
Take Profit 2: 1.1700
Concluding Thought:
While the path of least resistance appears to be to the downside, trading near strong support levels requires caution. A failed breakdown could offer a powerful reversal opportunity. Always trade with a defined risk management plan.

EURUSD AUDUSD GBPUSD DXY FRGNT Weekly Full Breakdown-Q4 | W46 | 📅 Q4 | W46 | Y25 |
📊 EURUSD AUDUSD GBPUSD DXY FRGNT Weekly Full Breakdown
🔍 Analysis Approach:
I’m applying Smart Money Concepts, focusing on:
Identifying Points of Interest on the Higher Time Frames (HTFs) 🕰️
Using those POIs to define a clear trading range 📐
Refining those zones on Lower Time Frames (LTFs) 🔎
Waiting for a Break of Structure (BoS) for confirmation ✅
This method allows me to stay precise, disciplined, and aligned with the market narrative, rather than chasing price.
💡 My Motto:
"Capital management, discipline, and consistency in your trading edge."
A positive risk-to-reward ratio, paired with a high win rate, is the backbone of any solid trading plan 📈🔐
⚠️ Losses?
They’re part of the mathematical game of trading 🎲
They don’t define you — they’re necessary, they happen, and we move forward 📊➡️
🙏 I appreciate you taking the time to review my Daily Forecast.
Stay sharp, stay consistent, and protect your capital
— FRNGT 🚀

EUR/USD Is Indecisive ?EUR/USD is trading with a bearish overall market structure on the 1-hour timeframe, currently below the key 1.1600 level. The pair is consolidating near resistance, with technical signals pointing to potential downside continuation unless new bullish catalysts emerge.
Technical Market Structure
Recent price rallied off the November low, with the current session showing consolidation just below resistance around 1.1565–1.1610.
Key support levels to watch are 1.1538 (recent H1 swing low), 1.1520, and 1.1460. A break below these could accelerate a move towards 1.1405.
The moving averages on the chart show a crossover pattern, suggesting short-term bullish exhaustion and possible transition back to bearish momentum.
Short-term corrective moves are possible up to 1.1590–1.1610, but rejection here could favor another wave down.
Elliott Wave and price envelope analysis forecast consolidation or short-lived correction followed by decline toward 1.1450 or lower.
Fundamental Analysis
Fed rate cut bets are driving market dynamics. The FOMC lowered rates by 25 basis points at the last meeting, and although another cut in December is possible, the decision is split among policymakers, causing uncertainty.
Recent weak U.S. labor data and political gridlock are weighing on the dollar, supporting euro strength in the very short term.
ECB policymakers are signaling steady rates, with limited downside for the euro and potential for euro strength over the coming months if the Fed enters a rate-cutting cycle.
Upbeat Eurozone data (ZEW sentiment, GDP, investor confidence) due this week could boost EUR/USD, but bearish risk remains if Fed rate cut expectations fade or U.S. macro data improves.
Potential Daily Movement
Bias leans bearish for the day unless EUR/USD can break and hold above 1.1590–1.1610, which could open upside to 1.1700.
Downside targets for further weakness include 1.1530, then 1.1460, and potentially 1.1405 if support fails.
In the event of renewed risk-on sentiment from U.S. shutdown resolution or positive Euro data, a push to the next resistance zone (1.1610–1.1690) is possible, but strong sellers remain active at these levels.
Key Levels Table
Zone Level Action
Resistance 1.1590–1.1610 Sell/reject if fails
Resistance 1.1690–1.1770 Strong sellers above
Support 1.1530–1.1460 Watch for breaks down
Support 1.1405 Bearish extension zone
Upside Target 1.1700+ Bullish if breakout
Overall, expect choppy intraday price action with a bearish tilt unless external fundamentals force a decisive bullish breakout above 1.1610 resistance.

DXY — Range Structure HoldsThe US Dollar Index (DXY) started the week trading just below a bearish distribution fractal low at 99.321. Price holds inside a short-term bearish range between 99.000 (low) and 99.500 (high) while still operating within the broader daily bullish structure. DXY is currently moving through the daily imbalance cap near 99.035, sitting in the premium zone — compression remains active as larger participants stay patient. Market Structure Mapping (MSM) shows price tightening in that upper zone — the calm before the bigger players step in.
Market Structure Mapping (MSM) shows price pressing into the daily imbalance high near 99.035, lining up with the range-low fractal around 99.032. That’s the lower edge of Monday’s structure — tight, clean, and holding steady. Volume Flow Analytics (VFA) points to order-flow absorption — buyers keep hitting the tape, but liquidity keeps taking the other side.
It’s that slow-burn type of session where participation fades and bigger players quietly build positions under the surface. If that pattern holds, price could drift back toward the discount area once participation increases.
No rush — London already had its short trade this morning.
Now it’s just about waiting for confirmed order flow before taking the next setup.
The dollar’s steady as Washington works on a funding deal to end the government shutdown, calming market nerves.
Ten-year Treasury yields hover just above 4.1 %, keeping a floor under USD as investors still get paid to hold dollars.
Inflation’s sitting near 3 %, growth data is mixed, and delayed reports mean traders are reacting more to headlines than numbers.
For now, yields and improving political tone offer support — but it’s not bulletproof.
If debt or growth headlines turn sour again, that support can fade fast.
🦅 CORE5 RULE:
Slow days build strong traders. Wait for the flow, not the noise.
— CORE5DAN
Institutional Logic. Modern Technology. Real Freedom.

EURUSD - Look for Short (SWING) 1:8!Price has formed a clear reversal pattern on the higher timeframe, suggesting a major correction phase that may sweep all order blocks within the weekly zone before resuming its move to the downside.
This aligns with DXY, which recently broke its nearest resistance and is now in a corrective phase before potentially continuing its bullish momentum.
Possibly fueled by upcoming news. Let’s see how it unfolds.
Disclaimer:
This is simply my personal technical analysis, and you're free to consider it as a reference or disregard it. No obligation! Emphasizing the importance of proper risk management—it can make a significant difference. Wishing you a successful and happy trading experience!

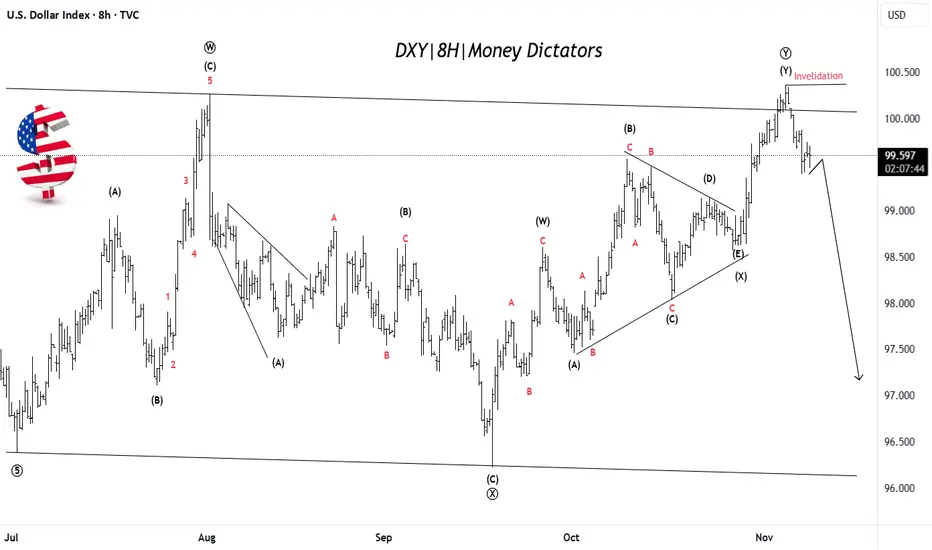
US Dollar Weakness Likely After Final Push UpDXY has completed a complex corrective W–X–Y pattern, with the final leg (Y) recently topping near the 100.50 zone. Price has failed to break above the invalidation level, suggesting the uptrend is losing strength. This signals that the dollar may have finished its corrective phase and could now start a fresh bearish wave targeting lower zones near 97–98. The overall structure indicates that momentum is shifting from bullish to bearish. In simple terms: rally is likely over → downside move toward new lows expected next.
Stay tuned!
@Money_Dictators
Thank you :)
AUDUSD Intraday Technical Analysis - 10 Nov 2025AUDUSD Intraday Technical Analysis - 10 Nov 2025
Australian Dollar/US Dollar at 0.65320 (3:40 PM UTC+4) — consolidation breakout imminent.
📌 Market Context: Wyckoff Phase D accumulation post-August correction; Dow Theory secondary uptrend forming; Gann Square-of-9 targets 0.6580/0.6480.
🗺️ Multi-Timeframe Pulse:
1D: Inverted head-and-shoulders pattern neckline at 0.6500; RSI 55 (neutral); Ichimoku cloud support 0.6420; bullish reversal signal forming.
4H: Rising channel 0.6480-0.6580; EMA21>EMA50 (golden cross); VWAP from Sept 20 = 0.6510 (support level).
1H: Cup-and-handle breakout attempt from 0.6480 base; BB midline 0.6520; VWAP slope neutral-bullish.
30M: Symmetrical triangle 0.6500-0.6560; hidden bull divergence on RSI; volume contracting.
15M: Bull flag over 0.6510; Tenkan>Kijun bullish alignment; stochastic RSI ready for extension.
5M: Falling wedge retest 0.6500; hammer candlestick signals intraday demand; false breakout risk above 0.6560.
🎯 PRIMARY LONG SETUP
Entry: 0.6510-0.6525 (triangle support + VWAP) — confirm on 15M bullish close >0.6535.
Stop Loss: 0.6485 (below triangle base).
Target 1: 0.6555 (+35 pips).
Target 2: 0.6580 (+60 pips — channel top).
Target 3: 0.6620 (+100 pips — harmonic extension).
Confirmation: RSI>55, volume +20%, VWAP support holding.
⚡ MOMENTUM ADD: Scale above 0.6580 ONLY if RSI>65 + volume surge; trail stop to 0.6560.
🔻 REVERSAL SHORT SETUP
Entry: 0.6600-0.6625 (supply zone) — trigger on bearish engulfing + RSI divergence.
Stop Loss: 0.6650 (above channel resistance).
Targets: 0.6560 → 0.6520 → 0.6480 (Gann support).
Confirmation: 5M/15M RSI bearish divergence; BB upper band rejection.
🚨 BREAKOUT PROTOCOL:
BULL: 1H close >0.6580 confirms H&S breakout; target 0.6700; move stop to BE+15.
BEAR: 1H close <0.6500 with volume expansion triggers retest of 0.6420 cloud support.
📊 INDICATOR SNAPSHOT: BB squeeze (30M) tightening; MACD histogram positive; VWAP slope neutral-up; EMA21 acting as trigger line on 1H.
⚠️ PATTERN ALERTS: Harmonic bat PRZ at 0.6600; H&S neckline breakout >0.6500 = trend confirmation; channel failure <0.6510 = Wyckoff spring risk.
📈 TIMING & RISK: RBA decision watch; Gann 90° cycle 20:00 UTC; expect 0.80% intraday range. Risk ≤1% per setup; avoid chasing; lock gains at TP1.
Educational analysis only. Trade with your plan, manage risk, adapt to live price action.

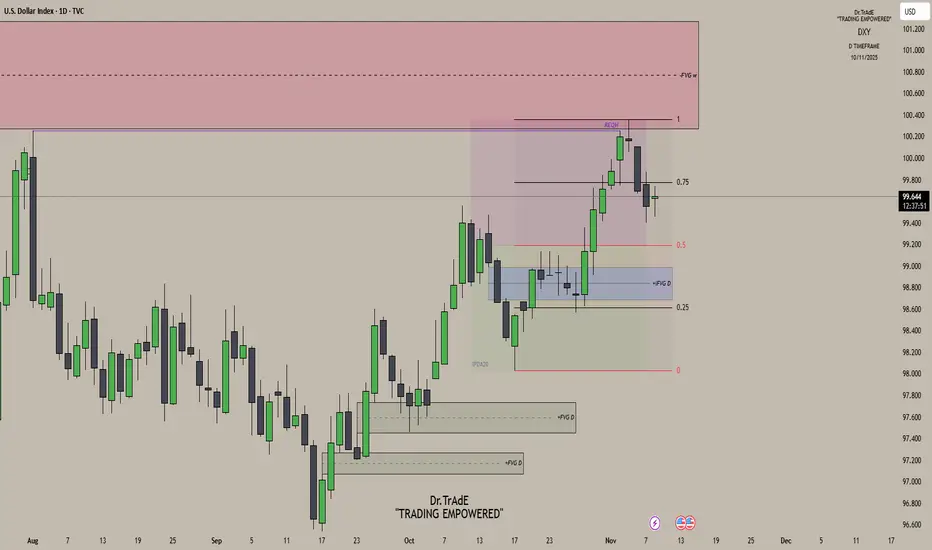
DXY Daily AnalysisLast Week’s Review:
Monday: Bullish delivery as price continued higher.
Tuesday: Price maintained bullish momentum but failed to take out the previous high, leaving equal highs — liquidity resting above.
Wednesday: That liquidity was swept as price reached into the weekly fair value gap, completing delivery to the premium array and initiating bearish distribution.
Current Outlook:
On the daily chart, we’re still trading deep inside premium, and price is showing clear signs of exhaustion after that delivery into the weekly FVG. With bearish distribution now in play, my bias remains bearish. Any short-term push back into the 0.75 quadrant, I’ll treat as a retracement — a chance for price to reprice some lower-timeframe inefficiencies before the next leg lower. On the 4H chart, I’ll be watching for price to trade back into short-term FVGs or inefficiencies that align with this overall bearish narrative.