A 30-Minute Look at USDJPY AnalysisHello friends,
I have prepared my USDJPY analysis for you.
In this analysis, I plan to open a buy position between the 154.003 and 153.831 levels, aiming for the 154.453 level.
This analysis has been carried out on the 30-minute timeframe.
Once my target is reached, I will share the updates with you here.
Friends, every single like from you is the greatest source of motivation for me to continue sharing these analyses.
I sincerely thank everyone who supports me with their appreciation.
With respect and love.
DXY

Bullish momentum set to continue?The US Dollar Index (DXY) is falling towards the pivot, which is a pullback suport and could bounce to the 1st resistance.
Pivot: 99.53
1st Support: 98.55
1st Resistance: 101.46
Disclaimer:
The above opinions given constitute general market commentary, and do not constitute the opinion or advice of IC Markets or any form of personal or investment advice.
Any opinions, news, research, analyses, prices, other information, or links to third-party sites contained on this website are provided on an "as-is" basis, are intended only to be informative, is not an advice nor a recommendation, nor research, or a record of our trading prices, or an offer of, or solicitation for a transaction in any financial instrument and thus should not be treated as such. The information provided does not involve any specific investment objectives, financial situation and needs of any specific person who may receive it. Please be aware, that past performance is not a reliable indicator of future performance and/or results. Past Performance or Forward-looking scenarios based upon the reasonable beliefs of the third-party provider are not a guarantee of future performance. Actual results may differ materially from those anticipated in forward-looking or past performance statements. IC Markets makes no representation or warranty and assumes no liability as to the accuracy or completeness of the information provided, nor any loss arising from any investment based on a recommendation, forecast or any information supplied by any third-party.

USD Index, AUD/USD Hint at Near Term ReversalsAs outlined in last week’s video, I suspect the US dollar may have the potential to break higher as part of its wave C before momentum realigns with its dominant bearish trend. However, Monday’s shooting star candle just below 100, coupled with an overbought RSI (2), warns of a potential pullback ahead of any breakout.
Also note that AUD/USD has formed a spinning top doji near the September low, suggesting that bearish momentum is waning despite closing lower for a fourth consecutive day.
With the RBA likely to deliver a hawkish tone when they hold rates today, there’s potential for a short-term bounce in the Australian dollar. However, if I’m right in expecting an eventual bullish breakout in the US dollar index, I’ll also be watching for evidence of a swing high on AUD/USD once that anticipated bounce is delivered.
Matt Simpson, Market Analyst at City Index

EURUSD: Liquidity Grab @ 1.15000EURUSD has experienced a liquidity grab as price closed below the previous low and is heading towards 1.15. CRT suggest price could go lower and wick below the previous candle or even drop further.
Alongside 1.15, there is an imbalance, which price could tap into and possibly fill, both EURUSD and GBPUSD has some divergence so it will be interesting to see how it plays out

GBPUSD: Liquidity Grab off 1.31000CRT suggests Pound/Dollar could drop further below 1.31000, however, is there enough bearish momentum to keep it dropping? With wicks to the bottom that Liquidity Grab could experience a pullback, maybe back towards the POI it created whilst dropping.

DXY Has 99 Problems, Getting Above 100 Is One!Here we have TVC:DXY on the Weekly Chart.
Now clearly outlined we can see there is a very valuable level here @ 99-100 that the USD:
- Used as Resistance from 2015 til the Bullish Breakout in April 2020
- Used as Support from 2023 til the Bearish Breakdown in April 2025
Fundamentally is a very sketchy scenario because with the Shutdown causing lack of important data needed, The Federal Reserve is making Interest Rate cuts. This weakens the Dollar because it makes it less favorable to Foreign Investing.
On the flip side, Consumers Dollars are able to stretch further allowing them to purchase more but unfortunately we still combat the inflated prices on goods. Companies have the ability to get there raw ingredients cheaper, resume hiring processes, etc.
The slow creeping rise in Inflation has the Federal Reserve in a position to want to be ready to potentially Hike Rates when the Inflation, they believe, from the Tariffs will hit but as of yet, the recent CPI numbers came out not as hot as they thought, possibly playing into the reason for making the latest cut.
Nevertheless, by the last FOMC meeting, it would seem that there is a chance that was the last cut this year that may be made, if:
- Inflation continues to rise
or
- Continued softening labor market

EUR/USD: Classic Breakout Trade - Don't Miss the Move!The 📉EURUSD pair experienced a decisive breakout and closed below a significant daily/intraday horizontal support cluster on Friday.
Following this breakout, the pair started to consolidate on an hourly timeframe, on the previously breached structure.
The bearish violation of this consolidation serves as a strong bearish confirmation.
Conversely, the price is projected to continue its downward trajectory, with a likely target of at least 1.1500.

Dollar Index (DXY): Confirmed BoS
Dollar Index keeps following our plan.
The market closed on Friday, breaking a previous local high
and setting a new higher high higher close with a confirmed BoS.
We can expect more growth and a highly probable test of 100.0 level soon.
❤️Please, support my work with like, thank you!❤️
I am part of Trade Nation's Influencer program and receive a monthly fee for using their TradingView charts in my analysis.

DXYU.S Dollar Index
- Completed " 12345 " Impulsive Waves
- Break of Structure
- Bullish Channel as an corrective pattern in Long Time Frame
- Order Block
- RSI - Divergence

DXY Analysis — Bulls at 100: Continuation or Correction?In my latest DXY analyses, I mentioned that the index could reverse and push higher, with the 100 figure acting as a key zone to watch for bulls.
Indeed, on Friday the index climbed right into this area and is now showing signs of minor consolidation.
The key question now:
👉 Will the DXY manage to continue above this critical level, or is it time for a pause?
In my view, a correction is looming for the index. Even if we see a short-term spike above 100, I expect it to be unsustainable.
For the near future, DXY could remain in a range-trading environment, with 100 as resistance and 97.50 as support.

DXY FRGNT Daily Forecast -Q4 | W45 | D3| Y25 |📅 Q4 | W45 | D3| Y25 |
📊 DXY FRGNT Daily Forecast
🔍 Analysis Approach:
I’m applying Smart Money Concepts, focusing on:
Identifying Points of Interest on the Higher Time Frames (HTFs) 🕰️
Using those POIs to define a clear trading range 📐
Refining those zones on Lower Time Frames (LTFs) 🔎
Waiting for a Break of Structure (BoS) for confirmation ✅
This method allows me to stay precise, disciplined, and aligned with the market narrative, rather than chasing price.
💡 My Motto:
"Capital management, discipline, and consistency in your trading edge."
A positive risk-to-reward ratio, paired with a high win rate, is the backbone of any solid trading plan 📈🔐
⚠️ Losses?
They’re part of the mathematical game of trading 🎲
They don’t define you — they’re necessary, they happen, and we move forward 📊➡️
🙏 I appreciate you taking the time to review my Daily Forecast.
Stay sharp, stay consistent, and protect your capital
— FRNGT 🚀
TVC:DXY


Gold Futures (MGCZ2025) — Weekly FVG Magnet & Potential ReversalPrice has been respecting Standard Deviation levels beautifully across the H4, Daily, and Weekly timeframes. The market recently rejected the H4 FVG and is now hovering mid-range, with a Weekly Fair Value Gap left open below.
This imbalance could attract price early in the week, creating a liquidity grab and possible weekly low before Gold flips bullish again.
Key Levels:
🟤 H4 FVG rejection zone: 4,040 – 4,080
🔵 Weekly FVG target: 3,880 – 3,900
⚫ Weekly High: 4,124
⚫ Weekly Low: 3,901
Narrative:
I’m expecting price to push into the Weekly FVG discount zone early in the week — potentially aligning with high-impact financial news — and then reverse bullish for a mid-week or end-of-week rally.
Watch For:
Price displacement or BOS near the Weekly FVG
Killzone reactions (London & NY)
Volume and order flow confirmation before entering
Bias: Short-term bearish → medium-term bullish
Invalidation: Sustained trade below 3,842 (Weekly Lows & -1σ zone breach)

Gold | Oil | Dollar | Silver | Natural Gas Price ForecastGold | Oil | Dollar | Silver | Natural Gas Price Forecast
NYMEX:NG1! COMEX:GC1! COMEX:SI1! AMEX:UNG

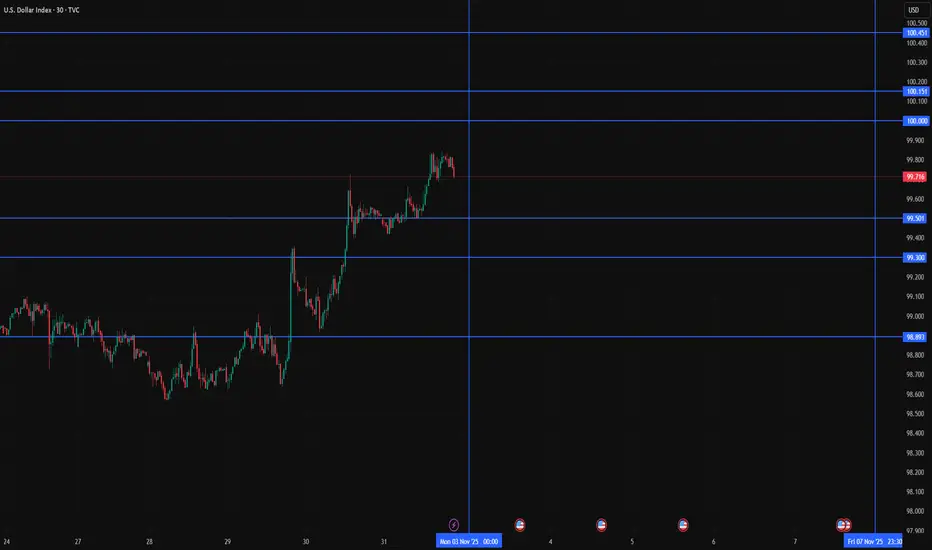
DXY Daily Map for 3 to 7 November 2025What this is
A clean, event aware plan for the Dollar Index for the week ahead. We start the week with DXY holding the ninety nine handle and sitting just below the round one hundred line. The location is the story. Round numbers compress behavior. If you pre mark the right shelves and then trade the reaction to data and auction tone, you can avoid most of the week’s traps while still catching the meaningful moves.
Chart setup
Use TVC:DXY on the daily and one hour. Keep the chart clean. Draw only the bands you will act on.
• 100.00 round number
• 100.15 to 100.45 first resistance band
• 100.50 to 101.00 second resistance band
• 99.50 to 99.30 first support shelf
• 98.90 to 98.60 second support shelf
• 98.20 daily defense line
Add a fifteen minute ATR for sizing. No other overlays. You do not need them.
Why this week matters
The heaviest flow sits midweek when private labor gauges, services surveys, and refunding headlines can all hit inside a tight window. On Thursday the Bank of England adds a cross current through GBP and EUR which together carry real weight inside DXY. You do not have to predict any of these. You only need to decide what you will do if price reaches your bands with momentum or with rejection.
How to read the round number
One hundred is not a signal. It is a liquidity pocket. The first touch after a period below tends to be noisy because participants with different time frames meet there. The more disciplined path is to let the first touch play out, then trade the second decision. If a fifteen minute close accepts above 100.20 and pullbacks hold, you have confirmation to work the first band. If the first test spikes and fails, the wick itself gives you a clear invalidation for a fade back toward 99.50.
Scenarios to plan for
Acceptance above the first band
Price pushes through 100.15 and holds above 100.20 on a fifteen minute close after firm services or a solid tone in rates. The plan is to buy the first clean retest of 100.20 with a stop a few ticks below the retest low. First target 100.45. Second target 100.80 to 101.00 if the tape stays orderly. Trail only after the first target prints.
Rejection at the first band
A sharp wick into 100.15 to 100.45 that fails within the first five to ten minutes after headlines is often the highest quality fade of the week. Short into the rejection with a stop above 100.55. Take partials into 99.80 and again into 99.50. If 99.50 loses on a fifteen minute close, hold a runner for 99.30.
Breakdown through support
If 99.50 to 99.30 gives way without a clear catalyst, do not chase the first break. Wait for a back test that fails. Then target 98.90 to 98.60 with small size. This environment rewards patience because air pockets near round numbers can retrace quickly.
Cross current from the Bank of England
If the press conference lifts GBP and EUR, DXY can slide even if U.S. data is mixed. In that case the plan is simple. Respect your support shelves. Do not fight a broad based dollar selloff at support unless the curve turns back in your favor.
Execution checklist
• Price touches a band on a headline.
• Wait five full minutes.
• Decide between confirmation or rejection.
• If confirmation, demand a fifteen minute close through the band and a clean retest.
• If rejection, let the wick print and use the wick high or low as your invalidation.
• Take partials one band at a time rather than the exact level.
• If you are still in a trade into the U.S. close on Friday, flatten first and protect your weekend.
Risk and position sizing
Keep risk small until the midweek cluster passes. Use a volatility stop based on the current fifteen minute ATR. Tie your size to that stop so that one loss equals a fixed fraction of account risk. Set a max loss for the day and for the week. If either is hit you are done. That is a rule, not a suggestion.
What can go wrong
• A surprise release at an unexpected time can push the index through a band before you have a signal. If you missed it, you missed it. Do nothing.
• A sloppy Treasury headline can move rates while equities rally. That mixture can confuse the dollar for an hour. Size down and let the tape choose a side.
• The Bank of England tone can reverse a move you liked. During the press conference keep positions smaller and stops wider or stand aside.
Three simple rules for the week
• Trade reaction, never the headline itself.
• Confirm with a fifteen minute close before betting on a break.
• Take partials into the next band every single time.
Disclaimer
Education and analytics only. This is not investment advice.
Potential bullish rise?The US Dollar Index (DXY) has bounced off the pivot, which acts as a pullback support and could rise to the 1st resistance.
Pivot: 98.5
1st Support: 96.40
1st Resistance: 10.80
Disclaimer:
The above opinions given constitute general market commentary, and do not constitute the opinion or advice of IC Markets or any form of personal or investment advice.
Any opinions, news, research, analyses, prices, other information, or links to third-party sites contained on this website are provided on an "as-is" basis, are intended only to be informative, is not an advice nor a recommendation, nor research, or a record of our trading prices, or an offer of, or solicitation for a transaction in any financial instrument and thus should not be treated as such. The information provided does not involve any specific investment objectives, financial situation and needs of any specific person who may receive it. Please be aware, that past performance is not a reliable indicator of future performance and/or results. Past Performance or Forward-looking scenarios based upon the reasonable beliefs of the third-party provider are not a guarantee of future performance. Actual results may differ materially from those anticipated in forward-looking or past performance statements. IC Markets makes no representation or warranty and assumes no liability as to the accuracy or completeness of the information provided, nor any loss arising from any investment based on a recommendation, forecast or any information supplied by any third-party.

US Dollar: Still Bullish! Wait For The Pullback, Then Buy It!Welcome back to the Weekly Forex Forecast for the week of Nov. 3 - 7th.
In this video, we will analyze the following FX market: USD Dollar
The USD is still bullish, and buys are still valid until there is a definitive bearish BOS.
There is a LQ-Low and a +OB below current prices, drawing prices to it. There, I will look for an HP trade to the upside.
So short term bearishness before the continuation higher.
Should the market break the low of the +OB, then buys are invalidated.
Enjoy!
May profits be upon you.
Leave any questions or comments in the comment section.
I appreciate any feedback from my viewers!
Disclaimer:
I do not provide personal investment advice and I am not a qualified licensed investment advisor.
All information found here, including any ideas, opinions, views, predictions, forecasts, commentaries, suggestions, expressed or implied herein, are for informational, entertainment or educational purposes only and should not be construed as personal investment advice. While the information provided is believed to be accurate, it may include errors or inaccuracies.
I will not and cannot be held liable for any actions you take as a result of anything you read here.
Conduct your own due diligence, or consult a licensed financial advisor or broker before making any and all investment decisions. Any investments, trades, speculations, or decisions made on the basis of any information found on this channel, expressed or implied herein, are committed at your own risk, financial or otherwise.

DXY WILL KEEP GROWING|LONG|
✅DXY After a clean breakout above the key level, the index is showing strength and structure shift in favor of buyers. A potential retest of the zone may trigger continuation toward the target area. Time Frame 4H.
LONG🚀
✅Like and subscribe to never miss a new idea!✅

DXY Bullish Breakout! Buy!
Hello,Traders!
DXY broke above a key demand area, confirming bullish intent. A successful retest of the breakout zone may attract further buy orders toward the target level. Time Frame 5H.
Buy!
Comment and subscribe to help us grow!
Check out other forecasts below too!
Disclosure: I am part of Trade Nation's Influencer program and receive a monthly fee for using their TradingView charts in my analysis.

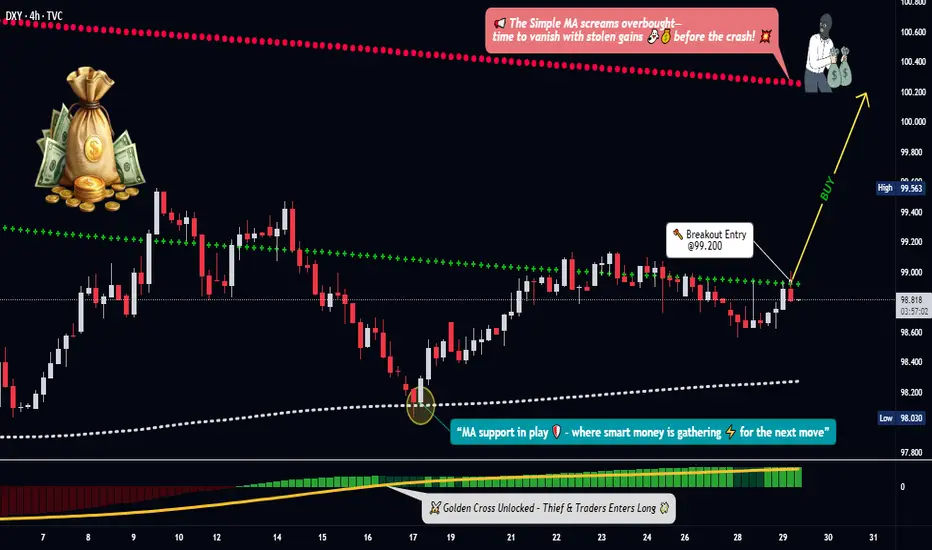
DXY Breakout Map — Is the Dollar Index Ready for a Power Move?🎯 DXY BULLISH BREAKOUT: The "Limit Order Layup" Strategy 🚀
Hey Thief OGs! 👋 The King Dollar 👑 is getting ready for a potential rally, and we've got the map 🗺️ to navigate it. This is a swing/day trade plan focusing on a classic technical setup with a tactical entry twist.
📈 The Overall Plan (Bias): BULLISH 🐂
The strategy waits for a bullish confirmation using a Simple Moving Average (SMA) pullback 🔙 followed by a MACD golden cross ✨. We're buying the dip, expecting a continuation upward 📊.
⚡ The Thief's Entry Tactic (The "Layering Method") 🎁
The key is patience and precision. We don't chase the price.
✅ Wait for the Trigger: Confirm a daily close ABOVE 99.200.
🎯 Deploy Limit Orders: After the breakout, set multiple buy limit orders at key support levels to get a good average entry price.
Suggested Layers: 🟢 98.400, 🟢 98.600, 🟢 98.800, 🟢 99.000
💡 Pro Tip: You can adjust the number of layers and levels based on your own risk appetite!
🛡️ Risk Management (The Escape Plan) 🚨
Stop Loss (SL): A hard stop is placed at 98.200. This level is the line in the sand – if price breaks below here, our thesis is likely invalid ❌.
⚠️ Note: Dear Ladies & Gentleman (Thief OGs), I do not recommend you set only my SL. It is your own choice. You can make money, then take money at your own risk.
🎯 Profit Targets (The Getaway) 💰
Take Profit (TP): We are targeting 100.200. This zone aligns with where the Moving Average may act as strong resistance, and the market could become overbought. When the trap is set, we escape with profits! 🏃♂️💨
⚠️ Note: Dear Ladies & Gentleman (Thief OGs), I am not recommending you set only my TP. It is your own choice. You can make money, then take money at your own risk.
🔍 Related Pairs to Watch & Key Correlations 🌐
The DXY doesn't move in a vacuum. Keep an eye on these:
EUR/USD ( FX:EURUSD ): 👑 The inverse king. A rising DXY typically means a falling EUR/USD 📉.
GBP/USD ( FX:GBPUSD ): Similar to the Euro, a strong dollar often pressures Cable downward 📉.
Gold ( OANDA:XAUUSD ): 🪙 Gold is priced in USD. A stronger dollar can make gold more expensive for other currencies, often putting downward pressure on it 📉.
USD/JPY ( FX:USDJPY ): A strong dollar trend usually powers USD/JPY higher 📈.
Key Point: If our DXY bullish idea is correct, you should generally see EUR/USD and GBP/USD weakening 📉, and USD/JPY strengthening 📈.
✨ “If you find value in my analysis, a 👍 and 🚀 boost is much appreciated — it helps me share more setups with the community!”
#DXY #TradingSetup #SwingTrading #Forex #DollarIndex #TradingStrategy #MACD #TechnicalAnalysis #LimitOrder
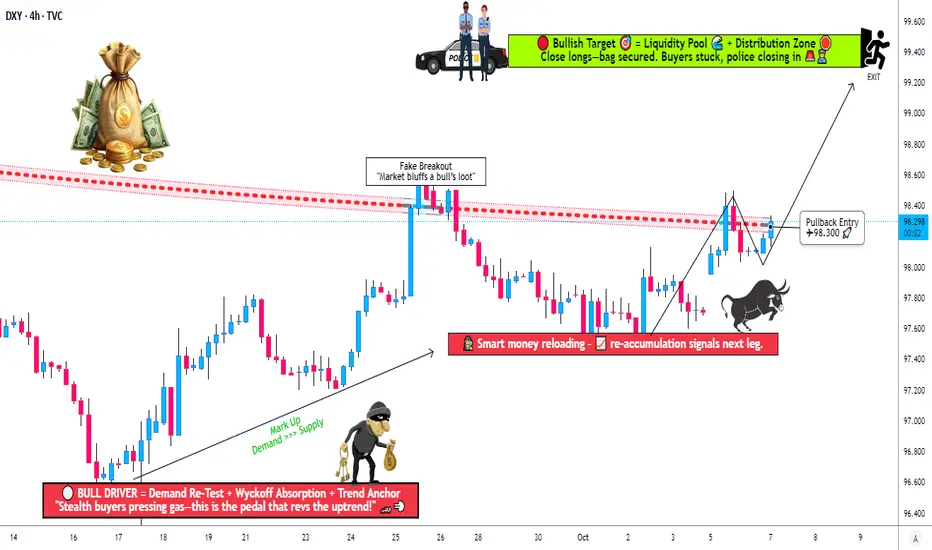
DXY Breakout Confirmed — How Far Can Bulls Run?💰 Thief’s Heist: DXY Bull Raid in Progress ⚡ Layered Entry Strategy!
📈 Setup Summary
Asset: DXY Dollar Index (Cash)
📊 Bias / Plan: BULLISH — 0.786 Triangular Moving Average was breached by buyers → trend confirmation in progress 🚀
🎯 Thief’s Game Plan (Swing / Day Trade)
🕵️ Entry Plan — “Layered Thief Style”:
💎 Any price level entry is valid — flexibility is the Thief’s advantage!
🔹 Sample Limit Layers:
• 97.800
• 98.000
• 98.200
(💡 You can increase or reduce layers based on your own style — stack smartly!)
🧨 Stop Loss (Thief SL):
⚠️ 97.400 → This is the “Thief SL Zone”
👉 But you’re the mastermind — set your own SL if you prefer!
💰 Target Zone (TP):
🚧 Police Barricade at ~99.400 — strong resistance area + oversold trap likely
💨 Thieves escape with bags before the trap closes!
⚙️ Take profit partially or fully at your own comfort — be swift, be smart 🦅
🧩 Market Insight & Technical Reasoning
✅ 786 Triangular MA breach confirms bullish structure
✅ DXY strength often follows Treasury Yield push 📈
✅ Strong USD = Weak Gold & EUR/USD usually
✅ Oversold readings hint buyers ready to counter attack
🔗 Correlation Watchlist (Related Pairs)
Keep an eye on these for confirmation 🔍
💶 FX:EURUSD → usually inverse to DXY
💷 FX:GBPUSD → tracks EUR/USD correlation
💴 FX:USDJPY → directly correlates with DXY
🥇 Gold ( OANDA:XAUUSD ) → moves opposite to DXY
💵 TVC:US10Y Yields → rising yields = bullish DXY
💡 Key Tip:
When EUR/USD & GBP/USD drop sharply + yields rise → DXY often continues its rally 🧭
⚠️ Notes & Thief Disclaimers
👑 Dear Ladies & Gentlemen (Thief OGs):
I’m not recommending my SL or TP — make your own risk rules 💼
You can make money, take money, or just watch the play unfold 🎭
This is a “Thief Style” strategy, shared for fun & educational inspiration only 🧠
Always manage risk & protect capital first — thieves survive by escaping, not over-staying 💨
✨ “If you find value in my analysis, a 👍 and 🚀 boost is much appreciated — it helps me share more setups with the community!”
Disclaimer: this is thief style trading strategy just for fun
#DXY #USDIndex #Dollar #Forex #LayeredEntry #SwingTrade #DayTrade #ThiefStrategy #TrendBreak #SmartMoney #TechnicalAnalysis #USD #TradingView #FXStrategy
Is the Gold Bull Market Over? Gold has had a double digit correction form the all time high.
Pulling back just over 11% is very healthy if the bull market trend is to resume.
On an intra day 4 hour time frame gold is still looking very weak.
However the weekly pattern was able to hold a key weekly bullish level.
Gold is at a very tricky inflection point so i would personally wait until you get some key breakout or breakdown signals.
Look towards your miners to see if they are gaining additional liquidity. They will often lead.

DXYDXY is ready for correction or impulse down this week even if it wants to break 100 it will give us correction down first.
Disclosure: We are part of Trade Nation's Influencer program and receive a monthly fee for using their TradingView charts in our analysis.
