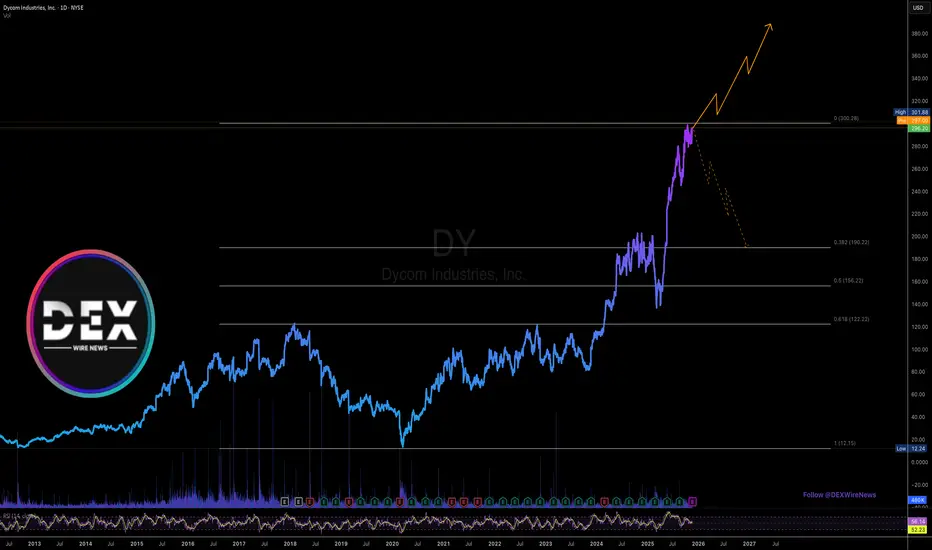
Dycom Industries, Inc. (DY) Set to Report Q4 Results TodayDycom Industries, Inc. (NYSE; NYSE:DY ) is set to reports its Q4 earnings results today before market open. the stock has close yesterdays session up 2.4% in extended trading.
With the RSI at 56, a favourable update could send the stock to the $350 resistant point. However, failure to release a positive update on the earnings report might send the stock dipping to the 38.2% fib retracement level.
Financial Performance
In 2024, Dycom Industries's revenue was $4.70 billion, an increase of 12.61% compared to the previous year's $4.18 billion. Earnings were $233.41 million, an increase of 6.62%.
Analyst Summary
According to 11 analysts, the average rating for DY stock is "Strong Buy." The 12-month stock price target is $283.36, which is a decrease of -4.33% from the latest price.
In recent developments, Dycom Industries, Inc. (NYSE: DY) announced the appointment of Stephen O. LeClair to its Board of Directors, effective November 7, 2025.
About DY
Dycom Industries, Inc. provides specialty contracting services to the telecommunications infrastructure and utility industries in the United States. The company offers engineering services to telecommunications providers, including the planning and design of aerial, underground, and buried fiber optic, copper, and coaxial cable systems; placement of cables, related structures, and drop lines for telephone companies.
Dynamic
"The Myth of Confirmation - What Retail Gets Wrong Every Day"🔥 THE TRUTH ABOUT MARKET “CONFIRMATION” (What Retail Never Realizes)
Most traders think confirmation comes from indicators, patterns, candle shapes, or repeating formations on lower timeframes.
This is the greatest misunderstanding in trading.
Confirmation does NOT come from the LTF.
Confirmation comes from alignment of the delivery cycle — and the LTF only expresses what the HTF already decided.
Retail thinks the 5M “creates” trend.
Institutions know the 5M merely reflects it.
Here’s the real breakdown institutions use:
⸻
1. Confirmation = Completion of a Phase, Not a Pattern
A market only confirms when a structural phase fully completes, meaning:
• Liquidity objective hit
• Internal structure reset
• Order flow aligned
• Efficient price or imbalance corrected
• Pullback cycle finished
• New impulsive leg prepared
This is confirmation.
Not a candle.
Not an indicator.
Not a shape on your chart.
⸻
2. LTF Structure Means NOTHING Without HTF Context
Retail loves reacting to:
• 5M BOS
• 1M pullback
• 15M FVG
• Candle patterns
• Trend lines
None of these matter if the HTF hasn’t finished its development cycle.
This is why traders lose:
They see “confirmation” while the HTF is still in a build-up, not a release phase.
⸻
3. The Market Confirms Twice — Retail Only Sees One
Institutional traders track two confirmations:
Macro Confirmation (HTF)
This tells the market what it wants to do next
— continuation or pullback.
Micro Confirmation (LTF)
This tells the market when it’s safe to execute
— trend shift + pullback + OB tap + displacement.
Retail only waits for micro confirmation.
They skip macro confirmation.
So they trade inside noise.
⸻
4. Candles Don’t Confirm — the Cycle Confirms
People over-read 5M candles, ignoring the fact that candles are only expressions of liquidity movement.
You can’t read intent from shape.
You read intent from position in the cycle.
The same candle means:
• continuation in one phase
• reversal in another
• manipulation in another
Only the cycle gives it meaning.
⸻
5. The Market Doesn’t Confirm For You — It Confirms ITSELF
This is the coldest truth most will never learn:
Price never confirms your bias.
Price only confirms where it is in the timeline.
If you don’t know the timeline,
you don’t know the confirmation.
TL;DR
(Beginner/Simple)
Confirmation = Cycle Completion + Alignment
NOT a candle pattern or indicator.
You don’t follow confirmation.
You follow timing.
Understanding the Dynamics of Commodity Prices1. What Are Commodities and Why Do Their Prices Matter?
Commodities are basic raw materials or primary agricultural products that can be bought and sold, often standardized and interchangeable within the same grade. They are broadly classified into two types:
Hard Commodities – Natural resources that are mined or extracted, such as oil, gold, copper, and natural gas.
Soft Commodities – Agricultural products or livestock, such as coffee, wheat, sugar, and cotton.
Commodity prices play a pivotal role in determining the cost of goods and services. For instance, a surge in oil prices can increase transportation and manufacturing costs, leading to overall inflation. Similarly, falling food prices can influence rural incomes and consumption patterns in agricultural economies like India or Brazil. Hence, understanding commodity price dynamics is essential for policymakers, investors, and businesses alike.
2. The Law of Supply and Demand
The most fundamental principle driving commodity prices is supply and demand. When demand exceeds supply, prices rise; when supply surpasses demand, prices fall. However, in commodity markets, these shifts are rarely immediate or smooth because both supply and demand are influenced by a variety of short-term and long-term factors.
Demand Factors:
Economic Growth: Industrial expansion boosts demand for energy, metals, and agricultural commodities. For example, China’s rapid industrialization in the 2000s fueled massive demand for iron ore and copper.
Population Growth and Urbanization: As populations grow and cities expand, consumption of food, energy, and construction materials increases.
Technological Development: New technologies, such as electric vehicles, can alter demand patterns — increasing demand for lithium, nickel, and cobalt while reducing oil dependence.
Consumer Preferences: Dietary shifts (e.g., toward meat consumption) can raise demand for animal feed grains like corn and soybeans.
Supply Factors:
Production Capacity: Limited resources, mining capacity, or arable land can constrain supply.
Weather and Climate: Droughts, floods, or hurricanes can drastically affect agricultural output.
Geopolitical Stability: Wars, sanctions, and political unrest can disrupt supply chains — as seen in the Russia-Ukraine conflict’s impact on wheat and oil markets.
Technological Advancements: Improved extraction and farming techniques can enhance supply efficiency.
In the short term, commodity prices are often volatile due to mismatches between supply and demand, but over the long term, they tend to align with production costs and global consumption trends.
3. The Role of Speculation and Financialization
Commodity prices are not only determined by physical supply and demand but also by financial market participants. The rise of futures markets has enabled traders, investors, and producers to hedge risks or speculate on future price movements.
Hedgers (like farmers or oil producers) use commodity futures to lock in prices and protect against unfavorable price changes.
Speculators (like hedge funds and traders) aim to profit from price fluctuations without owning the physical commodity.
The increasing financialization of commodity markets — especially after the 2000s — has made prices more sensitive to investor sentiment, macroeconomic news, and monetary policies. When investors view commodities as a hedge against inflation or currency depreciation, inflows into commodity futures can drive prices higher, even if fundamentals remain unchanged.
For instance, during the 2008 financial crisis and the subsequent quantitative easing (QE) era, commodity prices surged due to massive liquidity inflows and the perception that commodities would protect against fiat currency debasement.
4. The Influence of Global Macroeconomic Factors
a. Inflation and Monetary Policy
Commodity prices and inflation are closely intertwined. Rising commodity prices can contribute to inflation, while inflationary environments often drive up commodity demand as investors seek real assets. Central banks’ interest rate policies also impact prices — lower interest rates tend to weaken currencies and boost commodity demand, as commodities are typically priced in U.S. dollars.
b. Exchange Rates
The U.S. dollar has a significant inverse relationship with commodity prices. A weaker dollar makes commodities cheaper for holders of other currencies, thereby increasing global demand. Conversely, a strong dollar tends to suppress commodity prices. This dynamic explains why global commodity cycles often coincide with U.S. dollar trends.
c. Economic Growth Cycles
During periods of global expansion, industries consume more energy, metals, and raw materials, leading to rising prices. Conversely, recessions dampen demand and push prices downward. For instance, the 2020 COVID-19 lockdowns led to a historic collapse in oil prices due to unprecedented demand destruction.
5. Geopolitical and Policy Influences
Geopolitics plays a critical role in shaping commodity markets. Conflicts, trade sanctions, and government interventions can create sudden disruptions in supply chains.
Oil and Energy: The Middle East remains a geopolitical hotspot. OPEC decisions, U.S. shale production policies, and conflicts in oil-producing regions significantly impact global oil prices.
Agriculture: Export restrictions, such as India’s bans on wheat or rice exports, can tighten global supplies and push prices up.
Metals and Minerals: Resource nationalism — when governments impose stricter control or taxes on mining — can influence global availability and pricing.
Government subsidies, import tariffs, and sustainability policies also play major roles. For instance, climate policies promoting renewable energy increase demand for rare earth metals used in batteries and turbines.
6. Technological and Structural Shifts
Technological evolution has always reshaped commodity markets. From mechanized agriculture to fracking and renewable energy, innovations alter both supply and demand patterns.
a. Energy Transition
The global shift toward clean energy has created new demand centers for lithium, cobalt, and nickel while threatening the long-term dominance of oil and coal. As renewable energy storage technologies mature, price dynamics will increasingly hinge on battery metals and hydrogen.
b. Agricultural Technology
Precision farming, genetically modified crops, and irrigation technologies improve crop yields and reduce volatility caused by weather. However, climate change continues to pose challenges, potentially offsetting technological gains.
c. Automation and AI in Mining
Modern mining operations use AI and automation to improve efficiency, lower costs, and predict supply bottlenecks, influencing commodity production levels and price stability.
7. Cyclical Nature of Commodity Prices
Commodity prices often move in cycles driven by investment patterns, production responses, and economic demand. These are typically referred to as commodity supercycles — extended periods of high or low prices lasting several years or decades.
During boom phases, high prices encourage producers to expand capacity. However, this expansion eventually leads to oversupply, causing prices to fall and triggering a bust. The mining and oil industries are especially prone to such cycles because of their long investment timelines and capital intensity.
Historically, commodity supercycles have coincided with major industrialization phases:
Early 1900s: U.S. and European industrial expansion.
1970s: Oil shocks and rapid inflation.
2000–2010s: Chinese industrial boom.
Currently, the world may be entering a green transition supercycle, driven by demand for renewable energy materials.
8. The Impact of Climate Change and Sustainability
Climate change has become a defining factor in commodity markets. Extreme weather events — droughts, floods, hurricanes — directly disrupt agricultural and energy production. Additionally, global efforts to reduce carbon emissions are reshaping investment flows and consumption patterns.
a. Carbon Pricing and Regulations
Carbon taxes and emission caps influence fossil fuel demand and promote renewable energy investments, altering long-term price structures.
b. ESG Investing
Environmental, Social, and Governance (ESG) considerations are pushing investors to favor sustainable commodities, leading to increased capital flow into green metals and ethically sourced materials.
c. Agricultural Vulnerability
Global warming threatens crop yields and water availability, making food prices more volatile and raising concerns about food security.
9. Role of Emerging Markets
Emerging markets play a dual role as both producers and consumers in global commodity markets. Nations like Brazil, Russia, India, China, and South Africa (BRICS) collectively dominate global production of energy and raw materials while driving consumption through industrialization and population growth.
For example:
China is the world’s largest consumer of metals.
India is one of the biggest importers of oil and gold.
Brazil and Russia are major exporters of agricultural and energy commodities.
Economic growth in these countries exerts a significant influence on global commodity demand and prices.
10. Understanding Price Volatility
Commodity prices are notoriously volatile because they are sensitive to short-term disruptions. Factors such as weather anomalies, policy announcements, or currency fluctuations can cause sharp price swings. Volatility is further amplified by speculative trading, algorithmic strategies, and investor sentiment.
To manage volatility, producers and consumers rely on hedging instruments — futures, options, and swaps — while policymakers use strategic reserves to stabilize domestic markets. Despite these tools, unforeseen events like the COVID-19 pandemic or Russia-Ukraine conflict demonstrate that commodity markets remain inherently unpredictable.
11. Future Outlook: The Evolving Commodity Landscape
The future of commodity pricing is being shaped by three powerful trends:
Energy Transition: The global shift toward clean and renewable energy will redefine demand for fossil fuels and boost prices for critical minerals.
Digitalization: Blockchain and data analytics are improving transparency, traceability, and efficiency in commodity trading.
Geopolitical Realignments: Emerging economic blocs and supply chain diversification are reshaping trade patterns, potentially reducing global dependency on a few key producers.
In the coming decade, commodity markets will likely see more structural shifts than cyclical ones, driven by sustainability imperatives and technological innovation.
Conclusion
Understanding the dynamics of commodity prices requires a holistic view that integrates economics, geopolitics, technology, and psychology. Commodity markets are not just about physical goods — they are a reflection of global growth, investor sentiment, and policy directions.
From oil shocks to green energy booms, the forces shaping commodity prices evolve continuously. As the world transitions to a more sustainable and digitally interconnected economy, commodities will remain both a foundation of global trade and a mirror of broader economic transformation.
In essence, mastering the dynamics of commodity prices means understanding the pulse of the world economy itself.
Forecasting Dynamic Fibonacci MA w/369 theoryAt first, it was a theory. Now as I continue to craft and tweak my dynamic MA I’ve come to discover a special symbol that performs well with this indicator, XRP. XRP’s Bitcoin-like volatility mixed with Link-like stable trends gives it the opportunity to perform extremely well. This indicator was made, tweaked and utilized for and on XRPs market. So it is best to use it on =<30min with 0 offset (forecasting). To get the best forecasting predictions, use 1hr and above with at least 1 offset or as many as you need to add until the line is just one point ahead of the current candle. I’ve found these predictions to be extremely accurate for XRP

LTCUSDT needs to hold the support!LTCUSDT has been testing a key level in the 100$ area, where there is a weekly resistance level. This level has proven to be significant in the past, and it's possible that buyers are struggling to push the price higher.
Furthermore, the price has lost its dynamic support and is now testing it as a new resistance level. If the price were to lose this support and retest it as a new resistance level, it would signal a potential shift in market sentiment from bullish to bearish. In this scenario, traders may consider applying Plancton's Rules, a trading strategy that involves taking a short position when a market experiences a significant price drop.
It's important to note that this scenario would only apply if the price were to lose its support and retest it as a new resistance level. If the price were to hold its support and continue to push higher, it could signal that buyers are still interested in entering the market and that there is potential for further gains.
–––––
Follow the Shrimp 🦐
Keep in mind.
🟣 Purple structure -> Monthly structure.
🔴 Red structure -> Weekly structure.
🔵 Blue structure -> Daily structure.
🟡 Yellow structure -> 4h structure.
⚫️ Black structure -> <= 1h structure.
Follow the Shrimp 🦐

BTC Movement in Daily Timeframe Can Touch 47K !!!This is my first idea in trading view 4/22/2022
after 24Day price reduction I think we should have another pump to 47K
before that we able to touch 35K !!!
as you can see technically price after losing 43K ,now Price can break out long channel (Blue Channel) that made in 22Jan2022 to 35K easily.
we have another big Dynamic resistance (Shown with red color ) in 40K after break 40K price can touch 47K again .
👾News Channel👾 : @purpleEx
👾Music Channel👾 : @Prpltime
👾 VIP Channel 👾 : @PexVIP

CAKE still facing lot of resistanceCAKE is still under a lot of resistance which is coming from
1. Dynamic trendline
2. Bearish order block
3. Strong Market structure
If we see huge volume only than these will be broke.
Our targets are on chart.

personally bought audio4h resistance was broken as I forecasted in my last ideas
im not sure if this was a proper breakout but here are my levels if they can be helpful for anybody
NOT FINANCIAL ADVICE so please always DYOR and DYOA
entry 1.31
TP: 1.5
SL: 1.18

JPY at support and showcasing the 170° Mars from the 1995 highThis chart is made to showcase the planetary angle taken from the 1995 high natal date/degree on Mars.
As can be seen from the chart, the 170° Mars Heliocentric mars is a strong turning point with some amazing results.
The Dynamic square of 9 projected from the recent high provides timing and pricing clues as well. my reading is that is long as this support level stands, we could see a major reversal all depends on what the USD does. the EUR can be used as a confirming chart as well as it's in a triangle too.

Dynamic Color Table from arrays.a table that takes a number of arrays or names/colors and plots them for color scheme design and such. can be used to show data as well, however more work is needed. building a kit for design work tools. color scheme design and storage in arrays
OEducation

Amazon Free Game Downloads for March Gameday Happens in Madden NFL 22. Dominate with Ultimate Team rewards for Prime members and check back each month to claim your packs. All-new features like Next Gen Stats star-drive AI and immersive Dynamic Gameday deliver the most authentic gameplay experience ever.
Surviving Mars
Surviving Mars is a sci-fi city builder all about colonizing Mars and surviving the process. Choose a space agency for resources and financial support before determining a location for your colony. Build domes and infrastructure, research new possibilities, and utilize drones to unlock more elaborate ways to shape and expand your settlement. Cultivate your food, mine minerals, or just relax by the bar after a hard day’s work.

When to see ADA = 10 USDT..We are witnessing a support at the long-time dynamic support and if the support works, we will see another bullish trend in ADA. We can meet the ATH and blue line targets once the alt season officially starts. Please pay attention to the fact that each trend and analysis are peculiar to a specific, single time-frame. Don't mess them with each other. The analyzed trend in weekly time-frame, may not be seen in daily or shorter time-frames.
This is not a financial advise. Just follow your analysis and stick to your risk and asset management. You know the market..
P.s Trade easily with just few lines. Don't get involve and use extra indicators and oscillators.

Indigo H&S Patten 4_H dated 25-Oct-21Time frame 4 Hour
Pattern: Head and shoulder.
Trading near dynamic support.
Sell below 1960 for the target of 150+200 points
Stoploss will be @ 2021.
Don't forget to like and share
Happy Trading

LongStock gave huge breakout with decent volume on buy side. My prediction will be touch 3340 mark.you can take long entry from here.


DYNPRO Poised for a Bullish BreakoutDYNPRO listed on NSE recovered to the recent high of 532, poised for a bullish breakout which shall extend gains towards the 580/600/630 mark in the coming sessions. Only a close under 480 shall negate bullish sentiments.

ES Hits target after target for longsIt will come down to the next mean reversion for a look to enter now, but wow if you were long this last week or so, you are happy! It was pretty easy to stay in this trend this time around, and good places to take targets too.

DO YOU WANT SOME GA PIPS ?Hello Traders,
This is my view in GA on 1 Hour TF.
GA has tested 200 EMA and it act as a Dynamic support.
stay in touch for any updates.
If You have another analysis,please let me know in comment section.
Always follow a Risk management strategy.
Good Luck buddies.


USDJPY Long off trendline after new higher highAfter a break of the inner trendline which you might consider a median line in a channel forming a new higher high we now see a pull back and the line now provides us a place of dynamic support which we can go long off of. We may well sell a dive back below to the 73% mark which Is my favourite zone to go long from. Difficult to put a RR on it as it's a moving target but it's good whatever it is.


STXUSDT is trying to have a breakout 🦐STXUSDT is trying to have a breakout from the dynamic daily trendline and static daily resistance
IF the price will have a breakout, According to Plancton's strategy, we can set a nice order
–––––
Follow the Shrimp 🦐
Keep in mind.
🟣 Purple structure -> Monthly structure.
🔴 Red structure -> Weekly structure.
🔵 Blue structure -> Daily structure.
🟡 Yellow structure -> 4h structure.
⚫️ Black structure -> <4h structure.
Here is the Plancton0618 technical analysis, please comment below if you have any question.
The ENTRY in the market will be taken only if the condition of the Plancton0618 strategy will trigger.

Preliminary Squeeze On [USD/JPY] LongMy conclusion is as stated; however, new lows will be created before upside movement. Taking out all the late Sellers for the eventual rejection. In the coming weeks JPY is expected to lose some value to substitute USD Strength to test Dynamic Resistance.
