Breakdown of GBPJPY TradeMy first video on this platform, hope all of you enjoyed. Thank you for watching.
Economic Cycles

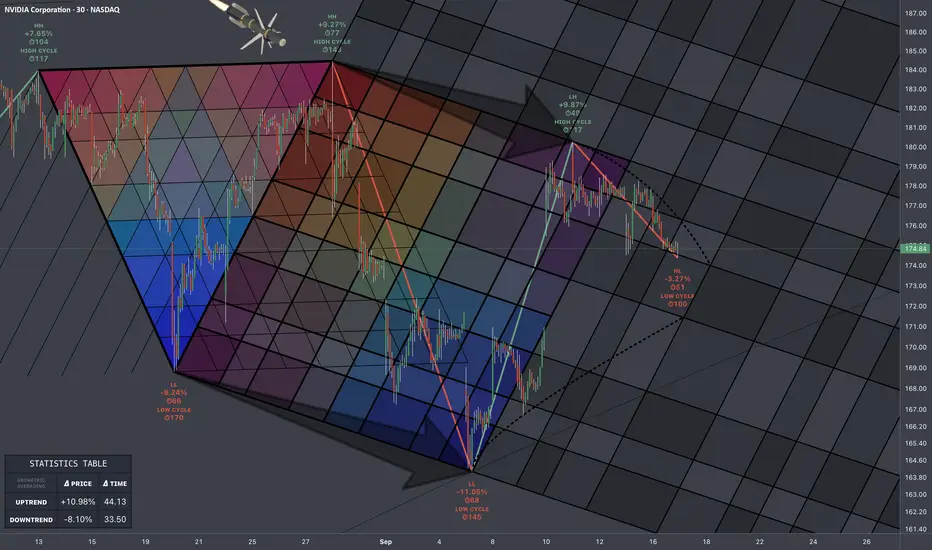
$NVDA: Structure MemoryRESEARCH NOTES
So we have NVIDIA establishing new ATH - rejecting from there and from another lower high, opening a channel.
The topology covering the area (dual aspect):
Inward
Out
Research on how waves of different % magnitude shape the route of future price and its cycles.
FMOC announcement tomorrowSolana price action! We're in a strong ascending channel. Over the past 2 days it's retracted to the midway point of the channel basically in a holding pattern awaiting tomorrow's FOMC interest rate announcement. If there's no rate cut I expect the price to fall to the bottom of the blue channel, but if a rate cut is announce (like almost all analyst expect), we'll likely see a breakout upwards towards $300 maybe by the end of the day tomorrow and further gains into the weekend. I personally plan to have a long position already open in anticipation of the rate cut which is heavily favored. If no cut is announced I have my stop loss in place to limit losses. 👊

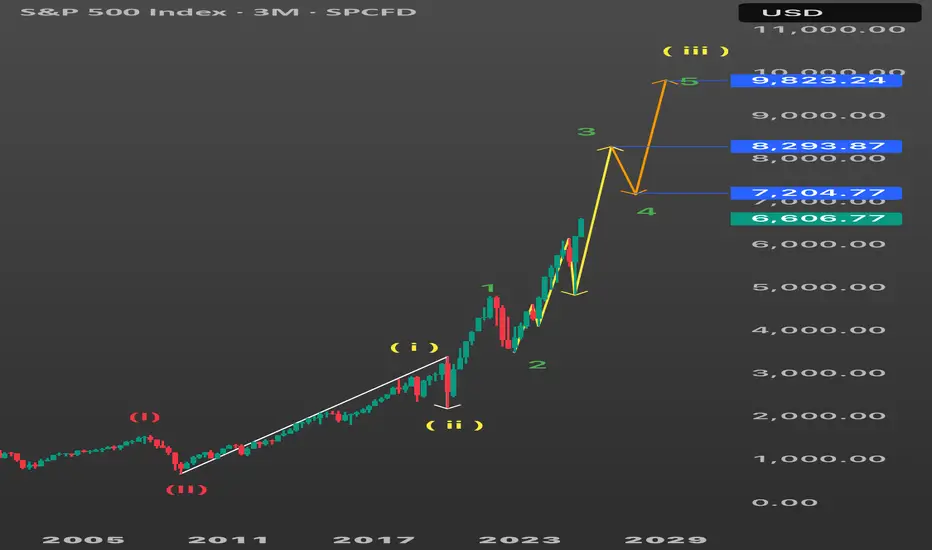
SPX Elliott Count. (W3 of 3). S&P 500: Elliott Wave.
Targets:
8,293 then 7,204 finally 9,823.
SPX is currently in sub-wave 5 in W3 of W3. From this point we should see an aggressive push to 8,293 following a pullback then continuation.
THE 4-YEAR CYCLE WILL NEVER ENDTHE 4-YEAR CYCLE WILL NEVER END.
As I’ve said many times before, I now think this cycle will push into late January / February 2026, similar to 2017.
As I’ve written extensively about, the macro setup is nearly identical to 2017.
Read that here.
The funny thing is, when we do push into early Q1 ‘26, all your favorite “influencers” will proclaim “this time is different”, because most weren’t here during the 2017 cycle or before.
There is ZERO EVIDENCE that the 4-year cycle is dead.
Since the GFC in 2008, the Fed was redesigned for these boom and bust cycles to counter inflation and unemployment.
At this point, unless the US completely dismantles the Fed, the 4-year cycle will live on in perpetuity. We see the effect of this on TradFi as well.
See the comparison here.
The Fed is set to cut interest rates for the first time in a year at tomorrow’s FOMC. This is a liquidity positive catalyst for markets.
The next ISM PMI print on October 1st should be ~50, which will be the start of the business cycle.
That would give us ~5 months of a surging business cycle, which will pump risk assets to VALHALLA.

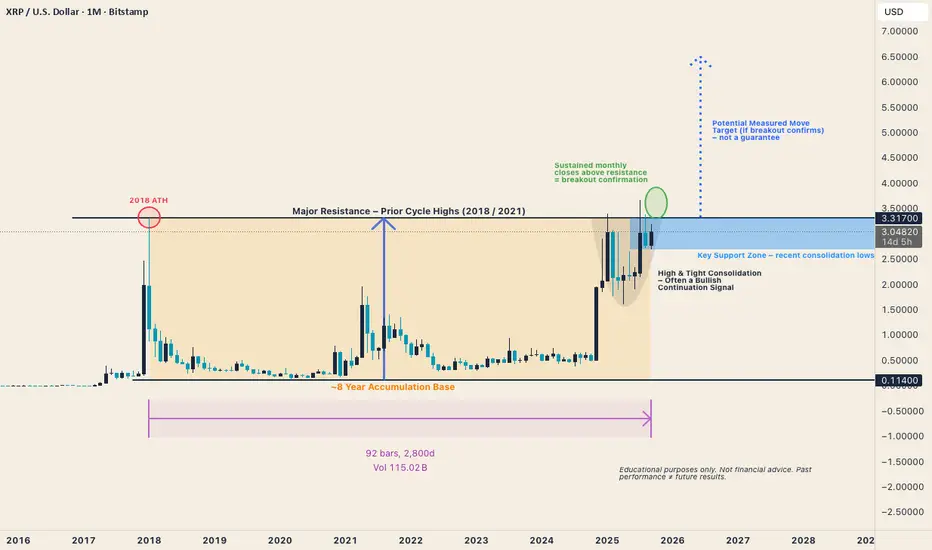
XRP Monthly – Watching an 8-Year BaseXRP is testing major resistance from prior cycle highs (2018 & 2021).
Structure: ~8-year accumulation base
Behavior: High & tight consolidation on the right side of the base (often bullish continuation)
Confirmation: Sustained monthly closes above $3.30 = breakout confirmation
Projection: Potential measured move points toward ~$6.50 (educational framework only, not a guarantee)
Key takeaway: This is one of the most significant long-term structures XRP has ever formed. Traders should watch closely for confirmation in the coming months.
XAUUSD BuyGold is in a very bullish market so with that in mind. Price took out liquidity and pushed upward. As it comes into the Order Block it makes sense to buy since there was a sweep already. There are other factors for the buy as well such as the inducement for this session and volume being stagnant on the bearish bars.

GBPJPY BuyLit cycle. Daily cycle. Volume diminishment when price is internally bearish. Reaction off a Order Block.

ABNB - L1 Bullish Daily Exhaustion SignalNASDAQ:ABNB has triggered a level 1 bullish exhaustion signal on the daily resolution. This signal has triggered 15 times in the stock's history with an 80% win rate and avg move of 2.81% over the following 6 candles.

The Final Ascent: BTC's $165K Launchpad Before the Great ResetBuckle up. This isn't just another chart; it's the roadmap for the most critical phase of Bitcoin's current cycle. We're witnessing the final act of a masterpiece play out right now, and understanding this structure is the key to navigating what comes next.
Here’s the brutal, beautiful truth laid out by the tape:
The Setup: From Compression to Ignition
Remember the agonizingly long consolidation? That was the massive Falling Wedge throughout 2022 and early 2023. It was a pressure cooker, squeezing out weak hands and building immense energy. The major breakout from that Falling Wedge was the spark. It wasn't just a rally; it was the official signal that the bull market was back on. That breakout launched us into the next, more powerful pattern the Rising Wedge.
The Current Play: The Rising Wedge Journey
We are now deep inside this ascending channel. Each higher high and each higher low is creating this converging pattern a classic Rising Wedge. This is the market's way of climbing a wall of worry on a wave of increasing optimism and liquidity. But make no mistake, this structure is inherently bullish yet exhausting. It's the final leg up, the last major push to suck in every last bit of momentum before the fuel runs out.
The Target: The Cycle Peak
The geometry of this wedge is pointing to a final, spectacular blow-off top. The most probable target for the peak of this wedge is $165,000. I wouldn't be surprised to see a slight extension in the euphoria that could tag $170,000, but that's the ceiling. Based on the rhythm of this move, the clock is ticking towards a November 2025 finale. Mark it.
The Inevitable: The Great Bear & The Golden Accumulation Zone
This is the most critical part. A Rising Wedge resolution is almost always the same: a violent breakdown. The fallout from this peak will be brutal a proper crypto winter. It will shake out every over leveraged dreamer. This bear market will find its ultimate bottom, its point of maximum financial opportunity, in the $54,000 - $60,000 zone. That is not a typo. That will be the generational buying opportunity. The mother of all dips. ACCUMULATE THERE.
The Next Chapter: The $500K Horizon
That 2027 bottom won't be the end. It will be the foundation for the next cycle. The recovery from that $60k zone will be the start of Bitcoin's next, truly historic run towards a target that seems crazy today $500,000. This isn't hopium; it's the logical progression of the four year cycle, adoption curves, and the patterns that have always governed this market.
The Bottom Line:
We are in the final, parabolic stage. Target $165K+ by Nov 2025. Then, prepare for the storm. The real-life changing wealth won't be made at the top; it will be made by those with the courage and dry powder to buy relentlessly in the $54k-$60k pit of despair in 2027.
This is the plan. Trade accordingly.

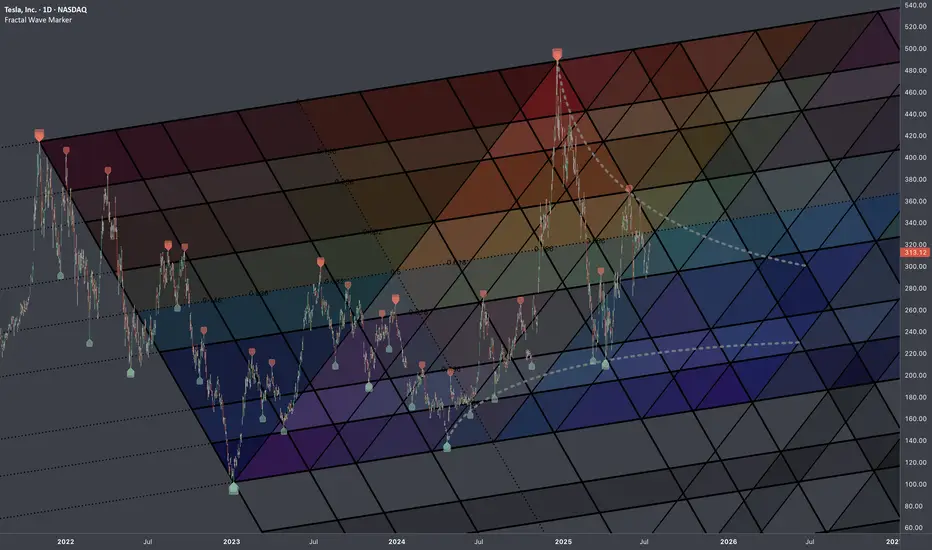
$TSLA: Fib InterconnectionsResearch Notes
Examining interconnection type with regressive angle:
Critical points:
Mapping with 3 fibonacci channels:
ETHUSDT.PHello friends
Given the good growth we had, the price has made a 14% correction. If the specified support is maintained, the price can see the specified targets. If the support is broken, the price can fall by another step. We have identified important support points for you.
*Trade safely with us*

SPX BUY MARKETHello friends
Given the decline we had, the price was well supported in the support range and broke its resistance with a strong wedge, showing that buyers entered and it can move to the specified targets.
Observe risk and capital management.
*Trade safely with us*


RKLB: Elliott Wave Analysis. TARGET $71
RKLB is in its final move up to complete its fifth wave in wave three.
If W1=W5 target is 71.
After this move a deep retracement likely a complex Wave 4 should unfold before we see continuation to the upside.

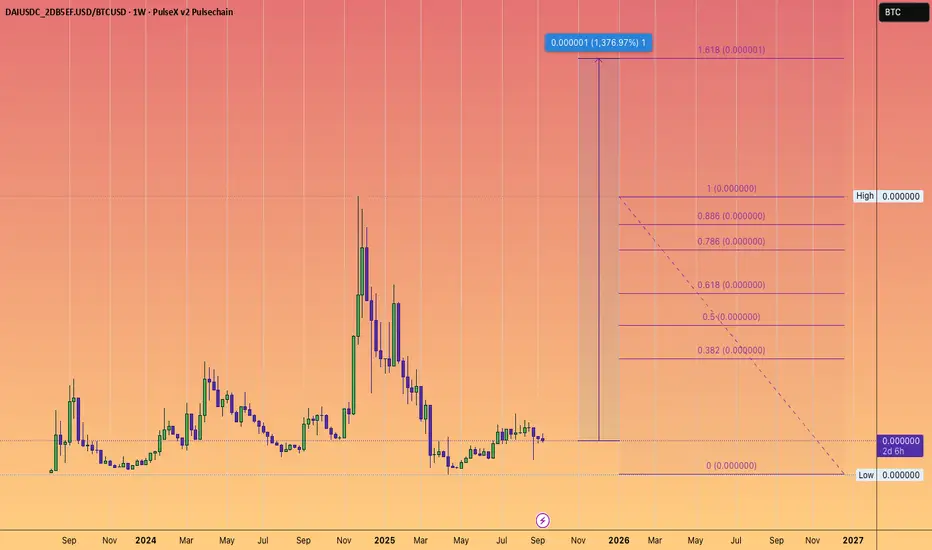
This coin did 152X v Bitcoin previously. Can it do a 15x now?I am just presenting price action with this idea share.
But during manic periods of speculation, all rational thought will go out the window.
That we know for certain
How else can you rationalise a forked copied uncollateralised stablecoin that ran up so hard versus #Bitcoin in the past...?
You tell me.
Clearly there must be some sort of community behind this price rise?
Some sort of thesis?
A narrative?
Or at least some sort of on chain evidence of work being done to describe this move?
YES
YES
YES
& YES there is!
#DYOR
#PDAI
#PULSECHAIN
#RICHARDHEART


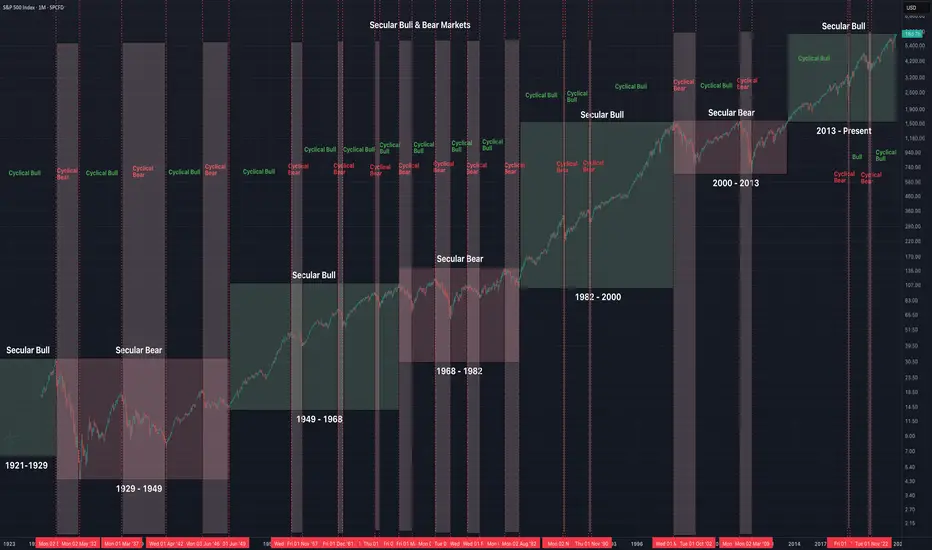
Secular & Cyclical Bull & Bear MarketsSecular vs. Cyclical Bull & Bear Markets (S&P 500, 1921–Present)
Secular Market Cycles (long-term)
Secular Bull:
1921–1929
1949–1968
1982–2000
2013–Present
Secular Bear:
1929–1949
1968–1982
2000–2013
Cyclical Market Cycles (shorter-term swings inside secular trends)
Cyclical Bears: 1929–1932, 1937–1942, 1946–1949, 1956–1957, 1961–1962, 1966, 1968–1970, 1973–1974, 1976–1978, 1980–1982, 1987, 1990, 2000–2002, 2007–2009, 2020 (COVID), 2022.
Cyclical Bulls: 1932–1937, 1942–1946, 1949–1956, 1957–1961, 1962–1966, 1966–1968, 1970–1973, 1974–1976, 1978–1980, 1982–1987, 1987–1990, 1990–2000, 2002–2007, 2009–2020, 2020–2022, 2022–Present.
Key Takeaways
Secular Bulls tend to last ~13–15 years on average, delivering powerful long-term gains with multiple smaller cyclical corrections along the way.
Secular Bears last ~13–16 years, usually defined by sideways price action with sharp rallies and deep drawdowns, leaving investors flat or negative after inflation.
Cyclical Bulls average ~4–5 years, while Cyclical Bears average ~1–2 years.
The current secular bull began in 2013 after breaking out of the 2000–2013 range.
if history repeats, i guss that this is the target...read all halvings ! u can see that there is a bit of repetitive patern !

ETH - When In Doubt Zoom Out!!! 9/11/2025This is my personal top prediction. I don't post often, but I can't call the top after it happens. I'm not looking for any followers, but I do want to keep getting better at trading. The only way to do that is to hold my ideas accountable and put them out into the world.
This also is IMO confirming my last post price target of the Cup & Handle 🎯 Breakout Target from when ETH was in the $2,100 range. Please let me know your thoughts.
Thanks,

US CPI Number? Lets see What Crude Is Telling us... Today is the US CPI one of the most important events before the Fed’s next move
I’ve often used the relationship between US CPI and Crude oil, and it has been a reliable guide many times before.
Key points
👉Crude was down -8.5% in August → we may see a suprise with lower CPI
👉 Official expectations are for higher CPI: from 2.7% to 2.9% y/y → risk of a miss
👉Even if CPI hits 2.9%, dollar may not rally far → because its expected number
👉Dollar bottomed in Sep 2024 after Fed made 1st cut in while→ weak USD risk remains till FED cuts, then reversal
