USDZAR - Forecast, Outlook and Market WatchHello fellow Market Watchers ☕
Today I'll take a top-view look at the USDZAR chart. And since I am in South Africa, this pair is of particular interest to me.
Now recently, the US introduced a 10% baseline tariff on most imports and lifted metals tariffs to 25%. Additionally, citrus, nuts, grapes and wine have been subjected to 30% duties since Aug. 7.
There is no doubt that in the short term, this will cause ripple effects throughout the economy but in the long run, South Africa will find new trading partners - this is how trade works. This will likely extend to Asian markets. The priority is to export more to China, where duty-free access has already been secured for five types of fruit (unsure which fruits these are).
South Africa will continue to strengthen ties with other countries to lessen reliance on the US for exports. Therefore, this is merely a short term hurdle.
From the monthly perspective, we see a clear peak. A double top marks the price where sellers are ready to dominate:
Although we've had two bearish micro-cycles (lasting just over two years and a year respectively), the multiyear trend has been bullish - almost "up only" since August 2011.
July US inflation cooled, so markets still expect the Fed to cut rates in September. Futures point to a strong chance of a 25 bps cut, and the dollar has lost some momentum. When rate-cut odds rise and inflation-adjusted US bond yields fall, higher-beta currencies like the rand often firm up.
However on a bullish note for the Rand, the South African Reserve Bank (SARB) cut the repo to 7.00% in July and said it aims at the bottom of the 3–6% target band, while June CPI printed 3.0%. This is optimistic news for the Rand, and further supports a decline on the chart.
What to watch next
• Fed path into September. Base case: a 25 bps cut.
• DXY (the US dollar index). Softer DXY tends to help ZAR.
• US real yields from the Treasury’s par real yield curve. Drifting lower is rand-friendly.
• Powell at Jackson Hole. A tougher tone on inflation could cap rand gains.
10 Year Treasury Inflation-Indexed Security - Lower US real yields usually lift demand for higher-yielding EM assets, leading to Rand strengthening.
DXY - A softer DXY = less broad USD strength, ZAR increases/strengthens
Gold and Platinum - If these increase, that supports SA's exports and likely helps the Rand considering the export volume. It should be noted that platinum gains will be limited by the new metal tariff at 25% if exporting to the US . In 2023, South Africa exported approximately $16.2 billion worth of platinum globally. Of this, about $3.42 billion went to the US. That works out to roughly 21% of South Africa’s total platinum exports being destined for the U.S.
I asked my friend GPT to put it in a table and got this helpful result:
So to summarize:
As of today (18 Aug 2025), markets still lean toward a Fed rate cut in September, with odds around the mid-80s, which has taken some heat out of the dollar and kept real Treasury yields anchored near ~1.9%—a mix that’s usually rand-friendly.
Locally, SARB’s July move left the repo at 7.00% while June CPI printed 3.0%, so South Africa still offers positive real carry. Firm gold prices and subdued equity volatility also help sentiment. The main offset is trade policy risk, with the new 30% US tariff on many South African imports clouding the export outlook and current account. Net-net, if US data stay calm into Jackson Hole, the bias tilts to a softer USD against ZAR.
Economic Cycles

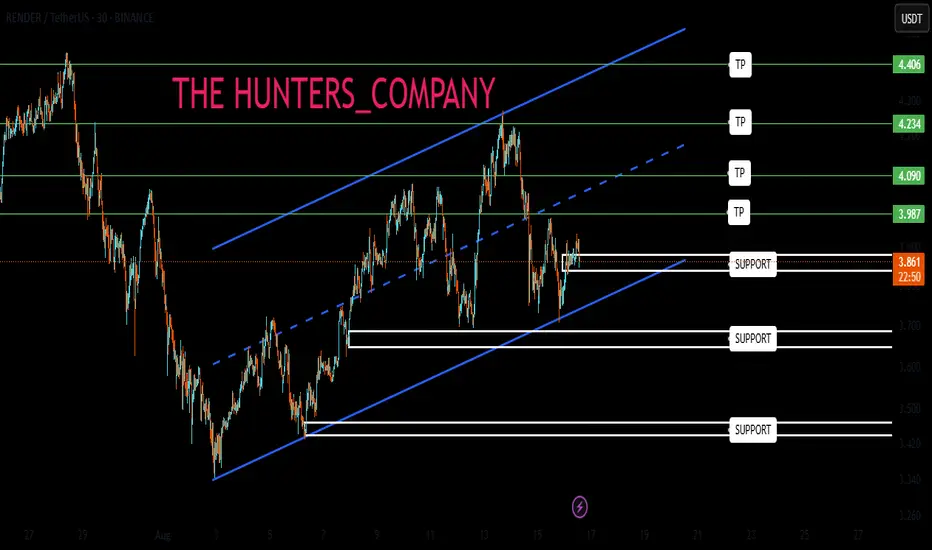
RENDER: Buyers arrivedHello friends
Given the decline we had, we see that buyers entered and created an ascending channel.
Now that we are at the bottom of the channel, we are in an important support area.
Of course, two other important support areas are also located further up, which if supported by the price, can move to the specified resistances.
*Trade safely with us*
Ski Mask Dog | SKI | Long at $0.06Whelp... I'll leave it to the "crypto bros" to explain the value and utility of Ski Mask Dog COINEX:SKIUSDT , but Congressman Mike Collins knows something I don't. He's purchased between $10,000 and $150,000 of the alt coin between December 2024 and June 2025 at an average price of $0.08 (assuming the purchases were equally valued). Here is the reference: www.capitoltrades.com
Even if it was only $10,000 of the coin, why would he even bother given the strength of other coins... unless he knows something...
I suspect he does.
Thus, at $0.06, I just filled my wallet with a fair share and I'm going to let it ride. Pure gamble.
Targets into 2028:
$0.12 (+100.0%)
$0.25 (+316.7%)

SP500 ETF: Fibonacci MappingAs you may know, Williams Fractals indicator identifies potential reversal points by marking a high (or low) surrounded by two lower highs (or higher lows) on each side, forming a five-bar pattern that signals possible turning points in price. Unfortunately, the simplicity of such indicator provides just tiny perspective, undermining broad implication of the concept.
Before I begin diving into processing geometric narrative of emerging price via fibonacci channels, I want to explain how I interpret fractals.
When I use the term "fractal", I'm not just talking about the points alone. Market continuously corrects itself, so analyzing it by price alone can bring more confusion than help. The object of observation shouldn't be limited to quantifying just by a single property. Chaos by default requires awareness from both price and time aspects. The easiest way to root it in my vision was through realization that price is a function of trading time intervals. Its activity can be described as cyclical progression, as if it is wired by multiple "springs" of different tensions.
Classic TA patterns known to literally anyone are great for anticipating a move in surface level forecasts. Since my line of work focuses on prediction over forecasts, it requires deeper structural awareness behind complex oscillations.
Let's observe the way selloff scales from ATH and how it impacts fractal hierarchy.
The first corrective bullish wave can be explained as a reaction to initial impulsive bearish wave. The bigger scale drop from ATH to a lower point explains why the corrective bullish wave looks the way it is. And so on:
In fractals, scaling laws describe how key properties change with size, typically following power-law relationships that reflect the structure’s self-similarity, where a characteristic scales with the size raised to an exponent.
To build a probabilistic model, we must keep in mind how the smaller bits make up bigger scale picture. ATH, established bottom and angle of progression defined by pullback highs, all those points have structural weight. Since psychology of masses that shapes price dynamics is governed by mathematical sequences found in nature, it's fair to use Fibonacci Channels to map the geometry of interconnectedness.
Similarly, all of those points can be referred by another fibonacci channel with opposite direction.
From my perspective, traditional TA patterns reflect just phases of cycle, this is why I unify those fragments into broader scalable shapes. This distinctive branch of Fractal Analysis allows to track systematic aspects of market behavior and explains how a pattern replicates itself in rhythmic continuity.

$XRPUSD: Limits of Expansion🏛️ Research Notes
Documenting interconnections where historic area and coordinates of formations are used to express geometry of ongoing cycle.
If we scale out the chart back starting from roughly 2016, we can see more pretext like how the price was wired before decisive breakout from triangle.
Integrating fib channel to the angle of growth phase of the previous super-cycle, so that frequency of reversals match structural narrative.

XUSDT on the Path to Higher PricesAccording to the chart, a buying opportunity has emerged for a potential XUSDT uptrend. Please make sure to apply proper risk management. As for me—I never do, but hey, I’m not sure about you!

Bitcoin end of bull run 2025Long-term Bitcoin cycle analysis showing two potential scenarios for Cycle 4 and beyond.
Scenario A (blue): Price action replicates previous cycles, staying under the long-term trendline through cycle tops.
Scenario B (red): Parabolic end, breaking above the long-term trendline.
Key cycle tops, bottoms, halving dates, and notable RSI bearish divergences are highlighted for context.
I am more leaning toward the scenario A as every youtuber are leaning toward the scenario B.

The Crash of CryptoFractal of 2021 crash. BTC is slowly being compressed, Forming a rising wedge, rejecting from the top.
Expect to see it hit around 80K
BTC’s historical cycle tops vs. prior cycle lows:
2011 peak: ~+50,000%
2013 peak: ~+7,500%
2017 peak: ~+2,000%
2021 peak: ~+600%
Logarithmically decline each run

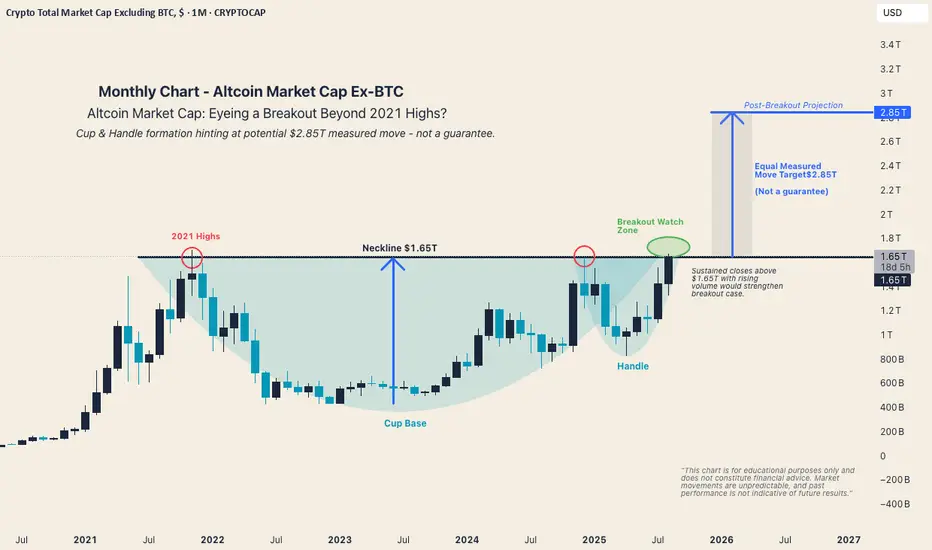
Altcoin Market Cap Approaching Major Breakout ZoneThe altcoin market cap (ex-BTC) is retesting the $1.65T resistance, the same zone that marked the highs in 2021 and early 2025.
A developing Cup & Handle pattern points to a measured move projection of ~$2.85T if a confirmed breakout occurs.
Breakout Criteria:
Monthly close above $1.65T
Rising volume during breakout
Retest holding as support
⚠️ This chart is for educational purposes only and is not financial advice. Market conditions can change rapidly, and past performance is not indicative of future results.
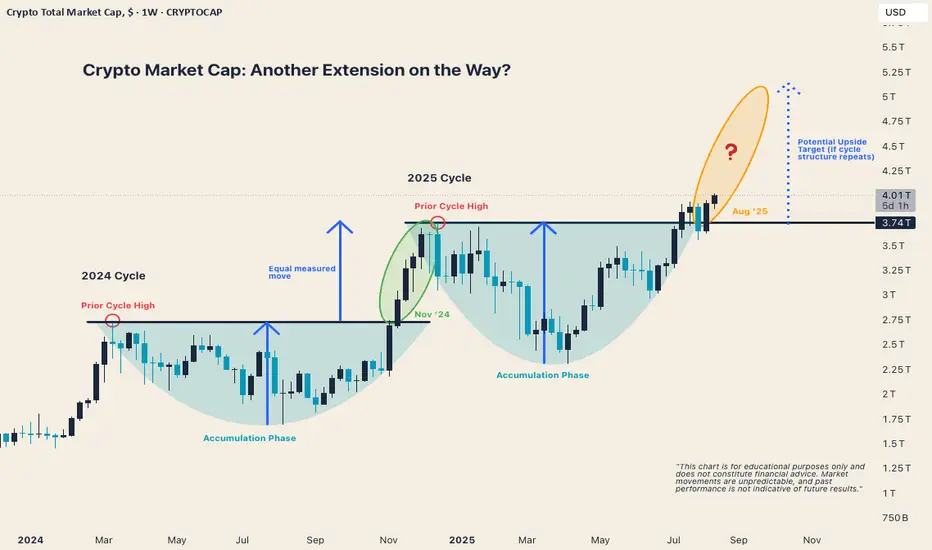
Crypto Market Cap: Another Equal Measured Move in Play?In 2024, the market delivered a textbook equal measured move after breaking out above the prior cycle highs.
Now, in August 2025, we’re breaking out again above the 2025 prior cycle highs. If this structure repeats, the potential upside could target around $5 trillion in total crypto market cap.
This setup doesn’t guarantee the same result, but it’s a compelling pattern to watch closely.
This chart is for educational purposes only and does not constitute financial advice.
Has Gold finally topped?Since December 2024, gold has held above a key diagonal support line (see chart).
On 25 July 2025, price broke below a medium-term diagonal support — and recent action looks more like a break-and-retest than a full recovery.
The Chaikin Money Flow is also showing negative divergence, suggesting buying pressure is weakening even as price tried to push higher. That’s often a warning sign for potential trend reversals.
Could this be the start of a deeper move down, or just a pause before new highs?
What’s your take — has gold topped?

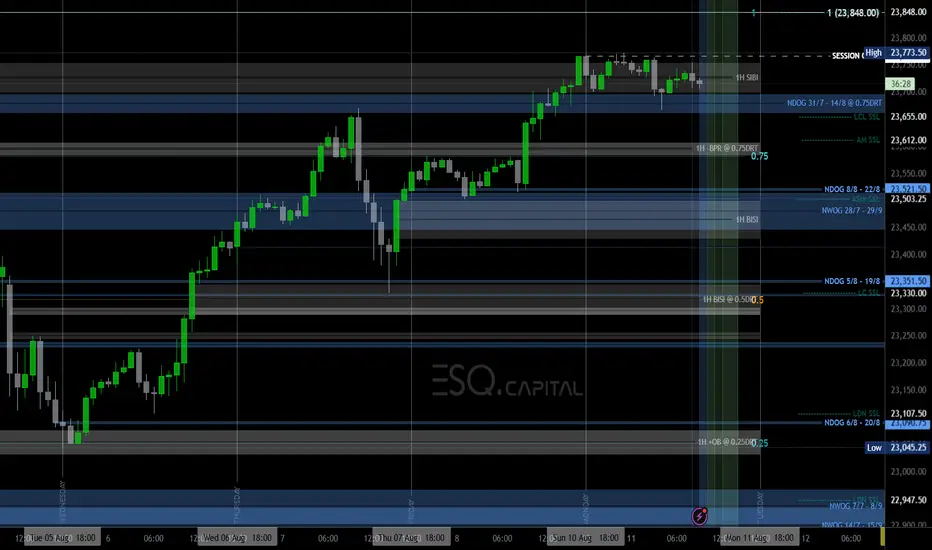
MNQ INTRADAY - COULD WE SEE PRICE AT 23,450 AGAINAt the time of this Idea - Before the Opening Bell on Monday 11th August 2025, CME_MINI:MNQU2025 appears to be respecting the Premium-High it finds itself in.
This could mean that price may MOVE OUT of a buyside-program where higher highs are achieved, as buyside liquidity is sought, and into a sell-side program where discount areas of interest are engaged and a descent in price occurs.
Could we see CME_MINI:MNQU2025 reach down towards 23,450 during this trading session, or will tomorrow's pending core inflation figures cause today's price action to stall in anticipation of the release of the reports?
Also look out for U.S. trade tariff related developments that may pull up any surprises.
Profitable trading guys!
NIFTY BANKDeveloped head and shoulder pattern, neckline broken which is sl for this and possible target in chart. Also in wave 3 or C now in lower degree. I am not SEBI registered analyst. This is not buy, sell and hold recommendation.

Bitcoin’s Triple Bullish Pole Sequence Next Stop $184K+? Bitcoin’s long-term bull run is unstoppable, powered by a sequence of bullish flag and pole formations. The first pole delivered $63K. The second is still in play, aiming at $198K. The third, born after a breakout above its own flag and the all time high, now eyes $184K with price cruising above $121K.
Since late 2023, a rock solid ascending trendline has been the market’s backbone, holding as dynamic support through every pullback. The immediate demand zone is your prime reload spot if price dips, while the main demand zone is a fortress level support for future positioning.
Momentum is strong, structure is flawless, and the path toward those pole targets remains wide open as long as support holds.
Now’s the time let’s ride this bullish wave! Drop your altcoin requests in the comments like we always do, and smash that like button to keep the energy flowing. 🚀

Fibo golden ratio why btc is dumpingIts clear that its fib 1.618 sits in 122k it rejected hard the corn and might really signaling the start of bear market i will never be surprised if price will still increase since we need sacrifice so we can dump it more 🥏 and i expect more blood coming.

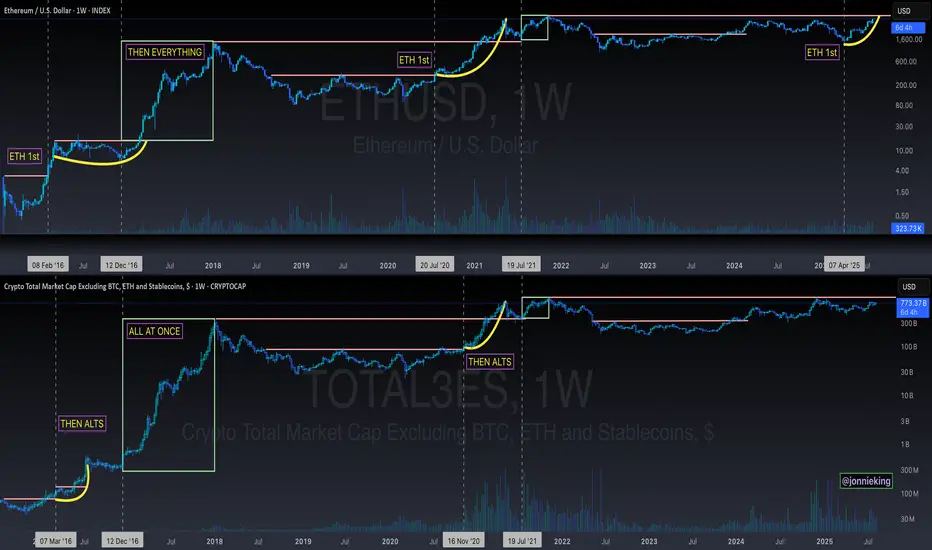
ETH > Alt Season Historical LookTHE STAGES OF ALT SEASON
ETH > Alts > market collectively corrects > Everything All Together
Alts are gonna absolutely rip your face off once ETH convincingly breaks its ATH.
AUDUSD BuyPrice reacted from a favorable POI as it took liquidity. Daily cycle is being completed as Asias session should be taken out.

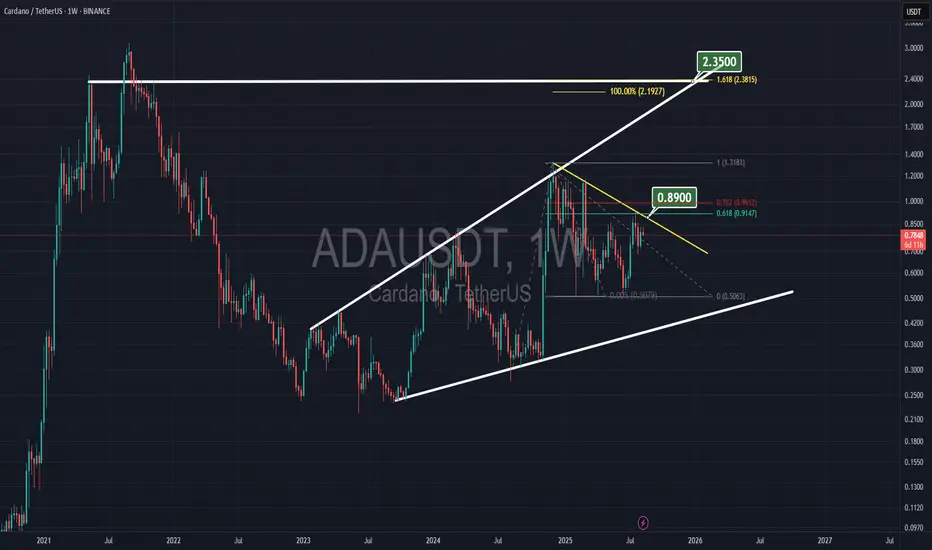
ADA to $2.40Cardano is within a broadening wedge, with a top of $2.35 in October 2025. The 100% Fibonacci level is at $2.20, and the all-time high is around $2.40, creating multiple resistances between $2.20 and $2.40.
Euro dollar rollover at the ML & at resting on the edge of priceThere is plenty more going on via Gann MTF & Annual Forecast but technically on the forks the Euro should head to the new median line with approximately an 80% probability. If we get momentum on the sell off and later the new median line ( Downward Pitchfork ) gets breached decisively via a Zoom Bar/Retest, we may get all the way down to the second target as shown. looking for additional shorts on the lower TF. Cheers

Nifty Bank IndexFormed bearish bat pattern and also appear wave b. I am not sebi registered analyst, Its not buy, hold and sell recommendation.

short bias for usdchfif price comes to this order block and gave us mss in lower time frame we can short

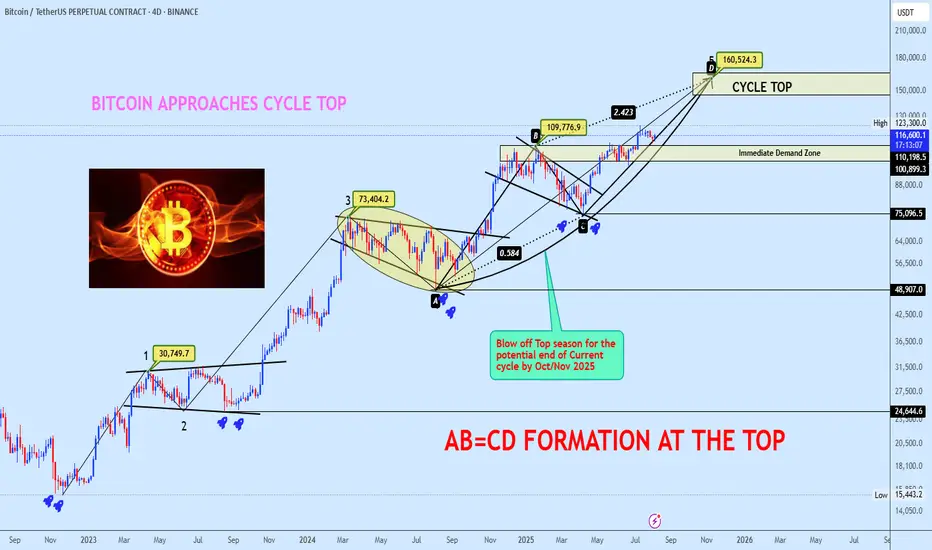
Bitcoin Approaches Cycle Top with AB=CD Completion in SightBTCUSDT continues its bullish macro structure, now advancing towards the projected cycle top zone at $160,524, completing a textbook AB=CD harmonic formation. The BC leg retraced precisely 0.584 of AB, aligning with a 2.423 CD extension, confirming a strong harmonic symmetry.
Price is currently trading around $116,569 after breaking through key resistance levels, with the Immediate Demand Zone resting at $110,198. This zone will act as the first major defense level if a short-term correction occurs.
Market structure suggests a potential blow-off top formation into October/November 2025, marking the probable end of the current cycle. Do check out our Bitcoin lifecycle thread for clarity on the reason for picking cycle top.
POTENTIAL BITCOIN LIFECYCLE
Deciphering Bitcoin's Cyclical Trends & Phases
Momentum remains firmly bullish, with the upward curve indicating buyers remain in control until exhaustion patterns emerge near the cycle projection zone.
Plan: Hold long positions into strength, scale out as BTC approaches the $160K cycle top zone, and prepare for a potential macro reversal as the cycle matures. Monitor lower timeframes for divergence signals as we approach the final leg.
If this structure aligns with your outlook, feel free to share your thoughts in the comments.
You’re also welcome to drop your preferred altcoins for a quick technical review.
ETHUSDTEthereum will definitely return from this price range to the target of $4000, the price range is the price retracement ($1428-$1125-$802).
