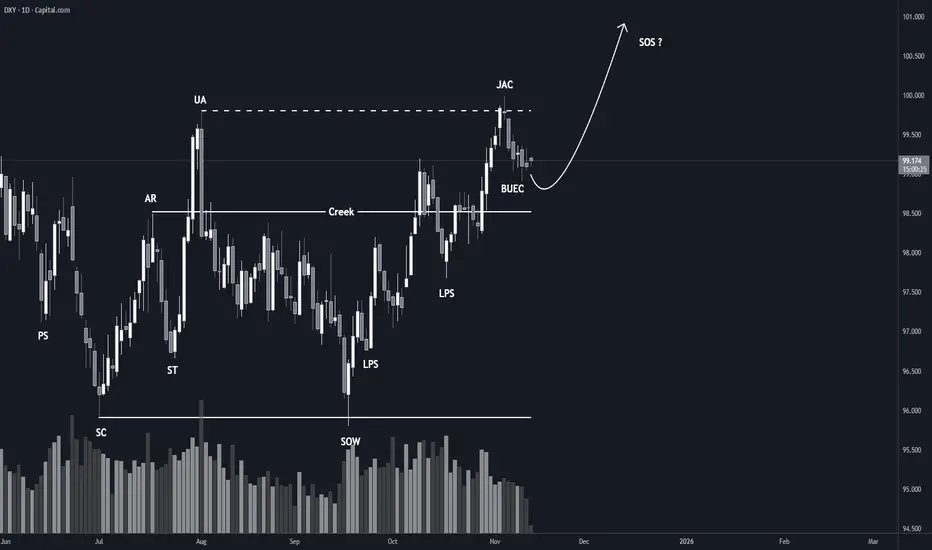
BTC is going up BTC has the potential to rise from this its curent price of 98292
to 116551 , A key suport level to watch is at 92278. BINANCE:BTCUSDT
Economic Cycles


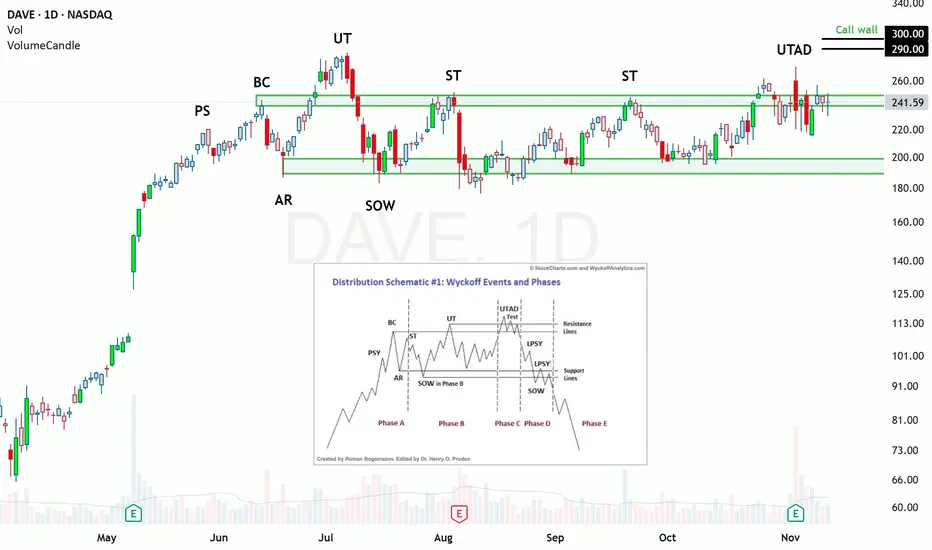
Is DAVE a Bull Trap? A Wyckoff Distribution take DAVE is flashing elements of a Wyckoff Distribution and could be setting up for a pullback soon. The market moves in cycles: buy low, uptrend, sell high, downtrend, repeat. The sell high part is what we are interested in for today's chart. Wyckoff theorized that you could identify when participants are finally starting to sell their shares by analyzing price and volume. The process is roughly outlined via his trading schematics.
*Note: The indicator on the chart highlights bullish and bearish candles that have above average volume for easy identification.
Phase A is all about stopping the uptrend. DAVE had a monster run from its previous earnings and we see our first evidence of profit taking at the PS. The buying climax (BC) is met with a large red sell candle with above average volume.
Phase B is about shedding shares. Note the wide candle spreads and large selling volume after the UT. Now that a range has been identified, institutions will use it to manipulate price and exit their positions. Note that the large volume days only appear at the top or bottom of the range.
Phase C is optional but I believe we are currently in it. Phase C is a test to see if there are any more buyers out there before they enter the downtrending phase. Institutions will break price above the trading range to make it seem as if the trend will continue to the upside when, in reality, they are loading up the short trade.
I have observed that this most recent earnings report has caused significant volatility. I am looking for institutions to try to send price higher. I think 180-190 would be ideal. That price is just around the initial UT high, and many traders are watching for new highs. The downside target would be about $110.
Please let me know your thoughts.
ASDIONMid term and long term investment
GN 3 counter
Financial report recovery and profitable in year 2025
Hope Asdion Release from GN3 in year 2026
Price will boom..

DOGECOIN : LIVE TRADEHello friends
According to the technical analysis conducted, we can say that with the entry of buyers in the pullback and their support of the price, it is possible to enter the transaction with risk and capital management and move with it to the specified goals.
*Trade safely with us*

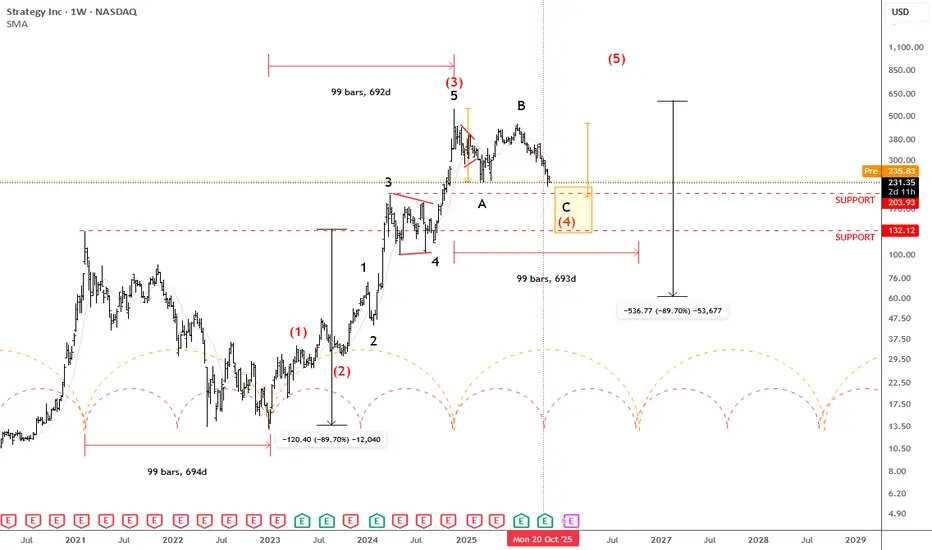
MSTR Trading Close To Support Based on Elliott wave and CyclesMicroStrategy has seen a strong uptrend since the December 2022 lows, but over the last year the market has been in a retracement phase. It appears that this could be another A-B-C setback within a higher-degree wave four, where subwave C could potentially retest the 200 area, or even extend toward the deeper 132 support. That level also aligns with the February 2021 high, making it an important zone to watch.
Cycle-wise, it looks like we’re currently in the middle of a full cycle, suggesting that the correction could be moving into second half of this retracement, and may come to an end within the next few months. Ideally, we could then see a new turn higher in 2026, continuing the broader bullish trend.
Highlights:
Trend: Corrective pullback in wave four
Support: 200 / 132
Cycle View: Mid-cylce; possible new rebound early 2026
Note: Structure fits within a broader five-wave bullish sequence, with strong long-term trend intact
GH
ARUSDT Gearing Up for a Powerful Wave 3 LaunhARUSDT has completed its corrective phase via a well defined ending diagonal, followed by a strong impulsive move completing wave 1. Price recently tested a significant supply zone, leading to a sharp retracement toward $4.48, aligning with the previous bottom structure.
This zone is projected to form the immediate base, and our plan is to accumulate within this range, targeting the anticipated wave iii, historically known as the strongest and most extended move in the Elliott Wave sequence.
The entry plan and potential targets are clearly outlined on the chart. Feel free to share your view.

Gold. About the time for 5400 pips. 12/Nov/25Xauusd is timing boom for 5400 not just 5300 pips drop as previous ideas..


Mantle Bearish Chart showing Alts Bear phaseCentralized Exchange Tokens always leads the Alts bull phase and generally ends 1 month after Eth and Alts top out. This chart is clearly showing a Pattern which indicates that their could be a flush out of the Alt coins again. Alts Bearish Phase is ongoing currently.
"XAUUSD"In the previous analysis, we wrote that the global ounce would be in a downtrend until November 10. Now, time will favor the buyers. We also expect that until November 19, buyers will have the opportunity to push the price of gold higher. We’ll have to see how much the price increases by the mentioned date!
My initial forecast targets around $4,150, but nothing is certain.


Long on Silver FuturesThis is an update on the long-term bull trend in silver as reflected in the futures market. First, the uptrend channel was reentered after a short breakout. This correction is good. It is strong as the heart line has not been broken and is seeking higher levels to break back out of the channel for the parabolic run. I am looking at a 49.80 USD marker to signal a true run back into price discovery.

VeChain revisits its 2020 demand zone## **VeChain (VET/USD) — Macro Structural Analysis | Monthly Outlook**
### 🧭 **Market Context**
As of **October 2025**, VeChain (VET) has returned to the **same macro demand zone** that formed in **October 2020**, the foundation of its previous bull cycle.
The **flash crash this month** brought the price down to a historical accumulation level between **$0.009 – $0.013**, creating a structural mirror of the early 2020 setup before the 2021 rally.
This move suggests that VET is now testing a **critical long-term support**, aligning with the broader market phase where altcoins typically consolidate before a new expansion cycle.
---
### 📊 **Technical Structure**
* **Support Zone:** $0.009 – $0.013
* **Resistance Range:** $0.035 – $0.050
* **Macro Invalidation:** Monthly close below $0.009
The current monthly candle shows **a deep wick and strong price rejection**, signaling possible *liquidity absorption* at the lows.
Maintaining this structural base above **$0.013** could confirm a **macro bottom formation**, with potential continuation toward **$0.05 – $0.07** during **Q2–Q3 2026**, particularly if **Bitcoin dominance** begins to decline as projected.
---
### 🪙 **Fundamental Overview**
VeChain remains one of the leading **enterprise-focused Layer-1 blockchains**, providing real-world solutions in **supply chain management, logistics, and carbon tracking**.
* **Market Cap:** ≈ $1.25B
* **Circulating Supply:** ≈ 72.5B VET
* **On-Chain Metrics:** Stabilizing activity and rising VTHO consumption indicate renewed network usage.
This fundamental resilience supports the idea that VeChain could be entering a **re-accumulation phase**, mirroring the 2020–2021 structural rhythm.
---
### 🔭 **Outlook**
If this historical symmetry continues, VeChain could remain within a **sideways accumulation structure** until **April 2026**, before initiating a new bullish expansion phase.
A confirmed break above **$0.035** would likely mark the first signal of structural recovery across the altcoin sector.
---
### ⚠️ **Disclaimer**
This analysis is for **educational and informational purposes only** and does **not constitute financial advice**.
All opinions represent my **personal market perspective** and may change without notice.
Trading cryptocurrencies involves **significant risk**, and investors should perform their own research or consult a licensed financial advisor before making decisions.

Personal Account vs Prop firm TradingHere’s where a lot of traders miss the point.
Prop firms sound good on paper — funded accounts, big leverage, short-term payout structure. That’s attractive to retail and newer traders. But let’s be honest — true SMC traders see deeper.
A prop firm is a classroom. A personal account is freedom.
⚖️ Prop Firms:
• Beginner-friendly, structured, and can help build discipline early.
• But they come with strict rules — max drawdown, time limits, no weekend holds, no high-impact news trading.
• These rules can kill genuine SMC plays, because Smart Money often holds setups that develop midweek and deliver through Friday.
• Some prop firms even close trades automatically during volatile pullbacks — meaning your well-timed institutional entry could be cut off early.
Prop firms test you on rule-following, not market mastery.
💼 Personal Accounts:
• You control risk, timing, trade management, and exposure — full freedom.
• You can hold trades through the weekend, manage partials your way, and let multi-day structures complete.
• You can size positions sustainably — not recklessly, but with intent — and manage equity growth over time.
• It demands mastery, discipline, and emotional control — but that’s the essence of becoming a true trader, not a funded participant.
“Prop firms build discipline. Personal accounts build legacy.”
🧭 My Take:
I respect prop firms — they have their place. But I’m a personal account believer.
Why? Because Smart Money Concepts require freedom to express trade ideas dynamically, without artificial restrictions.
A true SMC trader isn’t trying to pass a challenge — he’s trying to understand and move with the market.
Prop firms serve the student. Personal accounts serve the master.
✍️ Closing Statement
“The real education starts when you stop testing history and start studying live footprints.
Prop firms can train your discipline, but personal mastery is built when your decisions shape your own equity.
Trading is not about probabilities — it’s about reading precision, cause, and intent. That’s the Smart Money way.”

Statement on "Why Backtesting Doesn't Work (Proper SMC Edition) Why Backtesting Fails for True Smart Money Concepts Trading (and what you must do instead)”
When you trade using SMC — meaning you’re analysing structure, inducements, order-flow footprints, liquidity sweeps and institutional behaviour — you’re not simply trading fixed setups that repeatedly behave in identical ways. That means the classic “backtest historical data, cycle optimized entry, rinse & repeat” mindset breaks down.
Here’s why:
1. Uniqueness of each market scenario
Institutional footprints don’t repeat like mechanical patterns. Liquidity and order-flow respond to current context: structural highs/lows, prior supply/demand, inducements, time of day, major news, correlated markets, market sentiment. So what happened last month may look similar, but the underlying cause & effect will differ.
2. Hidden Smart Money behaviour
Smart Money isn’t labelled on the chart. You don’t have a tag “institutional buy here” in history. You’re inferring it via structure, retests, inducements, inefficiencies. These signals evolve. Backtesting that uses rigid rules can’t properly capture the nuance of when and why Smart Money enters.
3. Changing context and fractality
The market is fractal: your higher-timeframe structure influences the lower timeframes, but the exact interplay shifts. Backtesting often ignores this evolving interplay. The same trigger on 30M may have a different consequence depending on the 4H structure. That means the recycled historical trigger won’t always behave the same.
4. Emotion, flow, and live execution
You can test entries historically, but not replicate the live environment: real-time spreads, slippage, late reactions, news shocks, liquidity vacuum. On top of that, your emotional state in live execution adds variability. Backtesting doesn’t generate the same pressure. If you rely on backtested “perfect” outcomes, you’ll be unprepared for the live market’s messiness.
5. Forward skill development beats retro “rules”
The real value is not in optimizing past data but in sharpening your forward-looking skill: reading structure, reacting to inducements, identifying the moment Smart Money acts. That means you must practise in live or near-live conditions (smaller size, low risk) to train your brain, your timing, your discipline.
In summary: Backtesting treats the market like a fixed machine; SMC trading recognises the market is an adaptive ecosystem. Your edge is in identifying intent, reading footprints, and executing in live time — not relying solely on historical “this pattern worked 7 of 10 times”. Train the skill live, respect structure and inducement, and your entries will come from genuine alignment, not forced replication of old outcomes.
Stay sharp. Stay structured. And always ask: “Where is Smart Money acting now?”, not “What happened historically?”

Zulu PrincipleJim Slater beat the market for decades by systematizing quality + reasonable price + momentum—first via a 1960s “earning situations” turnaround playbook, then (1992+) via the Zulu Principle: small/mid caps with fast EPS growth, efficient capital use, cheap vs growth (low PEG), and RS strength, managed by strict quarterly rebalances.
The two playbooks
1) “Capitalist” (1960s turnaround)
Yield ≥ 4%, EPS up in ≥4 of 5 years, EPS ≥ 2× in 4 years
Optimistic chairman’s statement, sound liquidity, no exceptional vulnerabilities
Reasonable asset value, not family-controlled, voting shares
Spirit: early GARP before it had a name—cash-generative, improving earners with robust balance sheets.
2) Zulu Principle (1990s, refined & timeless)
PEG < 0.75 (value vs growth in one metric)
P/E < 20
EPS growth > 15%
12-mo Relative Strength > 0% (price momentum)
ROCE > 12% (quality/efficiency)
Market cap £20M–£1B (small–mid where “elephants don’t gallop”)
Quarterly full rebalance: buy all qualifiers; sell anything that drops off; no in-between adds.
Why it still works
Aligns with the three empirically robust factors: Quality, Value (vs growth), Momentum.
Captures post-earnings-announcement drift by favoring positive EPS surprises and upgrades.
Rules ≫ opinions: removes emotion, enforces discipline via scheduled rebalances.
When few names qualify (tight markets)
Relax one notch (e.g., PEG < 1.0, P/E < 25, ROCE > 10%).
Widen geography (apply the same screen across EU/US/ROW).
Layer news filters (earnings beats, trading updates) on top of the screen.
Ready-to-run screen: www.tradingview.com
Universe: your domestic market + optional global small/mid
PEG (1y forward EPS growth) < 0.75
P/E (TTM or forward) < 20
EPS growth (TTM or forward) > 15%
Relative Strength (12m vs market) > 0%
ROCE > 12%
Market Cap , 1.1x USD
Liquidity guardrails: £5k ~ £20k Daily Volume
Sanity Check: Golden Cross, Price above 50/200 DMA
Portfolio construction & rules
Quarterly rebalance (strict): equal-weight all qualifiers; sell anything that no longer qualifies.
Max names: 20–40 (equal weight); if >40, rank by lowest PEG → highest RS → highest ROCE.
Risk: position size so any single name ≤ 5% weight; optional 15–25% stop from entry if you want overlays.
Costs/slippage: use liquid names (ADV filter) and quarterly cadence to keep friction low.
Upgrades you can test
Replace RS>0% with 6-Month RS > 5% or 12-Month RS > 10%.
Add Net debt/EBITDA < 10× (quality balance sheet).
Require positive estimate revisions in the last 3 months.
Momentum overlay: require price above 50/200-DMA to avoid value traps.

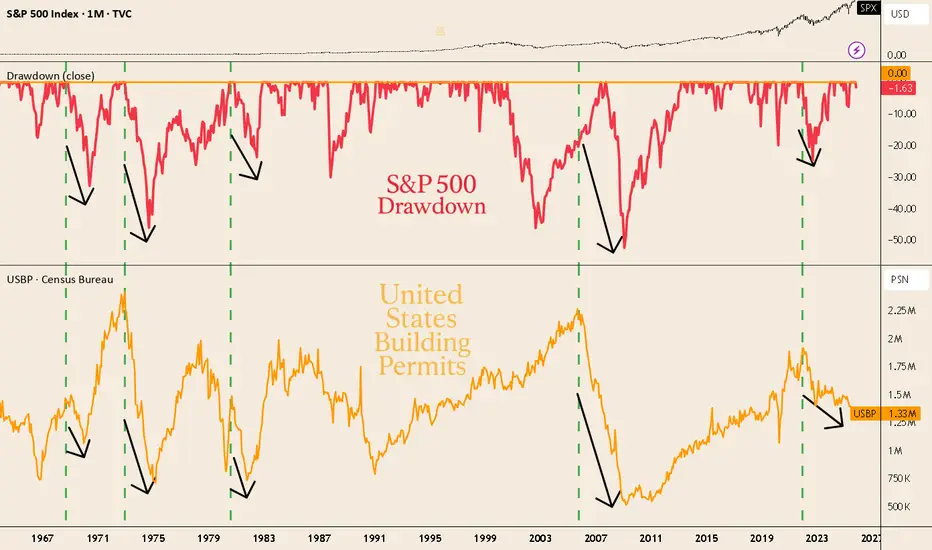
Building Permits: the silent warning behind market cyclesU.S. Building Permits have historically acted as a leading indicator of economic slowdowns.
Each time construction activity cooled — in the 1970s, 2007, and again post-2021 — deep S&P 500 drawdowns followed shortly after.
Today, permits have fallen to 1.33M (−2.3%), while the S&P 500 remains near all-time highs with a minor −1.6% drawdown.
📊 Historically, this kind of divergence doesn’t last long.
When the real economy starts to weaken, the market usually follows.
👉 The housing cycle whispers before the market screams.
(SOL) Spot Long 10-08-2025SOL /We have Government Shutdown Ending, ETF's, Clarity Act, Trump Tariffs Blocked, New Chair of the Federal Reserve, QE, & Maybe Stimulus Checks for the USA Taxpayers all Incoming Soon!
Plus,
Fear = Oversold = I Buy = $
SOL will RISE!
:)

Litecoin Rainbow Chart + Elliott Waves TheoryThis is what I believe will happen to Litecoin in the next years
Litecoin Rainbow Chart indicator (Power Law), combined with the most probable EW counting seems to be simply perfect.
This trade will retire my bloodline
Thank you for your support
Łama

S&P 500 — The Market Cycle Nears Its Turning PointS&P 500 Technical Outlook — The Market Cycle Nears Its Turning Point
Market Overview
The S&P 500 Index continues to follow its recurring market cycle pattern, which typically spans around 10–12 months.
After an impressive rally since mid-2024 that pushed the index to a new high near 6,900, early signs now suggest that the market may be entering the late stage of its uptrend cycle.
Momentum indicators have started to weaken, and profit-taking pressure is emerging — both of which are common signals seen before a mid-cycle correction phase begins.
Technical Analysis
1. Major Trend
The yellow trend lines highlight two major upward waves in this cycle.
Each rally ended with a 10–15% correction before the next advance.
Currently, the index is showing signs of exhaustion near the 6,900 resistance zone — marking a potential top for this cycle.
2. Repetitive Cycle Behavior
The blue dotted arcs represent cyclical market behavior seen repeatedly over the past few years.
If history rhymes, a sharp sell-off could occur around mid-December 2025, forming the next cycle low.
The projected downside target lies near 5,800–5,900, which could act as the base for the 2026 recovery phase.
3. Key Levels to Watch
Resistance: 6,800 – 6,900
Intermediate Support: 6,200
Major Support (Cycle Low Zone): 5,800 – 5,900
Forecaster’s View
“The S&P 500 is likely entering a mid-cycle correction phase after reaching its recent peak.
A sharp decline around mid-December 2025 could mark the turning point before a new accumulation phase begins in 2026.”
Strategic Outlook:
Short-Term Traders: Focus on the 6,200–6,800 range; avoid chasing strength near resistance.
Medium- to Long-Term Investors: Prepare to accumulate near 5,800, which could represent a cycle bottom for this phase.
Cycle Followers: Watch for capitulation or panic-selling around mid-December 2025, often a precursor to the next bullish cycle.
Summary
The current S&P 500 structure demonstrates a clear cyclical rhythm — every deep correction has historically paved the way for the next strong expansion.
If the December sell-off unfolds as expected, 2026 could mark the start of a new major uptrend, turning short-term volatility into long-term opportunity for strategic investors.

Gold has corrected about 10% from its recent highGold has corrected about 10% from its recent high after a strong rally earlier this year.
However, the long-term trend remains bullish, suggesting that the market may move sideways for a while to consolidate before the next upward leg begins.
In the short term, gold still has room for a technical rebound, with key resistance levels at
$4,080 / $4,135 / $4,190 per ounce.
If prices drop below $3,900, investors should be cautious —
a deeper correction could follow, potentially testing the next major support zone near $3,550–$3,600.
“Gold remains in a long-term uptrend. This pullback may simply be a pause — not the end of the rally.”
