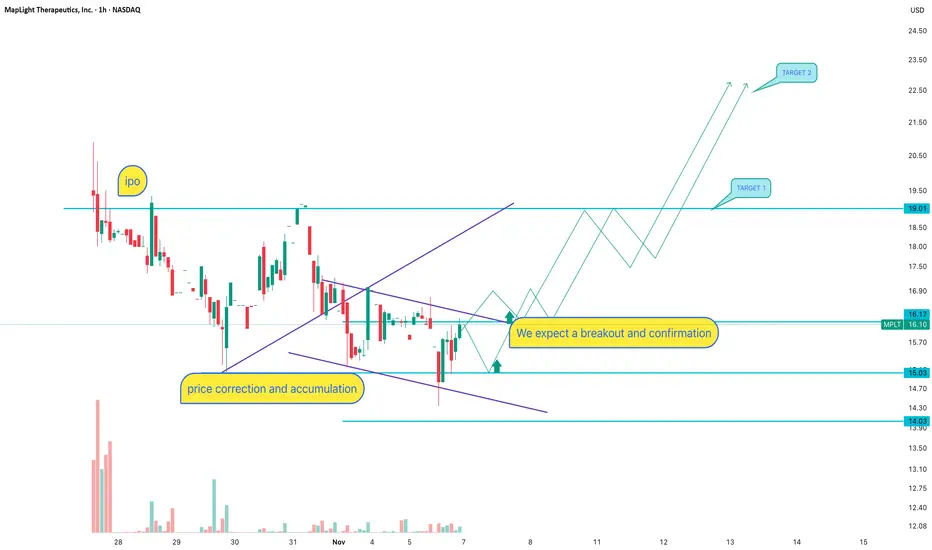
MPLT: Is the IPO working according to a scenarioAfter the IPO, the stock is forming a falling wedge — a classic post-listing accumulation pattern. Price is consolidating between the 15.03 support level and the accumulation zone. We see a trendline breakout attempt and price trying to hold above. The key resistance is 19.01, aligning with the previous consolidation range. Lowering volume indicates seller exhaustion. Scenario: breakout above 16.20 and confirmation gives a path toward target 1 at 19.01, with a potential impulse toward 22.50 (target 2). Entry only after breakout + retest. Without a retest, the risk of a fake breakout increases.
MPLT is a biotech company newly listed on NASDAQ. Post-IPO stocks often go through correction and accumulation while the market defines fair value. FDA updates or clinical trial results can act as catalysts — biotech names tend to move aggressively on news. If institutional interest increases, the trend may accelerate quickly.
If the breakout confirms — the rocket won’t wait for you to fasten your seatbelt. Let price show direction instead of forcing an entry inside noise.
Economic Cycles
BITCOIN's PUMPs are Getting LARGER this Bull Market...However, it may take a bit longer to realize those expansionary moves.
If Bitcoin adheres to the established cycle pattern, we can anticipate a minimum surge of 103% that should carry us into the fourth quarter of this year.
Consolidation ----> Fake breakdown ----> then expansion.
Are you ready?

BTC Cycle Low November 2025I was checking my cycle count, to see when to expect the next low. If my count is correct it should come around november 24th. It wasn't easy to track this the past 180 days, so it can deviate a little bit. It's also expected to see a weekly cycle low in the near future which always arrives in extreme fear, so be prepared.

KOMODO Did a Full 0.886 LOGARITHMIC reset. The question is now.
What is left behind in the rubble.
There seems to be working products and ongoing development.
I assume much if not all bag holders would have left in search for riches elsewhere.
Will they return for a recovery rally?

I'M GETTING READY TO LOAD UP ON SMCISMCI gaps down for a long awaited correction. earning were not so good but this stock has a history of reacting badly to ER and than recovering. NOTE that the company is growing just not as the wallstreet analysts want it to. im getting my shares off this discount. SEE YOU BACK ON 53$!!

Key BTC hourly swings Based on mathematical and trigonometric calculations.
Access to higher time frame price swings is available for free.

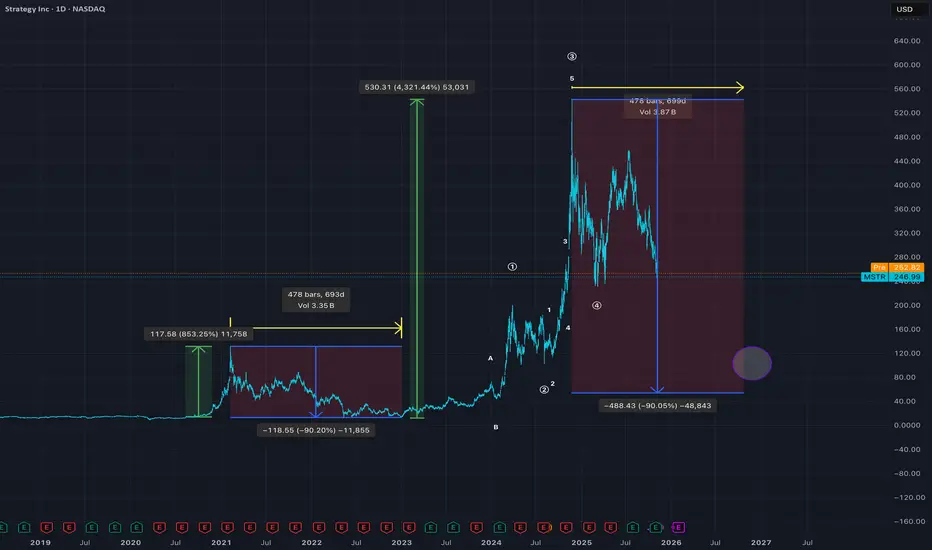
Will Microstrategy $MSTR follow the 2021 cycle?
Top was around the most greedy time in the market per Election '24. As bitcoin put in new all time highs MSTR continued lower highs, just like in '21. Last line of support around $230, it should continue putting in lower highs as the cycle comes to an end.
EURGBP: Cycle And Elliott Wave Makes Analysis Better Cycle analysis works well, especially on cross pairs like EURGBP, EURAUD, GBPNZD, and similar, where central banks often play a strong role and coordinate policy — sometimes even intervening when one currency moves too far.
In my view, cyclical analysis is most effective when it aligns with the Elliott Wave Principle, as both can highlight major turning points at key levels when sentiment reaches extremes.
Today we’re focusing on EURGBP, which has mostly traded sideways since 2016. We’ve been pointing out a potential cycle bottom toward the end of 2024, suggesting an important reversal point supported by a strong technical level at 0.8282. This support area also aligns with the lower side of wave B within a complex correction. Since the decline from the 2016 highs wasn’t impulsive, that added confidence — from both a cycle and Elliott Wave perspective — that a recovery was due.
So far, we’ve seen a solid reversal, with the pair already up more than 7%. The question now is how much further it can go. From both Elliott Wave and cycle standpoints, EURGBP appears to be entering the later stages of its bullish cycle, though some limited upside remains possible toward 0.9056.
That area could mark the upper boundary of an unfinished A-B-C-D-E triangle. If correct, the price is now in wave D, approaching key reversal zone.

Chart Analysis: BTC / USDT (Weekly Timeframe)Pattern: EMA Retest (Potential Breakdown Risk)
The chart shows Bitcoin (BTC) facing notable bearish pressure after recent highs. Price is currently testing the 50-week EMA, a historically important support zone that has previously triggered strong bullish rebounds. However, current momentum shows weakness as sellers dominate.
Key Observations
🔹 Support Zone: Around $100,900 (50 EMA) — acting as critical dynamic support.
🔹 June Low Support: Near $98,200, the next major level to monitor.
🔹 Bearish Candle: BTC down nearly 8% for the week, showing strong selling pressure.
🔹 Bull Bear Power (BBP) Indicator: signaling that bearish strength outweighs bullish demand, and selling momentum remains strong.
🔹 Previous Bounces: The last two retests of the 50-week EMA (circled) led to solid recoveries, but this time, price action looks weaker and sentiment more cautious.
Potential Move
If BTC fails to hold above the 50-week EMA, further downside targets could be:
🎯 Target 1: $95,000
🎯 Target 2: $90,000
Conversely, a strong bullish reaction from the 50 EMA may spark a rebound phase and signal renewed accumulation.
Summary:
Bitcoin is currently at a critical support retest on the 50-week EMA. The Bear Power indicator suggests growing downside pressure, and a weekly close below $100K could confirm a deeper correction. Holding this zone, however, might preserve the broader uptrend.
#Bitcoin #BTC #BTCUSDT #CryptoAnalysis #TechnicalAnalysis #TradingView #CryptoTraders #CryptoMarket #BullBearPower

Bring in the Bear!I forsee BTC down to 95k in the short-term, a little rally, and then heading down to 75k. The usual 40% drop from ATH. Just like the double-top in 2021.

$BTC Tests 50WMA - Line in the Sand for BullsIt’s only Tuesday, everyone RELAX.
Still a long way from a Weekly Close below the 50WMA for CRYPTOCAP:BTC
RSI is at the Liberation Day lows, and you know what happened after that.
Note: this is the shallowest pullback to the 50WMA all cycle for bitcoin, which is in-line with late cycle behavior.
In other words, this correction won’t take as long either.
We could see a Weekly Close below the 50WMA to shake everyone out, then have a bullish engulfing the following week to send us to the long awaited promise land we call VALHALLA.
In the small chance bulls cannot recover from this, below is a link to my 50WMA analysis that I put out back in February before everyone ran with my work.
Stay vigilant folks.

The most important uptrend line for SOLUSDAll crypto assets are way oversold these days (but everyone knows that already). This is totally understandable due to the longer government shutdown and other uncertainties (usual 4 year cycle which is normally already ended now).
It would not surprise me if we go further down than 150$ right now. Only because of the fact that BITSTAMP:BTCUSD even went below 100.000$ today!
In the most worst scenario, it really needs to bounce from the white uptrend line if we still want to see a better Q4 this year or Q1 2026.
According to the fib. retracement level this normally should be a good buy opportunity. If it holds above the white trend line, then we are still inside the ascending triangle (which is a bullish pattern).

Gold has unfinished business at the top.Gold will start its bullish move from the 3,840 zone if it doesn’t begin from the current price around 3,934. There’s still unfinished business at 4,438.6 that the market needs to complete. CMCMARKETS:GOLD

SOL will hit 100 soonAccording to the high timeframe analysis, CHOCH happened at 169 and tapped to the zone below 110 weekly liquidity, followed by a Rally to 240 which was a strong selling zone now it is on the way to hit 100$ or below. We can expect a strong bullish rejection from 80$

Only one sector keeps the S&P 500 alive.Since 2019, Technology (XLK) has surged +199.7%, almost doubling the S&P 500’s +101.8%.
The remaining 10 sectors have lagged behind, creating one of the largest performance gaps in S&P history.
The equal-weighted index (RSP) tells the truth behind the headline numbers:
up only +57.5% vs +101.8% for the cap-weighted SPY —
a −44 pp underperformance that exposes just how concentrated this market really is.
Some sectors have barely moved or even declined:
🏠 Real Estate (XLRE) −2.5%
🧺 Consumer Staples (XLP) +17%
⚡ Utilities (XLU) +26%
💭 Reflection:
This isn’t a broad bull market — it’s a tech-driven rally.
When leadership narrows this much, strength becomes fragility. The S&P 500 looks healthy on the surface, but its heartbeat comes from a single sector.

GBPJPY Sellinducement of the Asia session plus if you look left you can see price induced the external high already. The inducement of this session is the continuation downward.

EURUSD Analysis | Trading SimplifiedHeres an analysis of EURUSD, Price should continue lower and fill the inefficiency from the Daily Timeframe. The swing structure is still bullish, after price reacts from the imbalance it should continue higher.

Solana (SOL/USD) – 288-Day Cycle ObservationCycle analysis suggests Solana continues to follow a 288-day dominant rhythm, with clear recurring phases marking key market turns.
Each full cycle has produced a well-defined crest and trough roughly every 9–10 months, maintaining consistent periodicity since late 2023. The most recent cycle low occurred around April 2025, placing the next expected time window for a cyclical low in early 2026.
This study focuses purely on time-based behaviour, independent of price levels. The objective is to identify when key inflection points are most likely to occur, based on the underlying rhythm visible in historical data.
If the 288-day pattern remains intact, Solana may continue in the declining phase of its ongoing cycle, progressing toward its next temporal turning point.
Note: This analysis is for educational and timing research purposes only and does not constitute financial advice.
Until next time!

$USDT.D Cycle Top Indicator HIT !A THIRD CYCLE TOP INDICATOR HAS FLASHED ⚠️
YES this chart is complete chicken scratch, and my mad scientist approach to viewing different trends in USDT Dominance.
I’ve had this November 3rd intersection mapped out for years now.
NO, I do not believe we are anywhere close to the top (see pinned tweet).
Bulls REALLY need to step up big this week with a rally.
We cannot afford two consecutive weeks above 5.5%

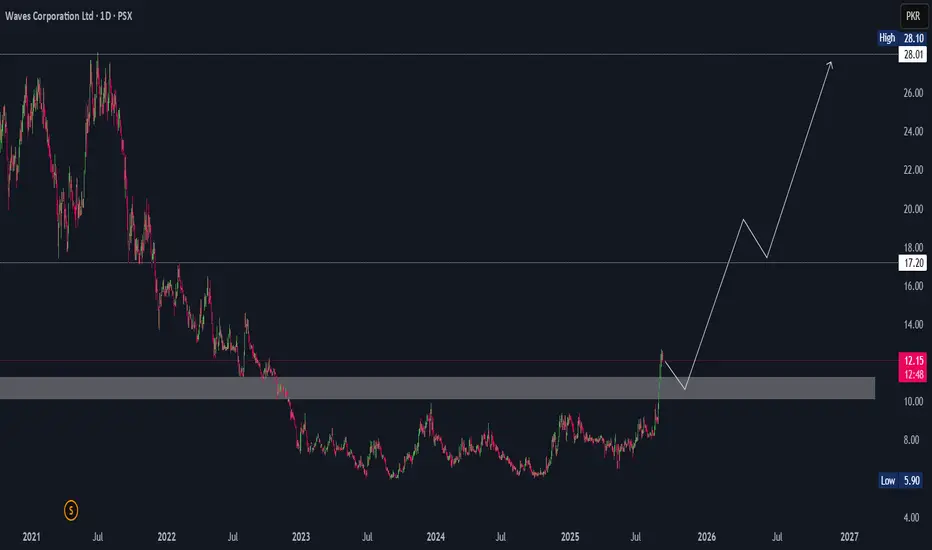
Waves Breakout and Buy Idea !Waves Corporation Ltd (PSX: WAVES) – Long term Technical Setup
Waves has finally broken out of a multi-year accumulation zone after trading sideways since late 2022. The stock has cleared the major supply area around 10–11 PKR, turning that region into a fresh support base.
From here, I expect a healthy pullback into that zone (shakeout/retest) before the next leg higher. The first major resistance sits around 17.20, and a sustained breakout above that level could open the way towards the 28–30 PKR zone over the longer term.
Volume has been picking up, which suggests real money is starting to rotate in. As long as price holds above 10, the structure remains bullish.
This chart is setting up for a classic accumulation → breakout → retest → markup phase. Longer term investors may want to watch closely how it behaves on the retest before positioning for the bigger move.
Bitcoin Cycle Repeat, taking into account Base 10 LevelsTo see the cycle repeat, it is critical to account for the build up of pressure and defense of the 1k 10k and 100k levels, then everything else follows the same extension and fib pullbacks.

$BTC Liquidity Spigot = RRP > TGA > FED BSThe RRP is tapped out.
The Fed Balance Sheet is irrelevant.
Now is time for the TGA to shine.

BITCOIN GIGA PLAN for 2025-2026Last time, I have fulfilled the dream of every trader: I entered at 15k and sold everything at 121500.
(if you don't believe, check my latest idea posted by Jan 10, 2023)
I notice that a lot of people completely misunderstand, and draw utter nonsense on the charts, and call it cycles.
Well, here's the Bitcoin cycle graph, the only one you need.
Sell your BTC bags NOW.
Buy at 38k BTC. or by 26 october 2026 by any price.
it depends on which of these happens first.
I will continue to use BTC cycles as long as it works, it gives phenomenal accuracy, as long as you use your brain.
I often hear people say about extended cycle (again lol?).
They waiting for banana zone.
We haven't seen euphoria phaze.
what can I say to such people?
Dream in one hand, and shit in the other, and then check which one is fills first xD
Don't be one of them, and don't listen to this bullshit.
