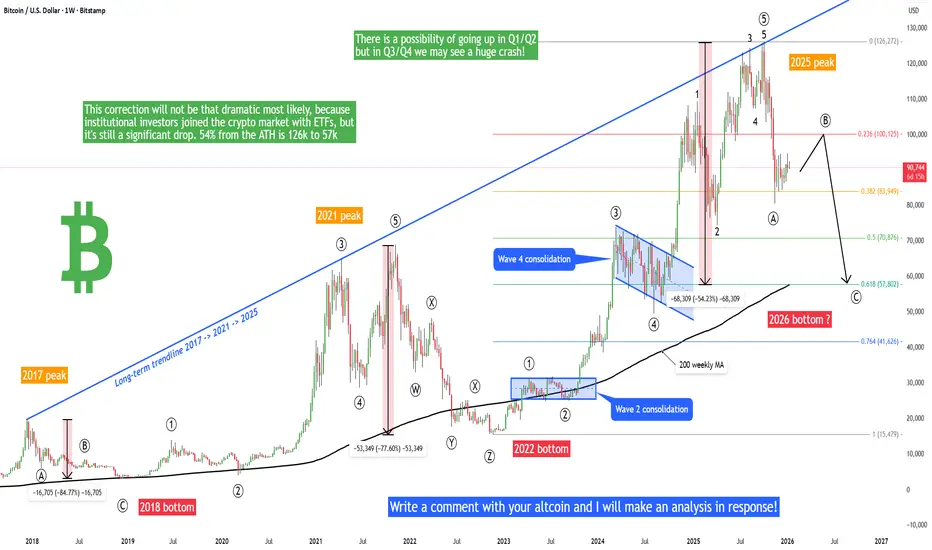
Bitcoin - 2026 roadmap, pump to 100k, then crash to 57k!Is it possible that Bitcoin will go above 100k or 103k in the next weeks/months? And is it possible that Bitcoin will later drop heavily to 57k? Altcoin season during the rise to 103k? I will answer these questions in this post. Write a comment with your altcoin, hit the like button, and I will make an analysis for you in response.
On the chart we can see a long-term linear chart of Bitcoin (2017 - 2026). As we can see, Bitcoin crashed by 85% in 2018 and by 77% in 2022. The next crash is apparently scheduled for 2026 - Bitcoin can drop below 60k to make at least a 54% correction. This correction will not be that dramatic most likely, because institutional investors joined the crypto market with ETFs, but it's still a significant drop. Why below 60k (precisely 57,802)? This is a very significant point of interest for traders/investors for multiple reasons. The first reason is that there is a strong Fibonacci level of 0.618 of the previous bull market. This is the strongest fibo level on the market. The next reason is the 200 weekly moving average. Usually big banks and institutional investors use this specific 200-period to buy and accumulate their assets. They are usually not interested in buying at the peak - they wait for pullbacks.
Now we have to take a look at the Elliott Wave theory, which works on Bitcoin perfectly from my point of view. We already had a big drop from 125k to 81k at the end of 2025. It looks like we can mark this wave as wave (A) or (W). Currently wave (B) or (X) is in progress and this is a bullish corrective wave that can bring the price up to 100k or 103k In this case that would be a perfect 1:1 FIB extension for an ABC correction to 57k. So there is a possibility of going up in Q1/Q2 but in Q3/Q4 we may see a huge crash! Of course this is just a speculation, we have to take all scenarios into consideration. We need to see more data in the coming days and weeks to confirm this scenario. Thank you, and I wish you successful trades!
Elliott Wave
GOLD - Consolidation ahead of news. Long squeeze?FX:XAUUSD is trading in the $4575-4600 range (consolidation) ahead of US inflation data (CPI) for December...
Inflation remains above the Fed's target (2%), making the data key to assessing the timing of rate cuts. XAU is consolidating below record highs. Profit-taking is observed ahead of the data release. Geopolitical risks and concerns about the Fed's independence support long-term demand for gold.
The reaction to CPI data may be short-term, as these factors remain a priority:
• Above forecast: dollar growth, gold correction to $4550 - 4520.
• Below forecast: dxy weakening, gold growth to $4650 - 4700
Gold retains its upside potential, but in the near term, its movement will depend on inflation data. Any correction can be seen as a buying opportunity amid ongoing geopolitical and monetary risks.
Resistance levels: 4600, 4630, 4650
Support levels: 4577, 4560, 4550
The initial retest of 4600 may end in a pullback, and a close below 4577 may trigger a decline to 4561 - 4550 before an attempt to grow (interest in the liquidity zone). However, against the backdrop of news reaction, gold may test 4550 - 4520 before continuing to rise. Very weak news may trigger a breakout of 4600 and an aggressive rally. It is important to monitor the context...
Best regards, R. Linda!

GOLD - Consolidation near 4600. Breakout or correction?FX:XAUUSD has updated its ATH to 4600. A local range is forming, with growth potential, against the backdrop of escalating geopolitical risks and concerns about the independence of the Fed, which remain.
Trump's consideration of military operations in Iran amid internal unrest and the tense situation in the Russia-Ukraine conflict (emergency UN Security Council meeting) create geopolitical risks.
Questions for the Fed: A criminal investigation has been launched against Chairman Powell, heightening concerns about pressure on the central bank's independence.
US employment data (NFP) for December (+50K) was weaker than expected, supporting expectations of Fed policy easing. Attention is shifting to December inflation data (CPI), which will assess the likelihood of a rate cut in March (current probability ≈30%).
The correction may continue, but the combination of risks and soft monetary policy creates medium-term support for further growth.
Resistance levels: 4600, 4625, 4650
Support levels: 4561, 4550, 4517
Since the opening of the session, gold has exhausted its intraday ATR reserve, which creates additional opportunities for consolidation or correction, within which the market may test key support zones, such as the previous ATH, before continuing to grow. A long squeeze of the specified support may provide the market with liquidity for further growth. However, an aggressive market could trigger a breakout of 4600 without correction...
Best regards, R. Linda!

Bitcoin Ranges as Middle East Tensions Raise Sell-Off RiskBitcoin( BINANCE:BTCUSDT ) has experienced both bullish and bearish moves over the past few days under the influence of various news events, resulting in a clear ranging structure.
One key factor that must be considered for Bitcoin and other risk assets is the escalation of tensions in the Middle East. This situation can act as a catalyst for sudden sell-offs across Bitcoin and the broader crypto market.
Currently, Bitcoin is trading near resistance lines, as well as the Cumulative Short Liquidation Leverage($93,150-$92,970), and has reacted precisely to the Potential Reversal Zone(PRZ) .
From an Elliott Wave perspective, Bitcoin appears to be completing a Double Three Correction (WXY) within this short-term range.
I expect Bitcoin to make another attempt toward the lower line of the ascending channel.
If this level breaks, we should be prepared for a deeper decline toward the Cumulative Long Liquidation Leverage zone($90,360-$89,360).
First Target: $90,773
Second Target: $89,903
Stop Loss(SL): $90,923
Points may shift as the market evolves
CME gap: $88,720-$88,120
What do you think about Bitcoin in the short term? I’d love to hear your thoughts!
Cumulative Long Liquidation Leverage: $87,125-$86,000
💡 Please respect each other's opinions and express agreement or disagreement politely.
📌Bitcoin Analysis (BTCUSDT), 1-hour time frame.
🛑 Always set a Stop Loss(SL) for every position you open.
✅ This is just my idea; I’d love to see your thoughts too!
🔥 If you find it helpful, please BOOST this post and share it with your friends.

ABAT: Bouncing off Major Support, Eyeing $8.85 Target.ABAT (American Battery Technology Company) is showing signs of a bullish reversal on the Daily timeframe. After a period of consolidation, price has successfully tested and held the key support zone around $4.00 - $4.50.
Key Drivers:
Support Confirmation: Price is bouncing off the 50-period Moving Average (Yellow line) and sits firmly on top of a high-volume node on the VRVP (Volume Profile), indicating strong buyer interest at this level.
Momentum Shift: The momentum oscillators (top and bottom panes) are curling upward, signaling a shift from bearish/neutral to bullish momentum.
Wave Projection: I am projecting an impulse move higher, labeled as Wave (A), targeting the 61.8% Fibonacci level ($8.85).

ETHEREUM - Retest resistance before a possible declineBINANCE:ETHUSDT is trading within the range of 3050-3150, with a local and global bearish trend. The market is still waiting for positive drivers, and until they appear, it is possible to trade within the channels...
Against the backdrop of a global downtrend, Bitcoin is forming a bullish wedge/ascending triangle, which in the current circumstances I consider to be a consolidation pattern before a possible liquidation and decline to 80-75K, which in general could trigger a decline across the entire market. Ethereum is forming a trading range against the backdrop of a local downtrend.
Focus on trading boundaries, namely resistance at 3150
After a short squeeze and a price decline to 3060, a liquidity pool of 3060-3050 (area of interest for MM) has formed below the local level
Resistance levels: 3150 - 3181
Support levels: 3083, 3056, 3000
A retest of 3150 and a lack of momentum may confirm the dominance of bears in the market, which in turn may form a false breakout of resistance and a reversal to the zone of interest and liquidity pool 3050.
Best regards, R. Linda!

SPX Short: We are at the PEAK! STOP above 7050!Over in this video analysis, I spent almost 20 minutes to talk about the wave structure, the Fibonacci relationships, the fractal relationships between different waves, how to short, and also warns about "What-if-I'm-wrong" scenario.
What I missed to mention in the video is that for now, we still do not have any extensions in our waves 5 (Cycle and Primary). NOT that there MUST be an extension, but it is something to keep it mind for the alternate count of a series of 1s and 2s, leading to a compounded wave 3.
Remember that the most important part of this video, which I mentioned at the end, is the ending diagonal invalidation price: 7049.65. A stop MUST be place above this price. For easier remembering, above 7050.
Good luck!

Bitcoin: Coldest Winter EverBitty the Butcher returns soon.
With Bitcoin nearing the completion of its all-time double zig-zag wave, it is likely soon due to embark on the most notorious descent in the history of finance.
Previously, it was my expectation that Bitcoin would slap $350K+ before gassing out, however, the waves are indicating differently as of late.
For the past 3 years, I've thought that Bitcoin would drop below $10 after its current pump finished. I think very strongly that the time comes soon.
After a 17-year pump, I believe this drawdown can last anywhere between 5-8 years.

SPY/QQQ finishing wave Bs before CPICurrently I'm leaning towards SPY and QQQ both finishing up B waves and are prepping for a wave C drop potentially coming from CPI tomorrow. I've been trying to reconcile the 2 different wave structures of SPY putting in new ATHs and QQQ still struggling. Both are divergent on several time frames and I think this structure makes sense unless we continue up tomorrow after CPI.

$BABA Breaking Out Of A Bull FlagAlibaba has been trading within a downward channel for last few months, but the structure still looks corrective due to the clear overlaps. Because of that, traders can still watch for a potential turn higher, especially now after a rebound from 147.68 support area, which was also the high back in March 2025. If price can close and finish the day out of a downward channel, as well as above the bullish level at 163.94, then another fifth wave higher could unfold.
At the same time, it is important to keep an eye on 134.35, as a break below that level would question the impulsive trend. Also note the weekly chart, which suggests the market may be in the later stages of wave C, with potential strong resistance later this year near the 78.6% retracement, slightly above the 200 level.
Highlights
– Overlapping structure suggests the move lower is corrective
– Key support to watch is around 147.68
– Daily close above 163.94 would open the door for wave five higher
– Invalidation sits at 134.35
–

BTCUSD 4H Elliott Wave analysisWave (2) has re-entered, creating a perfect double top, which may indicate that we are witnessing wave C of a triangle formation. In any event, we anticipate a decline toward either 84k or 80k.
If there is a rebound toward 86k, it could signify wave D of the triangle.
Love, Elliott!

USDJPY - Consolidation may turn into upward distribution FX:USDJPY is storming the resistance zone of the current consolidation. Focus on 157.88, a breakout of the current border could trigger an upward movement...
The Japanese yen is testing the intermediate bottom, hinting that the currency is preparing to continue falling. Against the backdrop of a weak yen and a strong dollar, the currency pair may continue its upward trend.
Retesting resistance, the reaction from the bears is weakening, and the bulls are trying to keep the price above 157.88. If there is no reaction (pullback), then growth may continue from the 157.15 - 157.88 zone, provided that the price closes above the level.
Resistance levels: 157.88
Support levels: 157.15, 156.18
Technically, against the backdrop of an uptrend, consolidation is forming, within which the market is not updating local lows, but is gradually contracting towards resistance at 157.88. There is a high probability of a breakout (possibly after a slight correction to local support). Nearest targets: 160.0 - 161.5
Best regards, R. Linda!

SPY/QQQ finishing wave Bs before CPICurrently I'm leaning towards SPY and QQQ both finishing up B waves and are prepping for a wave C drop potentially coming from CPI tomorrow. I've been trying to reconcile the 2 different wave structures of SPY putting in new ATHs and QQQ still struggling. Both are divergent on several time frames and I think this structure makes sense unless we continue up tomorrow after CPI.

GOLD (XAUUSD) Wave analysis -12/1/2026 (Scenario1) GOLD (XAUUSD) Wave analysis -12/1/2026 (Scenario1)

Bitcoin's Epic Climb to $140K: Elliott Wave
Bitcoin's Epic Climb to $140K: Decoding the Elliott Wave Bull Cycle!
This TradingView chart by Dr. Eltourky analyzes Bitcoin's (BTC/USDT) long-term price movement using Elliott Wave theory from late 2021 (end of grand wave 1) to a projected 2026. It highlights a strong ascending trendline starting from the ~$16,000 low (start of grand wave 2), with red arcs indicating( wave 3) phases numbered from 1 to 5, and Roman numerals (i) to (v)-> sub-wavs, ending at $126,000 (end of grand wave 3). The analysis shows Bitcoin in a major impulsive bullish cycle. Bitcoin is currently trading near $91,000 in early 2026, then completes the decline to around $65,000 --> Daily Fear Value Gap (end of corrective wave 4), then starts wave 5 and forecasts a breakout to approximately $140,000 along the trendline by mid-2026, signaling continued upward momentum in the cryptocurrency market.

RBRK - Good R:R TradeRBRK has been pulling back into the discount zone for a while.
This is a good area to start building a long position.
There is an unfilled gap below, may fill it aggressively to shake out the longs.
Have a wide stop or build the position over the time instead of jumping into it.
- IPO VWAP holding well
- Earnings gap filled
- In the discount zone
Target 1 - 100
Target 2 - 120
Stop loss - 48, very wide.

USDCAD Long Setup — Retest Zone Could Fuel the Next Push HigherToday, I want to share a long trading opportunity on the USDCAD ( FX:USDCAD ) pair. Stay tuned!
USDCAD is currently breaking through the resistance zone(1.394 CAD-1.389 CAD) with good momentum, and this zone is now acting as support. It’s also near the Potential Reversal Zone (PRZ) and the support lines, which can provide a solid foundation for the continuation of the bullish trend.
From an Elliott Wave perspective, it seems that USDCAD has completed main wave 3, and we should now expect the corrective wave 4 before the pair resumes its upward movement.
Additionally, recent U.S. unemployment claims data, which was favorable for the DXY index( TVC:DXY ), supports the continuation of the USDCAD bullish trend.
I expect that as USDCAD enters the Potential Reversal Zone (PRZ) , it will begin to climb and target the resistance zone(1.394 CAD-1.389 CAD) once again.
First Target: 1.389 CAD
Second Target: 1.393 CAD
Stop Loss(SL): 1.378 CAD(Worst)
💡 Please respect each other's opinions and express agreement or disagreement politely.
📌U.S. Dollar/Canadian Dollar Analysis (USDCAD), 4-hour time frame.
🛑 Always set a Stop Loss(SL) for every position you open.
✅ This is just my idea; I’d love to see your thoughts too!
🔥 If you find it helpful, please BOOST this post and share it with your friends.

Sandisk - Final PushLooking at the chart, we see that we are drawing the 5th and final wave of the uptrend.
Remaining movement: 3-18 %.
Key targets:
395
454
After reaching these targets, we expect a correction
---
Please subscribe and leave a comment!
You’ll get new information faster than anyone else.
---

RDW - Buckle up for a rideRDW has the heaviest volume lately when it bottomed, that's a very good sign.
I've been building long position here, few at a time.
Target 1- 10 - Toughest area to beat, heaviest overhead supply. Notice the VWAPs converging here. Even if it takes time to cross this area, just wait patiently.
Target 2- 16 - Next supply zone after 10
Target 3- 24
Stop loss - 4

Gold Jumps on Geopolitical Shock —Rally Exhausted or Correction?Gold ( OANDA:XAUUSD ) opened the week higher as global markets reacted to rising geopolitical tensions.
The main driver was the weekend arrest of Venezuela’s president, Nicolás Maduro, by the United States, which increased global uncertainty and boosted safe-haven demand.
Ongoing tensions in the Middle East and the Russia–Ukraine war continue to support gold as a hedge against geopolitical risk.
As I previously expected , gold has begun to rise and has reached its targets (full target).
Gold is currently attempting to break the resistance zone($4,467-$4,430).
From an Elliott Wave perspective, it seems that gold is in the process of completing a Double Three Correction(WXY) in an Ascending Broadening Wedge Pattern.
I expect that Gold will begin to decline and potentially drop at least to around $4,391.
First Target: $4,391
Second Target: $4,346
Stop Loss(SL): $4,540(Worst)
Points may shift as the market evolves
What do you think? Will gold continue its bullish trend into 2026, or should we expect a correction? I’d love to hear your thoughts!
💡 Please respect each other's opinions and express agreement or disagreement politely.
📌 Gold Analyze (XAUUSD), 1-hour time frame.
🛑 Always set a Stop Loss(SL) for every position you open.
✅ This is just my idea; I’d love to see your thoughts too!
🔥 If you find it helpful, please BOOST this post and share it with your friends.

DAX - Up for nowCounting waves and assessing technical potential. Here’s what we see:
October 2020 - Completed the correction and started forming the 5th wave of the uptrend.
November 2025 - Making the final push, forming the last sub-wave 5 within the larger wave.
Key reversal level sits near 28,300 .
Note: this level coincides with the Fibonacci levels where the first wave ended in March 2000 .
Key targets:
Trend reversal expected at 28,300
Local correction at 26,900
Additional reversal points at 29,300 / 31,200
---
Please subscribe and leave a comment!
You’ll get new information faster than anyone else.
---

Silvers Next Move... MaybeLooking at peak and trough channels, past Elliot Wave style moves, and considering the current Gold / Silver Ratio, expecting a retest of the breakout very soon, inline with the general theory of deflation coming in hard currently and the dropping of rates, the dropping of rates not being the boost everyone thinks it will be.

USDJPY 1D Elliott Wave analysisThe current rally may be nearing its end or reaching 159.00 to 159.50. We then expect a correction in wave 4 towards 155.40 or 153.70.
Love Elliott !!!
