Bitcoin’s Next Big Move: Relief Rally or Extended C Toward 50k?Hello everyone.
BTCUSD on the weekly chart, I read the advance from the 2023 lows as a completed 1–5 impulse. After the top, price action clearly transitioned into an A-B-C corrective structure.
Price is currently trading around 89,091, below 0.236 (91,330), suggesting that upside attempts have not yet gained structural acceptance and the market remains in correction mode.
My primary roadmap:
A appears completed with an initial defense.
The rebound that follows can be interpreted as B, typically a relief move rather than trend continuation.
The key risk is that if B remains weak, the structure may shift into an extended C wave, leading to a deeper rebalancing phase.
Key weekly zones:
91,330 (0.236): First threshold. Reclaiming it supports a developing B rebound.
98,008 (0.382): Major test for rebound strength.
103,405 – 108,801 (0.50 – 0.618): A high-probability exhaustion/supply zone for B. As long as price stays below this band, upside is treated as corrective.
Downside risk:
Weekly acceptance below 80,537 confirms the transition into C.
If C extends, the 50,000 area emerges as a meaningful medium-to-long-term balance / target zone on the weekly timeframe.
Bottom line: The dominant weekly structure remains an ABC correction. Upside is possible within B, but a weak B increases the risk of an extended C toward the 50k region.
Elliottwaveforecasts

XAUUSD Gold Monthly Outlook (Count 2)In this outlook on FX_IDC:XAUUSD i am putting forward a long term monthly chart view. although i have the audacity to suggest Gold may not move in a straight line, I'm hardly bearish either. I have a large position in Gold related instruments (then Silver then Uranium)
There are plenty of comments on the chart so I'm not going to recap too much here, but i will mention the caveats:
1. The projections i have put forward are based on estimates of uncompleted waves, once i feel i can anchor the next wave i will update the chart and recalculate the levels for the next wave, the chart is an evolving puzzle and there is only so much we can determine based on the information we have.
2. I put more emphasis on price levels as opposed to time, dependent on volatility the waves could play out quickly or prolonged, i do factor in an element of 'the right look' in terms of wave proportionality, but also want the patterns i am projecting to be easily visible on the outlook, so bear that in mind.
Note: i create my outlooks with the browser tabs hidden (F11) so if they look squashed, that is why.

GOLD – HTF Market Structure Overview
Price is trading near the upper boundary of a well-defined higher timeframe ascending channel.
The impulsive structure appears mature, with price approaching a key extension area, while momentum shows early signs of exhaustion. From a structural perspective, this area represents a potential transition zone, not an immediate trade opportunity.
If the current advance completes, the market may shift into a corrective phase, where internal structure and liquidity behavior will be more important than directional bias.
At this stage:
The higher timeframe structure remains intact
No confirmation of reversal is present
Lower timeframe noise is ignored
The focus remains on where the market is within the broader structure, not on predicting short-term moves.
This is a structural overview, not a trade signal.

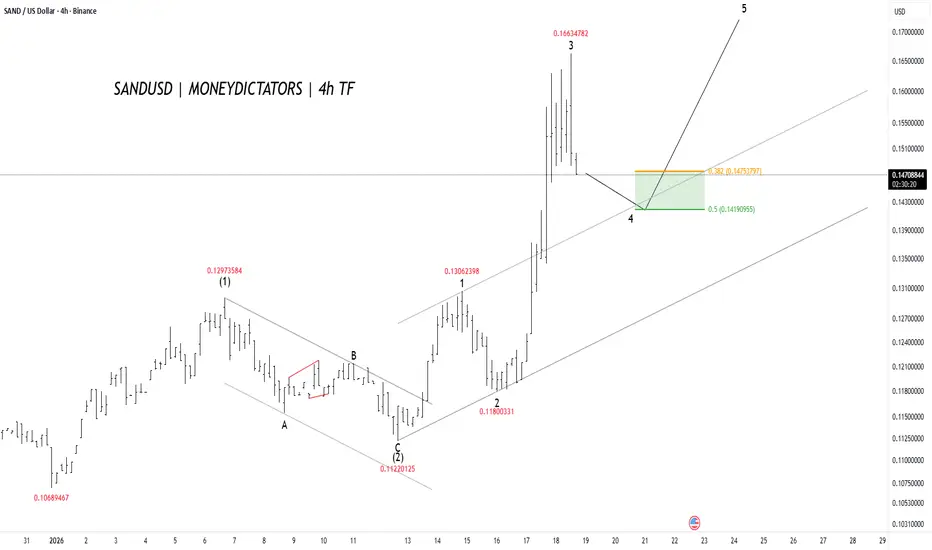
SANDUSD Is Ready for Up MoveSAND is in a strong uptrend on the 4-hour chart. Price has already completed waves 1, 2, and 3, where wave 3 was a sharp and powerful rise. Now the market is doing a small pullback (wave 4), which is normal after a strong move. This pullback is expected to stay in the green support zone around 0.142 – 0.141 (Fibonacci 0.5 area). As long as price holds this zone, the trend stays bullish. After wave 4 finishes, price is expected to move up again into wave 5, targeting higher levels above 0.16. Overall, trend is bullish, and the current dip looks like a buy-the-dip move, not a trend change.
Stay Tuned :)
4H Chart Outlook on MP Materials Corp.Since the last outlook the chart has played out pretty well with green wave 5 tagging $100 and then selling off in wave 2.
In this updated outlook on NYSE:MP i put forward a couple of possibilities, a near term bullish and bearish outlook, both of which are explained further on the chart comments.
i did add to my position on the sell off as a potential running flat pattern was on the cards, but that level didn't hold. now currently watching to see how this pattern develops. have a target of $140 where i will reassess my position.
More comments on the chart.

Elliot Waves Strategy ExplainedElliott Wave theory is not a forecasting tool. The moment it’s used that way, it becomes useless. It does not tell you where price will go. It describes how participation unfolds once direction is already present.
At its simplest, markets alternate between expansion and digestion. Impulse waves show commitment and follow-through. Corrective waves show hesitation, overlap, and redistribution. Everything else traders add on top is interpretation, not edge.
Most traders fail with Elliott Waves because they try to label the market instead of read it. Wave counts are adjusted after every pullback to protect bias. When a count needs defending, it has already lost its value for execution.
Wave completion does not mean reversal. Strong trends extend, truncate, or move into complex corrections without ever giving clean countertrend entries. Acting on a “finished” wave without a structural break is just early positioning dressed up as analysis.
The subjectivity of Elliott Waves is the warning label. If two valid counts exist, neither can justify risk on its own. Structure, location, and participation come first. The wave count only adds context to what price is already showing.
Used correctly, Elliott Waves help with expectations and trade management. They stop traders from chasing late impulses and from exiting too early during normal corrections. Used incorrectly, they create the illusion of control over an uncertain market.
Elliott Waves don’t give certainty. They give restraint. And restraint is far more valuable.

Baidu bullish, entering its wave (3) of 3.Baidu is breaking out today, up 15%, on the news of its Ai chips division spinoff. The chart is looking very bullish, having started its wave (3) of 3, the most bullish wave. Looking at targets around $211/$256 first as long as $108 area is holding. Eventually we could see the all time highe broken up in 2026 or 2027.

Coeur Mining (CDE) Elliott Wave Outlook - Count 1 (4H)Since the previous weekly outlook on NYSE:CDE , price has moved pretty much in line with the expectation, with wave (3) and wave (4) playing out. The pull back in wave (4) was more aggressive and deeper than I would have liked, but wave (2) was fairly flat, so based on the guideline of alternation it does suggest a sharper correction in wave (4), it did run just beyond the 50% fib retracement which is getting a little deep.
In this interpretation I have the chart moving higher in wave (5) with red wave 1 underway. I'll add a caveat, there are alternative wave counts available and should we see an aggressive sell off in silver, then CDE may get hit alongside it. in that scenario this recent up move from $13.55 may instead be a corrective wave, which would mean more consolidation in wave (4), and potentially a break below $13.55 (which is the invalidation level for red 1), unless a triangle pattern forms and we instead go sideways.

BTC to 74k!?All going to plan!
Currently in sub wave 3 of a Wave 5 to the downside - looking for $74k but we’ll see.

Bias Remains Bullish, But Bearish Potential RemainsAlthough Gold recorded a daily correction (into negative territory), the long-term market structure remains constructive. The uptrend remains dominant as long as the price maintains its position above critical support levels.
✅ Key Upward Resistance Levels
If buyers successfully take control after this consolidation phase, the targets are:
- $4,550: All-Time High. This is the nearest psychological and technical hurdle.
- $4,600: A major psychological figure that will become a new long-term target if a record breakout occurs convincingly.
✅ Key Downward Support Levels
If selling pressure continues during this "digestion period," the following levels should be watched:
- $4,430: Initial support (December 23rd low).
- $4,338: Next downside target (December 22nd low).
- $4,300: A psychological round number and the December 17th low.
Conclusion: Technically, Gold is in a healthy correction phase from overbought conditions.
As long as the price doesn't fall below $4,300, the prospect of a rally towards a new record of $4,600 remains wide open, especially if supported by uncertainty regarding the Fed's independence and slow progress in the Ukraine peace process.

GBP/JPY | Potential for Medium-Term CorrectionGBP/JPY experienced selling pressure for the second consecutive day, trading around 210.50. Despite the correction, the price remains near the 17-year high (211.00) reached last Monday. The market is currently caught in a tug-of-war between the yen, supported by the Bank of Japan's policy stance, and the pound, supported by the Bank of England's cautious stance.
✅ Factors Supporting the Japanese Yen (JPY)
- October BoJ Minutes: The newly released document showed broad agreement among officials to continue raising interest rates if economic forecasts are met.
- 30-Year High: Given that the BoJ just raised interest rates to 0.75% in December and is open to further tightening, the JPY has improved yield appeal.
- Geopolitics: Global uncertainty (Venezuela, Ukraine, the Middle East) continues to fuel safe-haven flows into the yen.
✅ Factors Supporting the British Pound (GBP)
- Hawkish Interest Rate Cut: Although the Bank of England (BoE) cut interest rates to 3.75%, the very tight vote (5-4) suggests the committee is in no rush to ease further.
- Expectation Revision: Investors are now scaling back speculation of aggressive interest rate cuts next year, providing a strong foundation for the GBP.
✅ Technical & Strategy Guide
- Consolidated Sentiment: The current decline is still considered a healthy correction. Strong follow-through selling is needed to confirm that the price has truly peaked in the 211.00 area.
- Thin Volume: Light year-end trading could lead to unexpected volatility or subdued (choppy) price movements.

GER40 Holds Key Fibonacci Support – Upside Continuation LikelyThe GER40 chart indicates that a larger A-B-C corrective structure has been completed at the recent low, marked as (C), after which the index began a fresh impulsive upward move. From that bottom, price has formed a clean five-wave advance, confirming the start of a new bullish cycle. The recent pullback appears to be a normal Wave 2 correction, which has respected the 0.5–0.618 Fibonacci support zone, a typical area where corrections end. This suggests the correction is likely complete and the market is preparing for Wave 3, which is usually the strongest and fastest upward wave. As long as price holds above the Wave 2 low, the bullish Elliott Wave structure remains valid. Overall, the setup favors continued upside toward higher highs in the coming sessions.
Stay tuned!
@Money_Dictators
Thank you :)

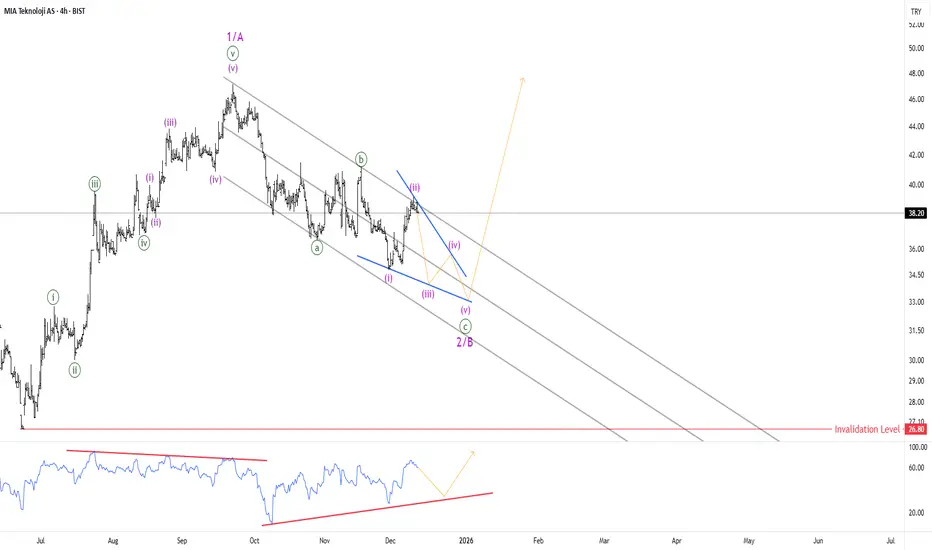
MIATK about the end abc correction after 5 waves upTurkish stock MIATK has completed 5 waves up now it's making it's correction in the shape of Zig-Zag.
BTCUSD: Holding Wave X or Slipping Lower?24 Nov 2025
27 Nov 2025
1 Dec 2025
17 Dec 2025
Bitcoin is still trading inside a falling channel, and the overall structure remains corrective. The recent bounce from lower levels lacks momentum and is overlapping, which signals consolidation rather than a trend reversal. Price continues to respect channel resistance, keeping the broader bias weak.
Wave X is acting as an important support zone around 83,822 , and as long as price holds above this level, further consolidation remains possible. This area is currently absorbing selling pressure and preventing immediate continuation to the downside.
However, a decisive breakdown below Wave X would signal that the correction is not complete. In that scenario, downside momentum is likely to expand, opening the path toward the 79,650 - 75,655 zone.
Stay Tuned
@Money_Dictators
RD :)

ETHUSD Bull Trap? - Final Breakdown Setup Is Almost Locked InETH is still stuck inside a clear falling channel, and the entire pattern is behaving like a corrective downtrend. The recent bounce from 2620 looks sharp, but it’s still just a counter-trend move. Nothing here screams trend reversal yet.
Wave 3 ending at 2620 , and now the price is rising for a Wave 4 retracement. Wave 4 usually moves back toward the mid-channel and tests previous breakdown zones.
The red box around 3200–3300 is the key trap zone. This is where sellers can return because Wave 4 must not enter Wave 1 territory, which sits higher. As long as ETH stays under that invalidation level, the bearish structure remains fully intact.
The move looks like a classic (a)-(b)-(c) correction inside Wave 4. Once this corrective bounce completes, the chart suggests ETH will resume the downward path. The channel alignment and wave symmetry both support a final Wave 5 drop.
If the bearish count plays out, ETH could slide toward 2400 – 2300 in Wave 5 before a major bottom forms. That’s the zone where sellers exhaust and buyers take control again. Until ETH breaks the invalidation level with strength, downside remains the more probable outcome.
Stay Tuned!
@Money_Dictators

ETHUSD: Reversal or Another Bull Trap?Look at this:
ETH played the trap perfectly. After pushing into the 3200–3400 resistance zone, price failed to sustain above it and rolled over, confirming that the move was distribution, not strength. Sellers stepped in exactly where a Wave 4 rally should fail.
The rejection was followed by a clean breakdown of the parallel rising channel, which shifts the short-term bias back in favor of the bears. That channel was the last structure holding the corrective bounce together. Once it broke, the bullish case weakened sharply.
This drop reinforces the view that the move up from 2620 was only a Wave 4 correction, not the start of a new trend. With Wave 4 likely complete, ETH appears to be transitioning into Wave 5 of the broader corrective decline.
As long as price remains below the broken channel and prior resistance, downside continuation remains the dominant scenario. The structure opens the door for a retest of 2620 , with a deeper extension toward 2465 if selling pressure accelerates.
Until ETH reclaims the channel with strength and acceptance, this remains a sell-the-bounce environment. The warning came at the trap zone, and the market is now following through.
Stay Tuned!
Money Dictators,
R.D :)

USDT.D(based on NEowave)patterns of eth and btc is changed.
crypto market will start a bullish wave soon.

The Road to DOW 100KWhy the Fourth Turning Won’t Resolve Until Super Cycle Wave III Peaks and Wave IV Finds Bottom:
As we close out 2025 with the Dow Jones Industrial Average within reach of the psychological 50,000 level and despite all the well-deserved doom and gloom, the question on every die-hard bullish investor’s mind is not if the index will reach 100,000, but when — and what price will be paid along the way.
Some analysts interpret the structure as Grand Super Cycle Wave III (or V), depending on where they anchor the pre-industrial baseline. This distinction does not alter the implications: under both counts, the current advance is still part of an extended third wave, and third waves are not where secular crises resolve. They are where excess accumulates.
The rarely seen proprietary chart above from 1693, which splices British Stock prices and the Clement Burgess Index to the Dow, presents a radical yet rigorous Elliott Wave-based perspective:
Before unpacking the connections, a brief orientation is helpful. Elliott Wave degree structures range from small, short-term patterns up to century-scale formations known as Cycle, Super Cycle, and Grand Super Cycle. These higher-order waves capture long economic booms, demographic arcs, technological eras, and broad civilizational moods. When an impulse of this magnitude is still unfolding, the society riding atop it rarely enters true crisis resolution until the wave completes.
The entire advance of the Dow from the 1896 low is part of one single Super Cycle III wave. It is currently in the late stages of a smaller and ongoing 16-year Cycle Wave V within a larger GRAND SUPER CYCLE Wave III (or V, depending on the higher-degree interpretation). The implications are profound.
NOTE: It took 66 years (1900-1966) for the Dow to advance 10x from 100 to 1000, then only 33 years (1966-1999) for another 10x move from 1000 to 10,000. If Elliott’s rule of alternation applies, it might be 66 years from 1999, or 2065, before the Dow advances another 10x from 10,000 to the 100,000 level. Should a Venezuela-like inflation occur in the coming years, it is conceivable that the Dow reaches its 10x 100K milestone 33 years from 1999, or by 2032.
The generational crisis known as the Fourth Turning — the societal upheaval Strauss and Howe originally predicted would end by 2026 — will not find resolution until Super Cycle Wave III tops and its corresponding Wave IV bottoms, likely sometime between 2030 and 2036.
BULLISH NOTE: As captioned beneath the chart above, it is plausible that strong inflationary winds can extend the current 16-year Cycle Wave V to 2030-2032, inverting our suspicion for a severe decline into this period. If this occurs, Super Cycle III will have thrown over the upper trend channel and be marked accordingly.
Because Super Cycle III has not yet peaked, the conditions required for a true Fourth Turning catharsis have not yet formed. Instead of concluding, the crisis continues to compound—geopolitical fractures, monetary instability, demographic strain—held in suspension by a still-advancing secular market wave. The tension builds, but the break has not arrived.
Until Super Cycle III peaks, perhaps in 2026, when it surpasses the 5X threshold of 50K after passing its last major 10X milestone at 10K in 1999, the path remains upward with violent trepidation.
The Grand Channel: A 330-Year Perspective
When British stock data from 1693 is spliced with the Dow Jones Industrial Average beginning in 1896, a remarkable parallel channel emerges:
The lower trendline connects the Clement Burgess 1857 low, the 1896 low, and the 1932 low.
The upper trendline is a parallel copy drawn from the 1720 South Sea Bubble peak, which aligns rather nicely with the current print highs in the Dow for 2025-2026. A throw-over above the upper trend channel is always possible.
This channel has contained the entire modern equity advance for over three centuries. The current price action is pressing hard against the upper boundary — a classic termination signal in Elliott Wave analysis.
The Grand Super Cycle uptrend channel from 1693 to the present.
Super Cycle Degree: One Unfolding Impulse
The entire move from 1896 is labeled as a single Super Cycle advance:
Super Cycle I — 1857 low to 1881 high
Super Cycle II — 1929 crested with an expanded Cycle degree B wave peak high leading to the 1932 low (a sharp, primary five-wave down Cycle degree C-Wave correction terminating Super Cycle II).
Super Cycle III — 1932 low to present (extended, currently completing an extended Cycle V)
The post-1932 advance is not five complete Super Cycle waves. It is an extended third at Super Cycle degree still in progress, with the current rally from the 2009 low representing Cycle V within that larger III wave.
This labeling reconciles and defines the extraordinary duration and amplitude of the bull market without violating Elliott’s rules of proportionality and alternation.
Primary and Cycle Degree: The Final Leg
Within the ongoing Super Cycle III, the advance since 1932 subdivides into five clear Cycle waves with an additional subdivision at the primary degree between 1942 and 1999.:
Cycle I — 1932–1937
Cycle II — 1937–1942
Subdivided Primary Degree (within Cycle III):
Primary 1 — 1942-1946
Primary 2 — 1946-1949
Primary 3 — 1949-1965
Primary 4 — 1965-1982
Primary 5 — 1982-1999
Cycle III — 1942–1999
Cycle IV — 1999–2009
Cycle V — 2009-present (extended, currently in its terminal phase 2025-2032)
The post-2009 Cycle degree rally is the last of Cycle V (terminal to Super Cycle III from the 1932 low) — the structure that produced the extraordinary gains of the past sixteen years.
FOUR DEGREES of TREND: Grand Super Cycle Waves are the largest Roman Numerals noted in red, Super Cycle labels are in black, Cycle degree in blue, and the smallest Primary waves are illustrated with standard red numerals and letters.
The Fourth Turning Resolution
The Strauss-Howe updated Fourth Turning framework predicts a period of intense societal crisis peaking in the late 2020s to early 2030s.
In Elliott Wave terms, this crisis corresponds to Super Cycle Wave IV — the deep, multi-year correction that must follow the completion of Super Cycle III.
This correction will likely take the form of a sharp zig-zag, or complex combination, lasting 3–8 years and retracing at least 38% of the entire advance from 1857. Such a decline would drive the Dow down toward the COVID lows of 2020, near the 18,000 level.
The resolution of this Fourth Turning — the rebirth phase — will not begin until Super Cycle Wave IV finds its bottom, projected to occur within the 2030–2036 timeframe.
Only then will Super Cycle Wave V begin — the final advance that carries the Dow to its next 10x target of 100,000.
Conclusion
The market is not yet in the final stages of a multi-century bull market ending in a grand cycle collapse, but rather approaching a Super Cycle Wave IV bear market event , which could still strip the Dow by 60-65% before the Super Cycle V wave bull resumes. The Dow is in the late stages of a multi-century third wave that still has one more explosive leg ahead to tag the Grand Super Cycle terminal.
The Fourth Turning crisis will be severe, but it will be a corrective event within a larger bullish structure — not the end of the Grand Super Cycle advance.
Although investors may wish to sidestep the pending decline, those who mistake Super Cycle Wave IV for the end of the bull market will miss the greatest opportunity of the coming generation.
The channel is speaking.
The waves are clear.
And after some much-needed, long overdue, and well-deserved pain, 100,000 on the Dow remains not just possible — but inevitable. Let’s hope so, anyway.

GUBRF Turkish stock In my opinion,Gubrf even if it makes new highs it seems like an under correction...Which in this case it seems like a big Flat correction,in this particular case wave A of the Flat also a flat itself...If that scneraio proven itself correct than it's a huge think...Many people belive small traders get caught up in the downside corrections by manipulations but i don't see it that way..
There are multiple patterns in EWP which repeats itself over and over again...We will see if my analysis is correct or not,i expect a 5 wave move down stongly after it completes wave B of the flat...
The other scneraio is that is not a flat but WXY correction means again move to the downside but the difference is it will not go down in 5 waves but 3...
Any case people should pay attention those scneraios.

GBPUSD | Prices Continue Uptrend✅ Short-Term Price Direction (H4):
After a sharp decline from its peak, the H4 movement indicates a strong short-term uptrend from the recent low around 1.2100 - 1.2200. The price has created a series of clear Higher Highs (HH) and Higher Lows (HL).
The price is currently consolidating below Short-Term Resistance around 1.3100 - 1.3200, which is also the Low Volume Node (LVN) on the Daily Volume Profile. This indicates potential uncertainty after the rapid rise.
This consolidation is occurring within the newly formed High Volume Node (HVN) area on the H4 (around 1.2900 - 1.3000), which serves as strong Short-Term Support.
Short-Term Bias: Bullish (Upward), as the HH and HL structures on the H4 are still intact.
✅ H4 Key Levels:
- Short-Term Resistance (Consolidation Top): Around 1.3100 - 1.3200.
- Short-Term Support (HVN/HL): Range 1.2900 - 1.3000 (Important).
- H4 Value Area Low: Around 1.2700.
✅ Potential Scenarios
- Strong Bullish Scenario: Price successfully breaks through and maintains above the Short-Term Resistance at 1.3200, paving the way for a test of the Daily POC at 1.3400 - 1.3500.
- Correction/Reversal Scenario: A break and close below the Short-Term H4 Support (1.2900) will invalidate the H4 bullish bias and could lead to further declines to test the H4 Value Area Low at 1.2700 and the Daily Key Support.

USDCAD - Breakout Will Flip the Trend BullishUSDCAD has been sliding inside a well-defined descending channel, completing a full five-wave drop toward the support zone. The structure from the top looks corrective rather than impulsive. That means the downtrend is weakening as it reaches its final leg.
Your count shows Wave 3 finishing at the dashed red line zone, followed by a small Wave 4 bounce, and now the market is pushing into the last Wave 5. This final drop is expected to target the Fibonacci levels near 1.3915 and 1.3895 . Nothing suggests strength until those levels are tested.
The price is still trapped inside the downward channel, and every bounce has been getting sold. That confirms sellers are still in control for now. Wave (C) is close to completion, but buyers haven’t proven anything yet.
The bullish outlook only becomes valid after a clean breakout above the channel. Without that break, any upside move is just noise inside a bearish structure. The breakout must hold with a higher low to confirm a trend reversal.
If the channel breaks decisively, a strong bullish reversal toward 1.40+ becomes possible. The entire structure suggests the downtrend is aging, so a major upside swing is likely once sellers exhaust. Until then, downside targets remain open and caution is necessary.
Stay Tuned!
@Money_Dictators

Microsoft: Overvalued but Still Bullish - Watching the 400–450Microsoft NASDAQ:MSFT
1. Quick Trade Plan (for those who want levels first) 🎯
Market Bias: Long term bullish, but in a late phase of the cycle.
Strategy: Don’t chase highs; buy the correction.
📌 Buy Zones
Primary Buy Zone: 400–450 USD
Strong support cluster and the preferred accumulation zone.
Aggressive Early Entries:
450–470 on sharp dips, but main focus remains 400–450.
⛔ Invalidation Level
345 USD
A break below this level invalidates the mid term bullish structure.
🎯 Take Profit Targets
TP1: ~600
TP2: 680–720
Potential completion of the final fifth wave.
🧭 For Current Holders
Continue holding while above 345.
Use a protective stop below 345 if trading shares.
Options traders may hedge instead.
🆕 For New Buyers
Avoid entering near ATHs.
Wait for the 400–450 pullback.
Use 345 as your hard-risk level.
2. Fundamental Overview: Great Business, Clearly Overvalued 💼📊
Microsoft has delivered very stable mid-teens growth for years:
Revenue growth: 15–17 percent annually
EPS growth: also 15–20 percent annually
Last 3 quarters: EPS +9–12 percent, revenue in the same range
This is a mature mega-cap, not a hyper-growth name.
⚠️ Buybacks Stopped
Company regularly bought back shares for six years
Stopped in March 2023 and hasn’t resumed
This removes a major EPS-boosting engine
📉 Valuation (Peter Lynch style)
EPS growth ≈ 15 percent
P/E ≈ 30
Stock trades at ~2x its fundamental fair value
Conclusion:
Amazing business. Predictable. Cash generative. 🔥
But fundamentally overpriced and in the late stage of its growth curve.
3. Technical Picture: Still Bullish, but Late in the Cycle 📐📈
📅 Long Term Channel Since 2010
Price has stayed inside a massive uptrend channel for 14+ years.
As long as MSFT remains inside it, the primary trend stays bullish.
📏 200-Day Moving Average
MSFT consistently bounces from the 200d MA on the weekly.
That keeps the structural bull trend intact.
🌊 Elliott Wave Context
Currently in the 5th sub-wave of a larger 3rd wave
Upside still possible
Potential final wave targets: 600–700
⏳ What Comes After
Once this major wave completes:
Expect a multi-year sideways cycle (5–7 years) as the market distributes the massive positions accumulated since 2009.
4. Current Structure: A Correction Is Likely Before New Highs 🔄
We already saw an A–B–C correction, but structure suggests another A–B–C, forming a zigzag, before the final move higher.
🎯 Why 400–450 Is the Key Zone
Major liquidity & support cluster
Aligns with channel midline and prior consolidation
Perfect area for a 5th wave launch
If MSFT hits 400–450 and bounces → 600–700 is back on the table.
5. What To Do Based on Your Situation 🧭
✔️ If You Already Hold MSFT
Stay in the trade while above 345
Expect volatility
You can hedge or use a stop below 345
🟦 If You Want to Enter
Don’t FOMO near the highs ❌
Wait for a pullback into 400–450
Start with partial size, add on confirmation
345 = hard stop
⚡ If You Trade Short Term
Shorts are counter-trend
Treat every drop as a tactical move, not a macro reversal
Unless 345 breaks
6. Final Thoughts ✨
Microsoft is still in a powerful long term uptrend, but:
Fundamentally overvalued
Technically late stage of its long cycle
Likely to give a clean buyable correction
Best accumulation zone: 400–450
Invalidation: 345
Upside targets: 600–700
It’s a “buy the dip, not the rip” market for MSFT.
Not financial advice — manage risk according to your plan.

Indexes Reverse ConfirmationMajor indexes, S&P, NASDAQ, DOW, SMALLCAP are testing of the April 2025 trend line. You can see this on the chart.
A move below this line would confirm that November's downward rally was wave 1 of a bear market.
If the S&P rises above 6870, this would confirm that November's rally was wave 4.
However, I believe we are in a bear market because:
1) The entire structure of the indices looks mature overall.
2) Gold is falling, regardless of the downward movement of the DXY, and they usually have an inverse correlation. Also, gold has not confirmed the ATH on silver.
3) The DXY fell throughout 2025, and now, I think it is ending the second wave, minute degree, that is, on the eve of the largest upward rally since 2022. The reaction on DXY may end near 97.85.
I wish you to be very rich!
Happy holidays!
