GER40 Holds Key Fibonacci Support – Upside Continuation LikelyThe GER40 chart indicates that a larger A-B-C corrective structure has been completed at the recent low, marked as (C), after which the index began a fresh impulsive upward move. From that bottom, price has formed a clean five-wave advance, confirming the start of a new bullish cycle. The recent pullback appears to be a normal Wave 2 correction, which has respected the 0.5–0.618 Fibonacci support zone, a typical area where corrections end. This suggests the correction is likely complete and the market is preparing for Wave 3, which is usually the strongest and fastest upward wave. As long as price holds above the Wave 2 low, the bullish Elliott Wave structure remains valid. Overall, the setup favors continued upside toward higher highs in the coming sessions.
Stay tuned!
@Money_Dictators
Thank you :)
Elliottwaveforecasts

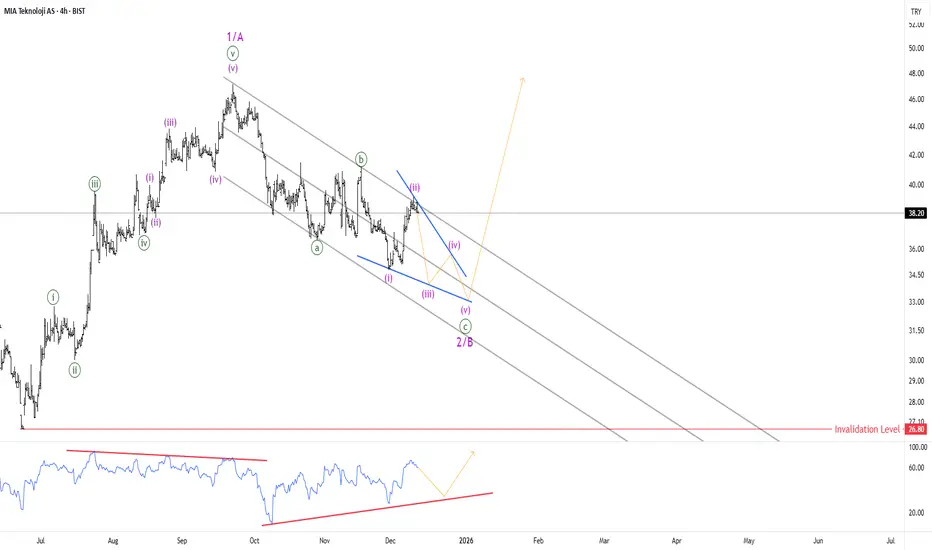
MIATK about the end abc correction after 5 waves upTurkish stock MIATK has completed 5 waves up now it's making it's correction in the shape of Zig-Zag.
BTCUSD: Holding Wave X or Slipping Lower?24 Nov 2025
27 Nov 2025
1 Dec 2025
17 Dec 2025
Bitcoin is still trading inside a falling channel, and the overall structure remains corrective. The recent bounce from lower levels lacks momentum and is overlapping, which signals consolidation rather than a trend reversal. Price continues to respect channel resistance, keeping the broader bias weak.
Wave X is acting as an important support zone around 83,822 , and as long as price holds above this level, further consolidation remains possible. This area is currently absorbing selling pressure and preventing immediate continuation to the downside.
However, a decisive breakdown below Wave X would signal that the correction is not complete. In that scenario, downside momentum is likely to expand, opening the path toward the 79,650 - 75,655 zone.
Stay Tuned
@Money_Dictators
RD :)

ETHUSD Bull Trap? - Final Breakdown Setup Is Almost Locked InETH is still stuck inside a clear falling channel, and the entire pattern is behaving like a corrective downtrend. The recent bounce from 2620 looks sharp, but it’s still just a counter-trend move. Nothing here screams trend reversal yet.
Wave 3 ending at 2620 , and now the price is rising for a Wave 4 retracement. Wave 4 usually moves back toward the mid-channel and tests previous breakdown zones.
The red box around 3200–3300 is the key trap zone. This is where sellers can return because Wave 4 must not enter Wave 1 territory, which sits higher. As long as ETH stays under that invalidation level, the bearish structure remains fully intact.
The move looks like a classic (a)-(b)-(c) correction inside Wave 4. Once this corrective bounce completes, the chart suggests ETH will resume the downward path. The channel alignment and wave symmetry both support a final Wave 5 drop.
If the bearish count plays out, ETH could slide toward 2400 – 2300 in Wave 5 before a major bottom forms. That’s the zone where sellers exhaust and buyers take control again. Until ETH breaks the invalidation level with strength, downside remains the more probable outcome.
Stay Tuned!
@Money_Dictators

ETHUSD: Reversal or Another Bull Trap?Look at this:
ETH played the trap perfectly. After pushing into the 3200–3400 resistance zone, price failed to sustain above it and rolled over, confirming that the move was distribution, not strength. Sellers stepped in exactly where a Wave 4 rally should fail.
The rejection was followed by a clean breakdown of the parallel rising channel, which shifts the short-term bias back in favor of the bears. That channel was the last structure holding the corrective bounce together. Once it broke, the bullish case weakened sharply.
This drop reinforces the view that the move up from 2620 was only a Wave 4 correction, not the start of a new trend. With Wave 4 likely complete, ETH appears to be transitioning into Wave 5 of the broader corrective decline.
As long as price remains below the broken channel and prior resistance, downside continuation remains the dominant scenario. The structure opens the door for a retest of 2620 , with a deeper extension toward 2465 if selling pressure accelerates.
Until ETH reclaims the channel with strength and acceptance, this remains a sell-the-bounce environment. The warning came at the trap zone, and the market is now following through.
Stay Tuned!
Money Dictators,
R.D :)

USDT.D(based on NEowave)patterns of eth and btc is changed.
crypto market will start a bullish wave soon.

The Road to DOW 100KWhy the Fourth Turning Won’t Resolve Until Super Cycle Wave III Peaks and Wave IV Finds Bottom:
As we close out 2025 with the Dow Jones Industrial Average within reach of the psychological 50,000 level and despite all the well-deserved doom and gloom, the question on every die-hard bullish investor’s mind is not if the index will reach 100,000, but when — and what price will be paid along the way.
Some analysts interpret the structure as Grand Super Cycle Wave III (or V), depending on where they anchor the pre-industrial baseline. This distinction does not alter the implications: under both counts, the current advance is still part of an extended third wave, and third waves are not where secular crises resolve. They are where excess accumulates.
The rarely seen proprietary chart above from 1693, which splices British Stock prices and the Clement Burgess Index to the Dow, presents a radical yet rigorous Elliott Wave-based perspective:
Before unpacking the connections, a brief orientation is helpful. Elliott Wave degree structures range from small, short-term patterns up to century-scale formations known as Cycle, Super Cycle, and Grand Super Cycle. These higher-order waves capture long economic booms, demographic arcs, technological eras, and broad civilizational moods. When an impulse of this magnitude is still unfolding, the society riding atop it rarely enters true crisis resolution until the wave completes.
The entire advance of the Dow from the 1896 low is part of one single Super Cycle III wave. It is currently in the late stages of a smaller and ongoing 16-year Cycle Wave V within a larger GRAND SUPER CYCLE Wave III (or V, depending on the higher-degree interpretation). The implications are profound.
NOTE: It took 66 years (1900-1966) for the Dow to advance 10x from 100 to 1000, then only 33 years (1966-1999) for another 10x move from 1000 to 10,000. If Elliott’s rule of alternation applies, it might be 66 years from 1999, or 2065, before the Dow advances another 10x from 10,000 to the 100,000 level. Should a Venezuela-like inflation occur in the coming years, it is conceivable that the Dow reaches its 10x 100K milestone 33 years from 1999, or by 2032.
The generational crisis known as the Fourth Turning — the societal upheaval Strauss and Howe originally predicted would end by 2026 — will not find resolution until Super Cycle Wave III tops and its corresponding Wave IV bottoms, likely sometime between 2030 and 2036.
BULLISH NOTE: As captioned beneath the chart above, it is plausible that strong inflationary winds can extend the current 16-year Cycle Wave V to 2030-2032, inverting our suspicion for a severe decline into this period. If this occurs, Super Cycle III will have thrown over the upper trend channel and be marked accordingly.
Because Super Cycle III has not yet peaked, the conditions required for a true Fourth Turning catharsis have not yet formed. Instead of concluding, the crisis continues to compound—geopolitical fractures, monetary instability, demographic strain—held in suspension by a still-advancing secular market wave. The tension builds, but the break has not arrived.
Until Super Cycle III peaks, perhaps in 2026, when it surpasses the 5X threshold of 50K after passing its last major 10X milestone at 10K in 1999, the path remains upward with violent trepidation.
The Grand Channel: A 330-Year Perspective
When British stock data from 1693 is spliced with the Dow Jones Industrial Average beginning in 1896, a remarkable parallel channel emerges:
The lower trendline connects the Clement Burgess 1857 low, the 1896 low, and the 1932 low.
The upper trendline is a parallel copy drawn from the 1720 South Sea Bubble peak, which aligns rather nicely with the current print highs in the Dow for 2025-2026. A throw-over above the upper trend channel is always possible.
This channel has contained the entire modern equity advance for over three centuries. The current price action is pressing hard against the upper boundary — a classic termination signal in Elliott Wave analysis.
The Grand Super Cycle uptrend channel from 1693 to the present.
Super Cycle Degree: One Unfolding Impulse
The entire move from 1896 is labeled as a single Super Cycle advance:
Super Cycle I — 1857 low to 1881 high
Super Cycle II — 1929 crested with an expanded Cycle degree B wave peak high leading to the 1932 low (a sharp, primary five-wave down Cycle degree C-Wave correction terminating Super Cycle II).
Super Cycle III — 1932 low to present (extended, currently completing an extended Cycle V)
The post-1932 advance is not five complete Super Cycle waves. It is an extended third at Super Cycle degree still in progress, with the current rally from the 2009 low representing Cycle V within that larger III wave.
This labeling reconciles and defines the extraordinary duration and amplitude of the bull market without violating Elliott’s rules of proportionality and alternation.
Primary and Cycle Degree: The Final Leg
Within the ongoing Super Cycle III, the advance since 1932 subdivides into five clear Cycle waves with an additional subdivision at the primary degree between 1942 and 1999.:
Cycle I — 1932–1937
Cycle II — 1937–1942
Subdivided Primary Degree (within Cycle III):
Primary 1 — 1942-1946
Primary 2 — 1946-1949
Primary 3 — 1949-1965
Primary 4 — 1965-1982
Primary 5 — 1982-1999
Cycle III — 1942–1999
Cycle IV — 1999–2009
Cycle V — 2009-present (extended, currently in its terminal phase 2025-2032)
The post-2009 Cycle degree rally is the last of Cycle V (terminal to Super Cycle III from the 1932 low) — the structure that produced the extraordinary gains of the past sixteen years.
FOUR DEGREES of TREND: Grand Super Cycle Waves are the largest Roman Numerals noted in red, Super Cycle labels are in black, Cycle degree in blue, and the smallest Primary waves are illustrated with standard red numerals and letters.
The Fourth Turning Resolution
The Strauss-Howe updated Fourth Turning framework predicts a period of intense societal crisis peaking in the late 2020s to early 2030s.
In Elliott Wave terms, this crisis corresponds to Super Cycle Wave IV — the deep, multi-year correction that must follow the completion of Super Cycle III.
This correction will likely take the form of a sharp zig-zag, or complex combination, lasting 3–8 years and retracing at least 38% of the entire advance from 1857. Such a decline would drive the Dow down toward the COVID lows of 2020, near the 18,000 level.
The resolution of this Fourth Turning — the rebirth phase — will not begin until Super Cycle Wave IV finds its bottom, projected to occur within the 2030–2036 timeframe.
Only then will Super Cycle Wave V begin — the final advance that carries the Dow to its next 10x target of 100,000.
Conclusion
The market is not yet in the final stages of a multi-century bull market ending in a grand cycle collapse, but rather approaching a Super Cycle Wave IV bear market event , which could still strip the Dow by 60-65% before the Super Cycle V wave bull resumes. The Dow is in the late stages of a multi-century third wave that still has one more explosive leg ahead to tag the Grand Super Cycle terminal.
The Fourth Turning crisis will be severe, but it will be a corrective event within a larger bullish structure — not the end of the Grand Super Cycle advance.
Although investors may wish to sidestep the pending decline, those who mistake Super Cycle Wave IV for the end of the bull market will miss the greatest opportunity of the coming generation.
The channel is speaking.
The waves are clear.
And after some much-needed, long overdue, and well-deserved pain, 100,000 on the Dow remains not just possible — but inevitable. Let’s hope so, anyway.

GUBRF Turkish stock In my opinion,Gubrf even if it makes new highs it seems like an under correction...Which in this case it seems like a big Flat correction,in this particular case wave A of the Flat also a flat itself...If that scneraio proven itself correct than it's a huge think...Many people belive small traders get caught up in the downside corrections by manipulations but i don't see it that way..
There are multiple patterns in EWP which repeats itself over and over again...We will see if my analysis is correct or not,i expect a 5 wave move down stongly after it completes wave B of the flat...
The other scneraio is that is not a flat but WXY correction means again move to the downside but the difference is it will not go down in 5 waves but 3...
Any case people should pay attention those scneraios.

GBPUSD | Prices Continue Uptrend✅ Short-Term Price Direction (H4):
After a sharp decline from its peak, the H4 movement indicates a strong short-term uptrend from the recent low around 1.2100 - 1.2200. The price has created a series of clear Higher Highs (HH) and Higher Lows (HL).
The price is currently consolidating below Short-Term Resistance around 1.3100 - 1.3200, which is also the Low Volume Node (LVN) on the Daily Volume Profile. This indicates potential uncertainty after the rapid rise.
This consolidation is occurring within the newly formed High Volume Node (HVN) area on the H4 (around 1.2900 - 1.3000), which serves as strong Short-Term Support.
Short-Term Bias: Bullish (Upward), as the HH and HL structures on the H4 are still intact.
✅ H4 Key Levels:
- Short-Term Resistance (Consolidation Top): Around 1.3100 - 1.3200.
- Short-Term Support (HVN/HL): Range 1.2900 - 1.3000 (Important).
- H4 Value Area Low: Around 1.2700.
✅ Potential Scenarios
- Strong Bullish Scenario: Price successfully breaks through and maintains above the Short-Term Resistance at 1.3200, paving the way for a test of the Daily POC at 1.3400 - 1.3500.
- Correction/Reversal Scenario: A break and close below the Short-Term H4 Support (1.2900) will invalidate the H4 bullish bias and could lead to further declines to test the H4 Value Area Low at 1.2700 and the Daily Key Support.

USDCAD - Breakout Will Flip the Trend BullishUSDCAD has been sliding inside a well-defined descending channel, completing a full five-wave drop toward the support zone. The structure from the top looks corrective rather than impulsive. That means the downtrend is weakening as it reaches its final leg.
Your count shows Wave 3 finishing at the dashed red line zone, followed by a small Wave 4 bounce, and now the market is pushing into the last Wave 5. This final drop is expected to target the Fibonacci levels near 1.3915 and 1.3895 . Nothing suggests strength until those levels are tested.
The price is still trapped inside the downward channel, and every bounce has been getting sold. That confirms sellers are still in control for now. Wave (C) is close to completion, but buyers haven’t proven anything yet.
The bullish outlook only becomes valid after a clean breakout above the channel. Without that break, any upside move is just noise inside a bearish structure. The breakout must hold with a higher low to confirm a trend reversal.
If the channel breaks decisively, a strong bullish reversal toward 1.40+ becomes possible. The entire structure suggests the downtrend is aging, so a major upside swing is likely once sellers exhaust. Until then, downside targets remain open and caution is necessary.
Stay Tuned!
@Money_Dictators

Microsoft: Overvalued but Still Bullish - Watching the 400–450Microsoft NASDAQ:MSFT
1. Quick Trade Plan (for those who want levels first) 🎯
Market Bias: Long term bullish, but in a late phase of the cycle.
Strategy: Don’t chase highs; buy the correction.
📌 Buy Zones
Primary Buy Zone: 400–450 USD
Strong support cluster and the preferred accumulation zone.
Aggressive Early Entries:
450–470 on sharp dips, but main focus remains 400–450.
⛔ Invalidation Level
345 USD
A break below this level invalidates the mid term bullish structure.
🎯 Take Profit Targets
TP1: ~600
TP2: 680–720
Potential completion of the final fifth wave.
🧭 For Current Holders
Continue holding while above 345.
Use a protective stop below 345 if trading shares.
Options traders may hedge instead.
🆕 For New Buyers
Avoid entering near ATHs.
Wait for the 400–450 pullback.
Use 345 as your hard-risk level.
2. Fundamental Overview: Great Business, Clearly Overvalued 💼📊
Microsoft has delivered very stable mid-teens growth for years:
Revenue growth: 15–17 percent annually
EPS growth: also 15–20 percent annually
Last 3 quarters: EPS +9–12 percent, revenue in the same range
This is a mature mega-cap, not a hyper-growth name.
⚠️ Buybacks Stopped
Company regularly bought back shares for six years
Stopped in March 2023 and hasn’t resumed
This removes a major EPS-boosting engine
📉 Valuation (Peter Lynch style)
EPS growth ≈ 15 percent
P/E ≈ 30
Stock trades at ~2x its fundamental fair value
Conclusion:
Amazing business. Predictable. Cash generative. 🔥
But fundamentally overpriced and in the late stage of its growth curve.
3. Technical Picture: Still Bullish, but Late in the Cycle 📐📈
📅 Long Term Channel Since 2010
Price has stayed inside a massive uptrend channel for 14+ years.
As long as MSFT remains inside it, the primary trend stays bullish.
📏 200-Day Moving Average
MSFT consistently bounces from the 200d MA on the weekly.
That keeps the structural bull trend intact.
🌊 Elliott Wave Context
Currently in the 5th sub-wave of a larger 3rd wave
Upside still possible
Potential final wave targets: 600–700
⏳ What Comes After
Once this major wave completes:
Expect a multi-year sideways cycle (5–7 years) as the market distributes the massive positions accumulated since 2009.
4. Current Structure: A Correction Is Likely Before New Highs 🔄
We already saw an A–B–C correction, but structure suggests another A–B–C, forming a zigzag, before the final move higher.
🎯 Why 400–450 Is the Key Zone
Major liquidity & support cluster
Aligns with channel midline and prior consolidation
Perfect area for a 5th wave launch
If MSFT hits 400–450 and bounces → 600–700 is back on the table.
5. What To Do Based on Your Situation 🧭
✔️ If You Already Hold MSFT
Stay in the trade while above 345
Expect volatility
You can hedge or use a stop below 345
🟦 If You Want to Enter
Don’t FOMO near the highs ❌
Wait for a pullback into 400–450
Start with partial size, add on confirmation
345 = hard stop
⚡ If You Trade Short Term
Shorts are counter-trend
Treat every drop as a tactical move, not a macro reversal
Unless 345 breaks
6. Final Thoughts ✨
Microsoft is still in a powerful long term uptrend, but:
Fundamentally overvalued
Technically late stage of its long cycle
Likely to give a clean buyable correction
Best accumulation zone: 400–450
Invalidation: 345
Upside targets: 600–700
It’s a “buy the dip, not the rip” market for MSFT.
Not financial advice — manage risk according to your plan.

Indexes Reverse ConfirmationMajor indexes, S&P, NASDAQ, DOW, SMALLCAP are testing of the April 2025 trend line. You can see this on the chart.
A move below this line would confirm that November's downward rally was wave 1 of a bear market.
If the S&P rises above 6870, this would confirm that November's rally was wave 4.
However, I believe we are in a bear market because:
1) The entire structure of the indices looks mature overall.
2) Gold is falling, regardless of the downward movement of the DXY, and they usually have an inverse correlation. Also, gold has not confirmed the ATH on silver.
3) The DXY fell throughout 2025, and now, I think it is ending the second wave, minute degree, that is, on the eve of the largest upward rally since 2022. The reaction on DXY may end near 97.85.
I wish you to be very rich!
Happy holidays!

$BTCUSD - #Bitcoin cycle analysisHi guys! 👋🏻
🔔I'd like to share with you my current Bitcoin BTCUSD analysis here.
🔔 The last correction is taking an impulse 5-wave structure, it seeems like we are about to complete the 5th wave of the Intermediate A, bounce back to $102K to complete the B and drop back to the levels near $70K - 64K to complete the correction.
🔔 I know it sounds disappointing but we need a correction to regain power. Now, before throwing tomatoes, please see cycle charts below. And never underestimate the power and rules of cycles in the market.
🔔 Why channels always matter
🔔Wave paths
🔔Fibo
🔔 Path to $150K shall look like this
🔔Concetration of Supports and Resistances
Sharing for educational purposes!
✊🏻 Good luck with your trades! ✊🏻
If you like the idea hit the 👍🏻 button, follow me for more ideas.

Wave 4 Trap Complete as Bitcoin Prepares for Final Flush6 Days Ago:
3 Days Ago:
1 December 2025
BTC moved into the expected corrective zone last week but stayed inside the falling channel, showing that wave 4 was only a temporary bounce. Buyers failed to break any key resistance, and momentum kept fading. This kept the broader outlook bearish and hinted that wave 5 was still pending.
BTC has now broken below the short-term rising structure, confirming that wave 4 topped out near the 0.786 retracement. The rejection from that zone triggered a clean shift back into the main downtrend, with price sliding toward the key 86,280 support. As long as BTC holds below the upper channel boundary, the market remains positioned for further downside, with the 1.618 extension around 79,650 emerging as the next probable target for wave 5 completion.
Note:
The rejection from the 0.786–resistance zone shows buyers failed to take control.
Wave B at 86,280 is the immediate pivot level; staying below it keeps downside pressure intact.
The next major target for wave 5 sits near the 1.618 extension around 79,650.

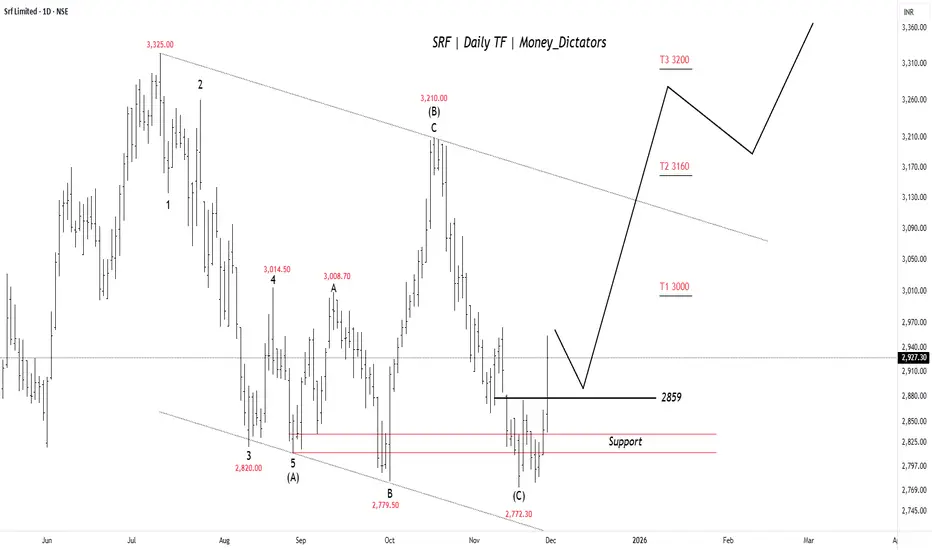
SRF on the Edge of a Sharp BreakoutSRF seems to have finished its ABC correction near the 2770–2800 support zone, and the price has bounced back above 2859 , which now acts as a short-term trigger. If the stock stays above this level, it can move toward 3000 first, then 3160 , and possibly 3200 . The chart shows buyers gradually taking control again after the correction, but the outlook stays positive only as long as price holds above the support region.
Stay Tuned!
@Money_Dictators
GBP/USD Signals Trend Shift – Impulsive Upside ExpectedThe chart shows that GBP/USD has completed a full W–X–Y corrective pattern, with the final wave (y) and its C wave forming a clean bottom near the long-term support line. From that low, price has started a strong upward move, which looks like the beginning of a new impulsive Wave 1. The current pullback toward the 0.382–0.618 Fibonacci zone is typical behavior for a Wave 2 retracement before the next strong rally. As long as the price stays above the invalidation level at 1.30094 (the wave (y) bottom), the bullish scenario remains valid. This suggests that GBP/USD is preparing for a larger Wave 3 push to the upside.
Stay tuned!
@Money_Dictators
Thank you :)

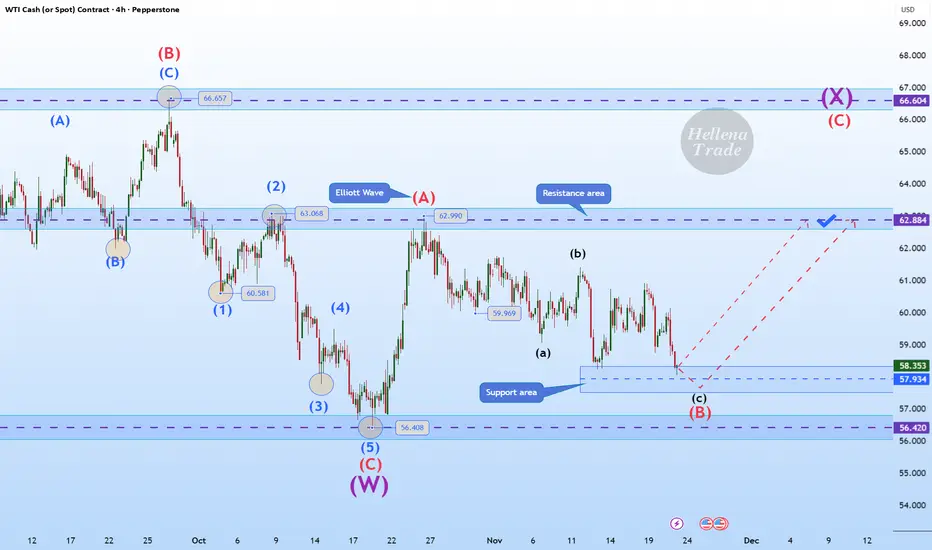
Hellena | Oil (4H): LONG to the area of the maximum of wave “A”.Colleagues, the past forecast has not been canceled, but I see some changes and therefore feel it is necessary to make a fresh forecast.
Apparently, the corrective wave “B” has extended to the area of 57.930. This is quite close to the low of wave “C” at 56.408 and the price should not update it, otherwise there will be a full-fledged break of the structure.
In connection with the above, I think that the price is already completing the downward movement and I expect the resumption of the upward movement at least to the area of the maximum of wave “A” - 62.990.
Manage your capital correctly and competently! Only enter trades based on reliable patterns!
BTCUSD - Wave 5 Decline Still Likely AheadPrevious Analysis:
BTC is approaching a critical reaction zone where the current rise looks more like a corrective push than the start of a new trend. Price is moving toward the highlighted supply region, which aligns with a potential wave 4 completion inside the descending channel. The structure from the recent low shows an internal a–b–c formation, suggesting this bounce could run into exhaustion as it enters the red zone. Unless BTC breaks out of the channel with conviction, the broader momentum still leans bearish. A rejection from this region would likely trigger the final wave 5 leg, driving price toward deeper Fibonacci levels and completing the corrective cycle before any meaningful recovery attempt can begin.
Stay Tuned!
@Money_Dictators

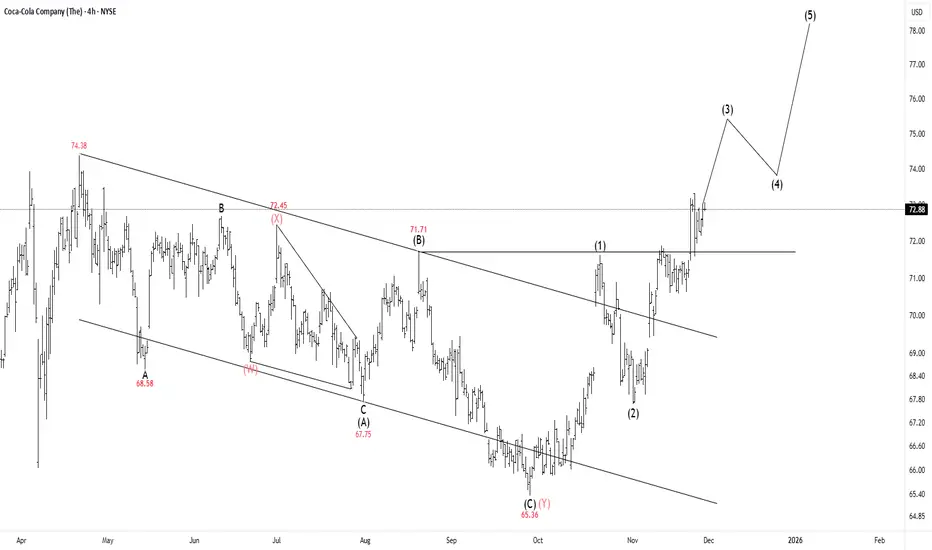
Coca Cola - $78 Target for New Highs Imminent 🥤The Coca-Cola Company (KO) suggests the stock has definitively finished a long period of price correction and is now ready for a significant upward trend. This pullback, which had been complex, officially concluded when the price hit its low at $65.36. Critically, the strong bounce that followed has broken the stock out of its long-term downward trading range, confirming that the selling phase is fully over.
Following this successful breakout, the chart indicates that a major new five-wave rally is starting, with the stock currently engaging the powerful middle part of this upswing (Wave 3). The analysis projects that after completing this rally, the price will ultimately reach a target around $78.00. This suggests that the stock is now in a strong phase of growth, making it a key focus for traders looking for the next major increase in value.
Stay Tuned!
@Money_Dictators
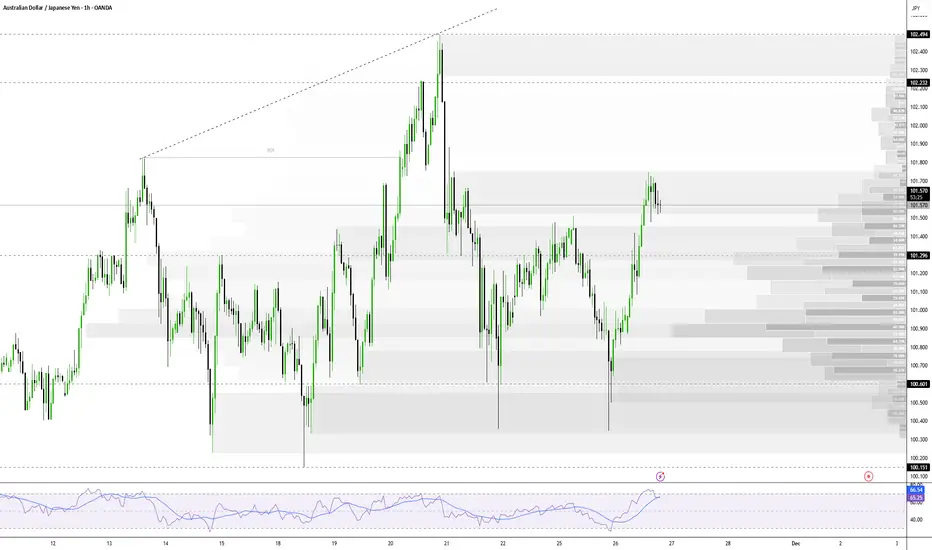
AUD/JPY | Bullish Momentum After Australian CPI Data ReleaseThe AUD/JPY pair gained a strong bullish boost after higher-than-expected Australian consumer inflation data, which dampened speculation of an interest rate cut by the Reserve Bank of Australia (RBA). Currently, the price is at a new weekly high and awaits confirmation of a breakout.
1. Market Fundamental Factors (Drivers of the Upside)
Higher Australian Inflation: The hotter (higher) Australian consumer inflation figures dampened market bets for further interest rate cuts by the RBA.
Impact: This significantly boosted the Australian Dollar (AUD), lifting the AUD/JPY pair to the 101.70 area (a new weekly high).
2. Technical Analysis and Indicators
Long-Term Bias: The 100-day Simple Moving Average (SMA) is rising steadily, and the price is holding above it, reinforcing the bullish bias.
Trend Conditions: Trend conditions will remain favorable as long as the price is above the rising SMA, which is currently below 98.00.
3. Bullish Scenario ⬆️
Strong Upside Trigger: Bulls await a breakout through the nearly three-week-old trading range (currently around 101.70). A decisive MACD push into positive territory would strengthen this case.
Next Target: A move will head towards the 102.45-102.50 region, or the highest level since July 2024, touched last week.
4. Bearish Scenario ⬇️
Initial Key Support: Weakness below the 101.40 area is likely to find decent support near the 101.00 round number.
Trading Range Support: A break below 101.00 could retest the trading range support around the 100.40-100.35 region.
Bias Reversal: A convincing break below 100.35 could trigger technical selling and drag the price below the psychological 100.00 mark, towards the next relevant support near the 99.65 - 99.60 region.
Gold – Daily Chart: Expanding Flat Bearish StructureWave (IV) is developing as a complex expanding flat on the daily timeframe.
The current count projects a deep wave C, with downside Fibonacci targets (3,250/2,920) aligning closely to the base channel support.
Sharp reversals remain a risk as this structure unfolds, and volatility is expected near the key channel-fib confluence.
Expanding flat structure mapped
Wave C targets anchored at base channel and fib zones
Technical roadmap highlights where reversals and volatility may spike

Dogecoin minor degree TriangleThe Aprile 2025 - November figure at Dogecoin has triangle signs.
Pay attention to yellow markers at DOGE chart and at USDt dominance chart. Here are points where might be good to take profit, if you are in LONG and open SHORT.
Waves E of triangles are frequently advancing modestly, thus 0.3085 might be a very terminal point for the figure, which may not be reached.
I think Dogecoin is in a bear market since 2021.
Please note, this triangle is related to Nov 2024 rally, and that rally is compound into a bigger bear trend, intermediary degree. The target for that degree is below 2022 July low.
If we had a first wave at USDt dominance, the norms for pullback for first waves are between 61 to 82%.
Good luck, I wish you will be very rich.

SOLUSDT - 30M ANALYSISHey traders!
Based on the recent price action, SOL has finished a clean 5-wave impulse down, which usually signals the start of a correction. Right now the structure looks very much like a developing Zig-Zag:
- Wave A has played out,
- Wave B is close to completing,
- and I’m watching for a break of the B-wave resistance to confirm the start of Wave C to the
upside. If that happens, the next target zone sits around 146–150.
However, it’s important to keep the alternative in mind:
Wave B can still form as an expanded flat, meaning price could dip lower and even take out the Wave 5 low before reversing. If that happens, the bullish ABC idea is still possible — it just becomes a deeper setup.
So for now:
Keep an eye on how price behaves around the B resistance level, stay patient for confirmation, and don’t forget your risk management.
This is not financial advice — always DYOR.
