CRYPTO: BTC.D (1W)Currently, we are at a crucial point where the price is playing at the trendline. Once we see a breakout + retest, this is our time to shine! We can see BTC.D hitting targets from 47.06% to 43.68% On the other hand, if the price bounces on the trendline, it may reach to 69% to 73.59%.
I am leaning towards the breakout + retest as of the moment since it is showing clear signs that we are going to see a bull run in the coming months.
Elliottwaveforecasts

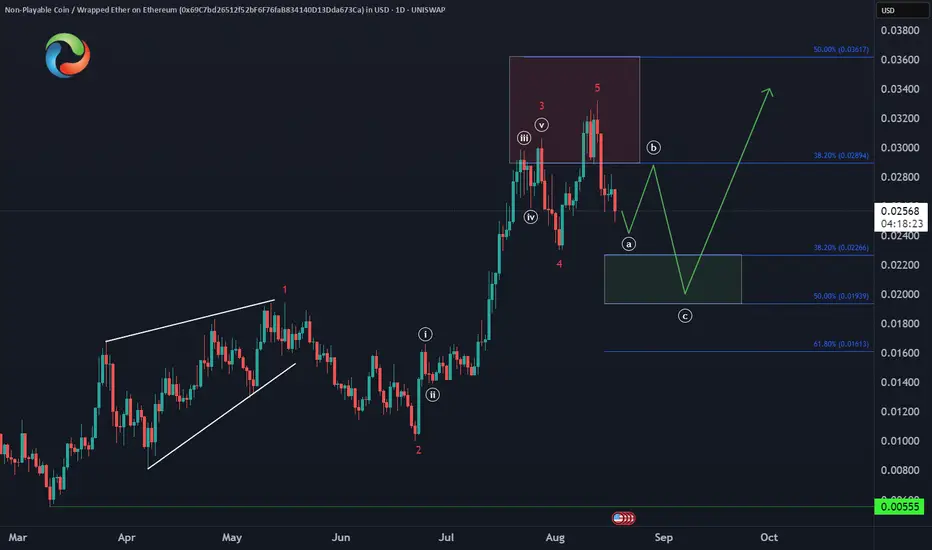
NonPlayableCoin NPC Bullish Setup in PlayBITGET:NPCUSDT has completed a 5-wave advance off the March low, and is now in a 3-wave pullback.
📍 Watch for buyers to step in around the $0.022–$0.019 zone, setting the stage for the next leg higher.
🚀 Structure favors continuation once support holds.
Dogecoin Correction Going According to Plan🐶 CRYPTO:DOGEUSD is unfolding a 3-wave pullback, with the equal legs zone at $0.204–$0.195 acting as the next key support.
📈 A bullish reaction is expected from this area as the structure completes.
Will Dogecoin Hold the August Low at $0.18?
Are you ready to load your bags when it matters most?
🎯 Smart money waits for structure.

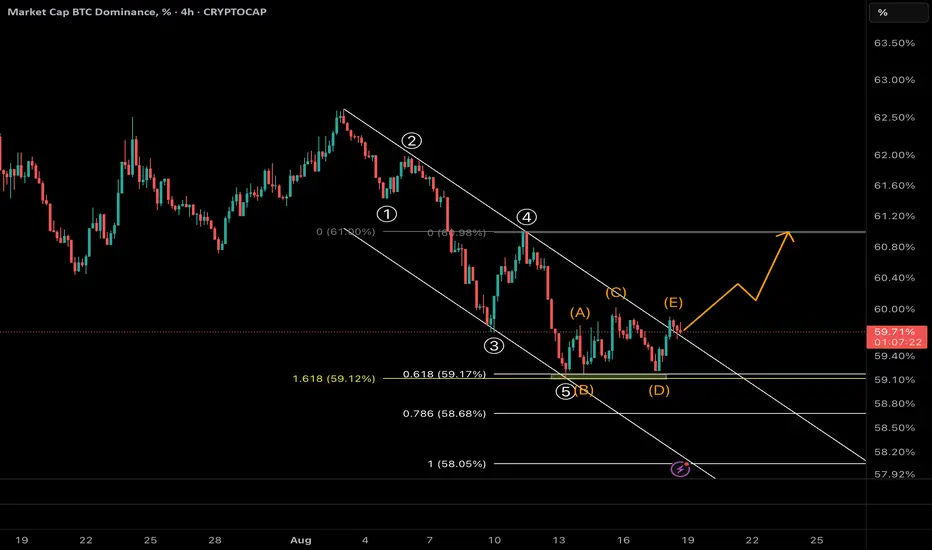
Bitcoin Dominance Breaks Out: Altcoins in Danger?🔎 BTC Dominance (BTC.D) – 4H Analysis
• The 5-wave decline has completed right at the 1.618 Fibonacci extension (59.1%), confirming a potential bottom.
• A contracting triangle (A–B–C–D–E) has formed and just broke to the upside, coinciding with the breakout of the descending channel.
⸻
📈 Main Scenario
• With this breakout, BTC dominance is entering a new bullish phase.
• Next targets:
• 60.8% – 61.0% (key Fibonacci resistance + channel top)
• If broken, possible extension to 61.4% – 62.0%
⸻
⚠️ Implications for Altcoins
• Rising BTC dominance usually means capital is rotating into Bitcoin → leading to heavy sell-offs in altcoins.
• Alt traders should be cautious: this move can trigger a broad correction across the altcoin market.
⸻
📉 Alternative Scenario
• If BTC.D falls back below 59.3%, the breakout may turn into a fakeout, and a retest of lower levels could follow.
⸻
✅ Conclusion:
The breakout above the descending channel is a strong signal of trend reversal. As long as BTC.D stays above 59.3%, the path toward 61%+ is favored. This could mark the beginning of a tough phase for altcoins.
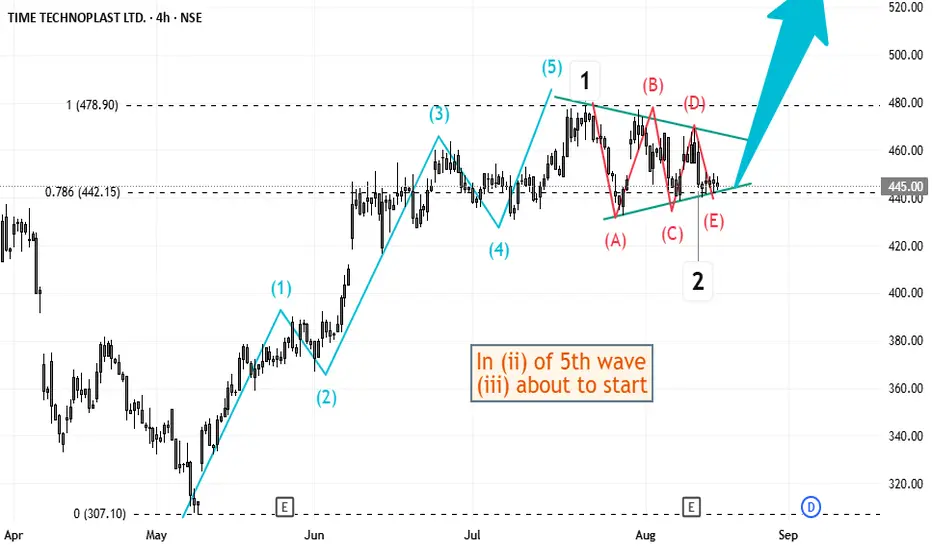
Elliott Wave Analysis of Time Technoplast TIMETECHNOThis script appears to have just completed a triangle retraction after a 5 waves move in 5th wave. This means, a next 5 waves move up might be in play on daily time-frame. But the 2nd wave did not go deep as usual, so one also needs to be cautious of the possibility of a complex retracement forming.
BTCUSDT:Elliot Wave 15minAccording to the previous analysis, it is expected that Bitcoin's upward trend will occur with the formation of waves 1 and 2. Considering the market structure, the market structure must be broken and stabilized above the previous ceiling, followed by a decline towards liquidity as the second wave, after which we will expect growth.

ASX LIMITED: 15 AUG, 2025 ELLIOTT WAVE ANALYSISConclusion: Bearish pressure is increasing, wave C)-blue is likely pushing lower.
Key Points: Wave C)-blue is moving lower, targeting 48.12. While price must remain below 73.88 to remain bearish.
On the other hand, when price action moves above 73.88, it is directly suggesting that wave 3)-purple is moving much higher at that point.
©By Hua Chi Cuong (Shane), CEWA-M (Certified Elliott Wave Analyst - Master Level).

BITCOIN (BTCUSDT): 13 AUG, 2025 - ELLIOTT WAVE ANALYSISConclusion: Wave iii))-green is continuing to move higher.
Key Points: Wave iii))-green is extending, and subdividing into wave i)-purple to wave iv)-purple. I am not sure if wave iv)-purple is finished, but it should not move lower than 115,720 (Invalidation Point: Wave 4 should not overlap wave 1).
On the other hand, 118,050.11 acts as a key level that price needs to hold higher, to gain confidence, weight for this view.
©By Hua Chi Cuong (Shane), CEWA-M | Certified Elliott Wave Analyst - Master Level

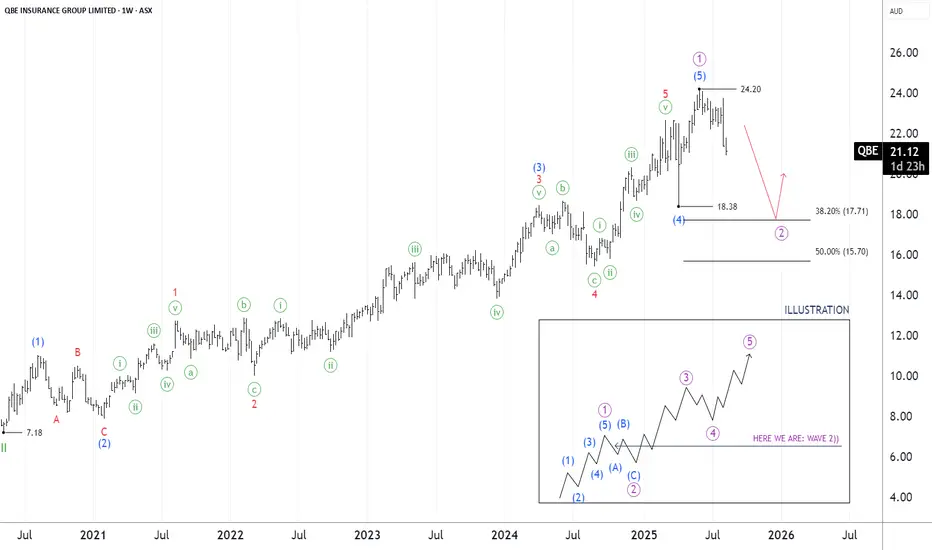
ASX:QBE - 13 AUG, 2025 - ELLIOTT WAVE ANALYSISConclusion: Wave 2))-purple is moving lower.
Key Points: Wave 1))-purple ended at the high of 24.20, wave 2))-purple is unfolding towards 17.38 - 17.50. So there is no convincing evidence of a developing Bullish trend, instead it shows a downward move of the market.
On the other hand, I would only reconsider the bullish market view if the market moves above 24.20 quickly enough, strongly enough.
©By Hua Chi Cuong (Shane), CEWA-M | Certififed Elliott Wave Analyst - Master Level
ASX:QAN - 13 AUG, 2025 - ELLIOTT WAVE ANALYSISConclusion: Wave 5)-blue could move higher.
Key Points: Wave 4))-purple ended at 7.55 and wave 5))-purple has been moving higher since then. It is subdividing into wave 1)-blue to wave 5)-blue. Now wave 5)-blue is extended and subdividing into wave 1-red to wave 3-red.
Basically its wave 3-red will move higher, targeting targets around 11.90 - 12.68.
While price must remain above 10.63 to keep this Bullish view valid.

ASX:PLS - 13 AUG, 2025 - ELLIOTT WAVE ANALYSISConclusion: Short-term, wave 2-red is moving lower.
Key points: Wave 2)-blue has ended at 1.070 and wave 3)-blue is moving much higher. It is subdividing into wave 1-red, which has just completed. Wave 2-red is now probably unfolding to push lower, targeting a low around 1.710.
So short-term, this stock is moving lower. Medium-term, it has a lot more to go.
©By Hua Chi Cuong (Shane), CEWA-M | Certififed Elliott Wave Analyst - Master Level

SILVER (XAG/USD): 12 AUG, 2025 | ELLIOTT WAVE ANALYSISConclusion: The C-red wave may be moving lower.
Bottom line: The C-red wave is pushing down to the nearest target at 37.07 or possibly lower, depending on the price action reaction at that level.
On the other hand, the ALT alternate wave count depicted on the chart is gaining weight. But in the short term, the ALT view is likely to also move to 37.07. Then, if it moves higher above 38.50, it will trigger the ALT scenario.
Invalidation Point: 39.52
©By Hua Chi Cuong (Shane), CEWA-M | Certified Elliott Wave Analysis - Master Level.

BITCOIN (BTCUSDT): 12 AUG, 2025 || ELLIOTT WAVE ANALYSISConclusion: Wave iii))-green is continuing to move higher.
Key Points: Wave iii))-green is extending, and subdividing into wave i)-purple to wave iv)-purple. I am not sure if wave iv)-purple is finished, but it should not move lower than 115,720 (Invalidation Point: Wave 4 should not overlap wave 1).
On the other hand, 118,050.11 acts as a key level that price needs to hold higher, to gain confidence, weight for this view.
©By Hua Chi Cuong (Shane), CEWA-M | Certified Elliott Wave Analyst - Master Level

GOLD (XAU/USD): 12 AUG, 2025 | ElLLIOTT WAVE ANALYSIS©Hua Cuong (Shane), CEWA-M | Certified Elliott Wave Analyst - Master Level
Conclusion: Wave C))-green is moving lower.
Key Points: Wave C could be headed towards 3,322 or lower like 3,267.937.
Alt wave count scenario is gaining weight, but in the short term, it will probably also target 3,322.056. If gold then moves above 3,409.040, it will trigger the ALT count, otherwise it will continue to move lower to 3,267.
-> Key Point: 3,322.056.

Nike - A buy after pullbackNike's daily chart shows a competed five-wave advance off the lows from 52.28, with a subsequent correction underway. We believe that we are in wave C of this correction which could take prices back to 68-66 levels before another move higher unfolds towards 100.00

USD/JPY: Fifth Wave Target in SightUSD/JPY is painting a textbook five-wave impulse structure from the recent lows, and we're now positioned for what could be the final act of this motive sequence.
Current Wave Count
✅ Waves 1-3 Complete: Clean impulsive structure with wave 3 showing strong extension
✅ Wave 4 in Progress: Currently correcting from the 150.94 high
🎯 Wave 5 Setup: Targeting completion around 151.95 - 152.20
Key Levels to Watch
Support Zone: 150.00 area (ideal wave 4 retracement)
This aligns with wave principle fourth-wave correction parameters
Provides a healthy pullback without threatening wave 1 overlap
Target: 151.95 - 152.20 zone for wave 5 completion
Classic 5 vs 1+3 projection
Trade Strategy
Monitor for supportive price action near 150.00
Look for an impulsive price action to confirm wave 5 beginning
Structure suggests one more leg higher before a larger correction
The beauty of Elliott Wave: when the count is this clean, the roadmap becomes crystal clear. Let's see if USD/JPY delivers this final push to complete the sequence.

EUR/USD: Is the Next Big Correction Already Underway?EUR/USD: After 120 Days Up, Are We Entering a Year-Long Correction? What Market Cycles Reveal.
As EUR/USD traders digest the stunning 120-day, five-wave rally from the January 2025 lows to the July 2025 highs, the big question now is—what's next? The clues are right in front of us, and they suggest we may be headed into an extended corrective phase, one that could last until the very start of 2026.
What the Current Structure Shows
Motive Wave Complete: The impulsive surge just wrapped up a textbook five-wave move, with each leg unfolding cleanly and culminating in a July top. Motive waves like this are the engines of market trends—fast-moving, decisive, and packed with momentum.
Corrective Phase Incoming: But all trends eventually pause, and here the evidence points to a shift. Corrective waves—unlike their trending counterparts—are time-consuming, choppy, and have a tendency to frustrate impatient traders. The completed motive wave took just 120 days, but corrections often take much longer to play out. According to this chart, the probable timeline for this correction extends into December 2025, or possibly beyond.
Why the Count Is Labelled This Way
Wave Duration Clue: One of the most reliable Elliott Wave principles is that corrective phases outlast the sharp, high-energy motive moves that precede them. With the motive wave spanning four months, a comparable correction stretching into late 2025 makes perfect structural sense.
Cycle Awareness, Major Turning Points, and MACD Divergence:
Flip to the weekly turning points chart, and a deeper pattern emerges: Major EUR/USD direction changes consistently cluster around the start of a new year, with minor tops and bottoms often forming near mid-year. Over the last eight years, six out of seven major pivots have landed at those cycle pivots.
Notably, if you look at the weekly chart’s MACD, there’s now a clear bearish divergence—while price clocked new highs into July, the MACD failed to confirm, rolling over and diverging lower. This kind of momentum divergence at a major turning point is classic for trend exhaustion and aligns perfectly with the idea that a correction is not only likely, but perhaps overdue.
This powerful confluence—timing, price structure, and momentum—underscores just how much “cycle” and structure awareness can add to your trading playbook.
What to Watch Next (Trade Planning)
Timing the Correction: If the correction follows historical precedent, expect sideways or choppy price action well into Q4 2025, with the next big directional opportunity around the calendar turn into 2026.
Cycle-Based Strategies: Recognising these cycles lets you prepare for reversals, especially if price is diverging from the MACD at those major timing windows.
Structure > Prediction: The motive phase is where you ride the trend; cycles, structure, and momentum help you avoid exhaustion traps and see when patience is required.

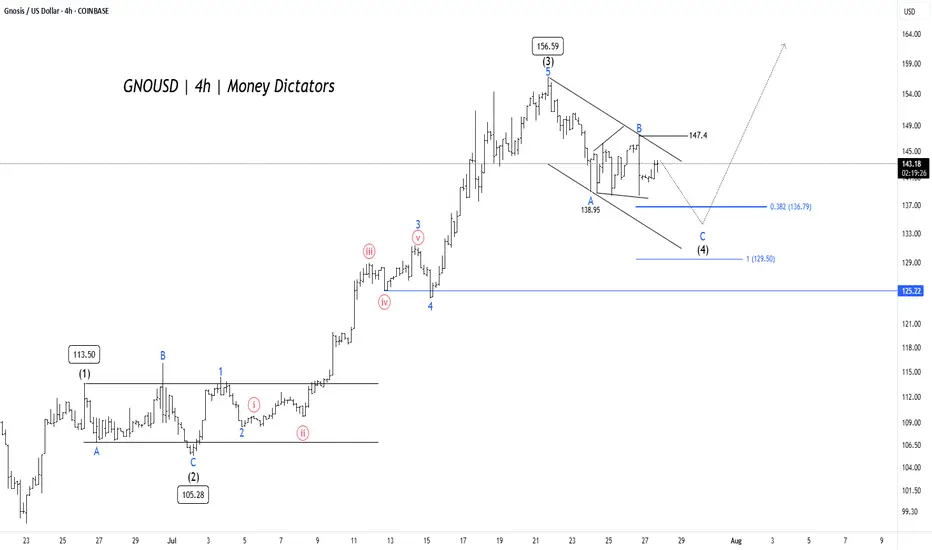
GNO/USD Price Action Aligns for Final Wave 5 PushGNO/USD pair is unfolding a clean Elliott Wave impulse pattern on the 4-hour chart. The rally began with Wave (1) reaching 113.50, followed by a corrective Wave (2) that bottomed near 105.28. This set the stage for a powerful Wave (3) that surged to 156.59, aligning well with Elliott Wave theory where Wave 3 is typically the strongest and steepest leg in the sequence.
Wave (4) is now in progress, taking the form of an A-B-C correction inside a descending channel. Interim support was found at 138.95 during Wave A, and Wave C could extend toward the 0.382 Fibonacci retracement level at 136.79 or the deeper support zone near 129.5. These levels are crucial, as they often mark the end of a corrective phase and the beginning of the next impulse. A confirmed breakout above 147.4 would signal the start of Wave (5) and the return of bullish momentum.
Short-term targets have the potential to reach 135 – 128 , while 125.22 remains the invalidation level for this bullish setup. After the completion of Wave (4), traders can look for long opportunities targeting 147 – 154 – 172 . As long as the structure holds and price respects key supports, the outlook remains favorable for a fresh push higher in Wave (5).
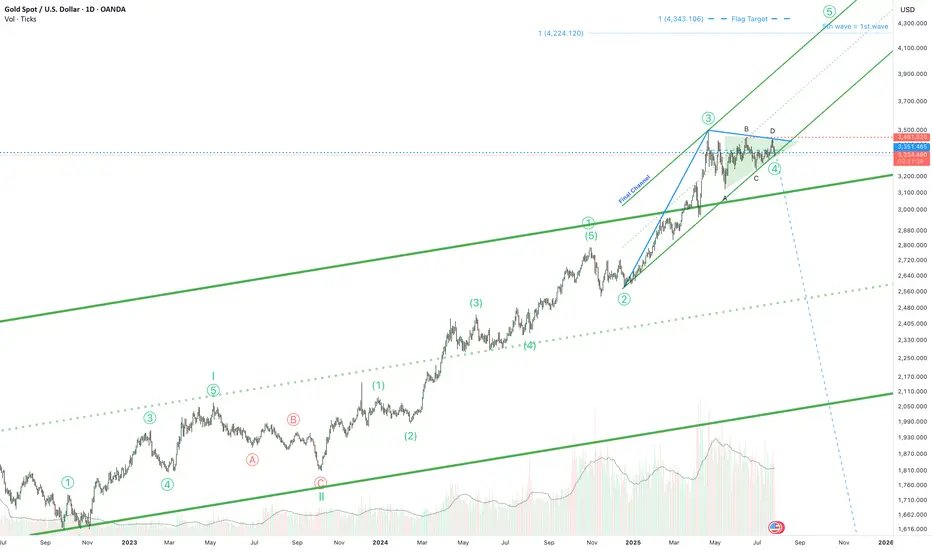
Gold is ready for the 5th wave!Hello! If you're following gold, here's some exciting news. The triangle correction phase that began in April is almost over. It's been a long journey, but we're almost there.
And guess what? The final phase is expected to reach around $4,300. But wait, there's more! The price is holding above the top of a long-term channel. This isn't just a random move; it could be a strong signal that the price could rise even higher than the $4,300 mark.
So, if you're following the gold market, keep your eyes peeled. Big moves could be just around the corner!
SHIBUSDT 4H Potential 10% Drop – Wave 4 Incoming? Hey traders,
On the 4H timeframe, SHIBUSDT seems to be completing Wave III of a classic 5-wave impulse structure. We can clearly identify:
- Wave I and II behind us
- Wave III topped out recently with a strong push upward
- Now expecting a Wave IV correction to unfold
What supports this setup:
- Wave II was an irregular correction (note how Wave B pushed above Wave A).
- According to Elliott Wave alternation rules, if Wave II is complex/irregular, Wave IV is likely to be a simple ZigZag (ABC) correction.
- Zigzags are typically sharp and quick, which fits the momentum of the current market structure.
🕵️♂️ What’s next?
- The potential correction target lies in the marked rectangle zone (around -10% to -13% drop
from the recent top).
- On lower timeframes (like 7min or 10min), we’ll be watching for a support break to confirm
the start of Wave IV.
- If the support is broken with confirmation, that may offer an opportunity to enter a short
position — as long as it fits within the personal risk parameters.
📌 Disclaimer: This is not financial advice. Trading is risky — always manage your risk, do your
own research, confirm your setups, and never blindly follow others. Stay safe and smart.
🧠 Are you planning to catch this correction? Or waiting for the final Wave V? Let me know in the comments 👇

C98USDT – Potential Impulse Wave 3 in Progress? | Elliott WaveHello traders! 🚀
Sharing a fresh Elliott Wave setup I'm currently monitoring on C98USDT (4H TF). The price structure is unfolding clearly and may be in the early phase of a classic 5-wave impulse.
After an impulsive move up completing Wave (1), the market corrected in a textbook ABC pattern down into a key demand zone, finishing Wave (2). We’re now seeing strong bullish momentum suggesting the beginning of Wave (3) – the longest and most aggressive wave in Elliott theory. ⚡
Trade Setup:
🟢 Entry Zone: 0.043 – 0.046
🔴 Stop Loss: 0.03913
🎯 Target Price: 0.05955
💡 Note: Always manage your risk and confirm with your own analysis before entering any trade.
Let me know your thoughts and wave count below! 👇
Happy trading! 🚀

Dollar Major BottomDollar has just finished a major zigzag correction. I was correct, in my last idea, of calling one more leg lower before this major low. Watch for the dollar to PUMP in 5 waves!

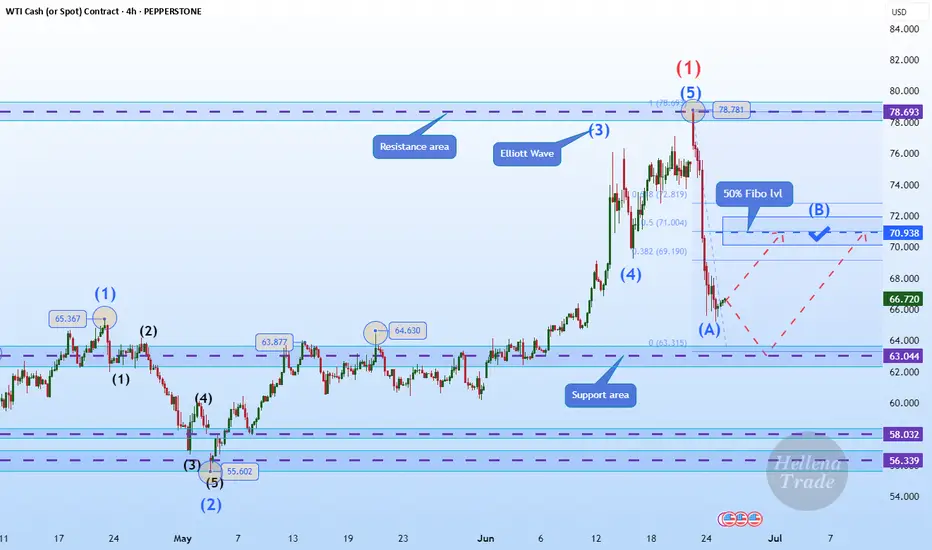
Hellena | Oil (4H): LONG to 50% lvl Fibo area of 70.00.Colleagues, after a long break, I think it is worth returning to oil forecasts. The situation is stabilizing a bit and now I think that the price is in a strong correction (ABC) at the moment I see wave “B”, which may reach the area of 50% Fibonacci 70 level.
It is possible that wave “A” will continue to develop towards the 62-63 area, but I still hope for an upward movement.
Manage your capital correctly and competently! Only enter trades based on reliable patterns!