SILVER: the Top is finally in!!Silver futures once again saw extreme volatility in yesterday’s trading session. In line with our primary scenario, prices reached a new all-time high for blue wave (y) just below the key resistance at $123.08, before facing a significant sell-off. Looking ahead, blue wave (x) is likely to bottom out within the green long target zone, which ranges from $77.19 to $64.67. From that point, we anticipate the start of the final upward phase, represented by green wave . There is also a chance that silver could continue rising directly. In this alternative scenario—green alt. —the $123.08 level acts as a key hurdle that must be cleared (probability: 40%).
Elliottwaveprojection

BTC Cycle Peak Confirmed at $126k – Mapping the Road to $58kThe Macro Picture
The multi-year bull cycle that began in November 2022 has officially reached its terminal point. The blow-off top at $126,198 in October 2025 completed a textbook Primary Wave 5. We are now dealing with a significant macro ABC correction that is likely to dominate 2026 price action.
The Elliott Wave Breakdown
Primary Wave (1): Topped near $75k in early 2024.
Primary Wave (3): The parabolic engine of the run, surging from $50k to above $110k.
Primary Wave (5): Final exhaustion leg that peaked at $126k.
Wave (A) (Current): A sharp 30–40% decline from the ATH, currently testing psychological support in the $75k–$80k range.
What’s Next?
Relief Rally (Wave B): Markets rarely drop in a straight line. Expect a bounce toward the $100,000 – $112,000 zone. This is a prime area for de-risking or entering macro shorts.
Final Capitulation (Wave C): After the Wave B bounce, a final leg down typically targets the previous Wave 4 territory. My ultimate bottom target remains the $58,000 – $71,000 "Golden Pocket".
Invalidation
A sustained weekly close above $116,000 would invalidate this bearish count and suggest that Primary 5 is undergoing a rare extension.
#BTC #Bitcoin #ElliottWave #TradingStrategy #2026Outlook

SOL/USD: ABC Correction Ending at SupportSOL/USD has completed a bullish impulsive move, finishing a full 5-wave structure to the upside. After the top of Wave 5, the market shifted into a corrective phase, forming a clear A-B-C correction. Price has now moved down into Wave C, which is testing a strong support zone between 121–119 (Fibonacci 0.618–0.786 area). This zone is important because corrections often end here. As long as price holds above ~119, the bias turns bullish, and a recovery toward 129–132 (Wave B / retracement area) is expected first, followed by a potential continuation higher. If price breaks and closes below 119 , the bullish recovery idea fails, and SOL could move lower toward the next support near 115 .
Buy zone: 121 – 119 (0.618–0.786 Fibonacci support)
Stop-loss: 118.50 (below Wave C low)
Target 1: 129.30 (0.382 retracement)
Target 2: 132.00 – 135.00 (prior structure resistance)
Stay tuned!
@Money_Dictators
Thank you :)

GOLD: Rally Hits Our Key Target ZoneGold futures gained fresh upward momentum today, climbing to yet another new high. The price is now trading well inside our red Short Target Zone, which ranges from $5,416 to $6,362.
We will take Profits here on ALL Gold longs and maybe even open a short.
We do have a bit of room left inside the target zone, but as soon as the upwards momentum comes to a halt, we anticipate the completion of the larger green wave , which should trigger a significant reversal to the downside. Accordingly, we are preparing for a major decline phase—starting with a break below the support levels at $4,197 and $3,901.
Traders looking to capitalize on this move can consider short entries within our red Target Zone. For risk management, a stop can be placed 1% above the upper edge of the zone.

EUR/JPY: Wave 5 Completed, ABC Correction AheadEUR/JPY has completed a strong bullish impulsive move, finishing a full five-wave Elliott Wave structure to the upside. The recent highs suggest that Wave 5 is likely complete, which often signals the end of a trend phase. After such a move, the market usually shifts into a corrective phase, and the chart shows the start of an A-B-C correction. Price is expected to move lower first into Wave (A), followed by a bounce in Wave (B), and then another decline in Wave (C). As long as price remains below the recent high near 186.9, the bias is short-term bearish, with downside targets around the 179–176 zone. This pullback would be a normal and healthy correction after a long rally, not a trend reversal yet.
Targets
Wave (A) target: 179.5 – 178.0
Wave (C) target (if correction extends): 176.0 area
Stop-Loss
Above recent high: 186.90
Invalidation Level
Daily close above 186.90
Stay tuned!
@Money_Dictators
Thank you :)

EUR/USD Elliott Wave Setup Points to Further UpsideOn the EUR/USD 4-hour chart, the market first completed a normal ABC correction and then started a strong move upward, which shows that the trend has turned bullish. Price respected the key support level around 1.1655 and bounced strongly from it, proving that buyers are in control. The sharp and fast rise looks like a Wave 3, which is usually the strongest part of an uptrend. After this strong move, the market may take a small pullback (Wave 4), but as long as price stays above 1.1655, the bullish structure remains valid. After the pullback, the final push higher (Wave 5) can take price toward the 1.1950–1.2000 area. Overall, the bias remains bullish, and buying on pullbacks is safer than chasing price at the top.
Stay tuned!
@Money_Dictators
Thank you :)

Silver: Finally Topped Out?Silver futures start the trading week with extreme volatility, reaching our now deactivated and therefore greyed-out short target zone (coordinates: $116.91 – $130.31).
If a short position was already initiated within this zone, it may now be appropriate to trail existing stop-loss levels.
At this stage, the primary assumption is that only the high of blue wave (y) has been completed within this area. Under our primary scenario, a more pronounced corrective move is considered imminent. We expect the termination of the corresponding wave (x) within our green long target zone (coordinates: $77.19 – $64.67), where we also anticipate the start of the final upward leg of green wave .
Alternatively, silver may have recently formed the high of wave alt.Y, while the latest counter-move established the local low of alt.X. This would argue in favor of a direct continuation of the bullish advance within green alt. , extending beyond the resistance level at $114.44.

GBP/AUD: Corrective Rally, Downtrend IntactGBP/AUD is trading in a clear bearish Elliott Wave structure on the 4H timeframe. The market has already completed a strong impulsive decline and is currently moving in a Wave 4 corrective pullback, which is happening inside a downward channel and near key Fibonacci retracement levels. This correction looks weak and corrective, suggesting sellers are still in control. As long as price remains below the invalidation level around 2.0050 , the bearish bias stays valid. The expectation is for the correction to finish soon, followed by Wave 5 to the downside, targeting the lower channel area and the 1.96–1.95 zone. Overall, the trend remains bearish, and any short-term bounce is likely a selling opportunity before the next leg lower.
Stay tuned!
@Money_Dictators
Thank you :)

GBP/USD Maintains Bullish Structure for Wave (3)
GBP/USD is showing a bullish Elliott Wave structure, where the market has completed Wave (2) through a corrective A-B-C move and is now preparing for the next impulsive leg higher. Price is holding above the 0.618–0.786 Fibonacci support zone, which is a common area for Wave (2) to finish. As long as this support holds, the bias remains bullish, and the next expected move is the start of Wave (3), which typically brings strong upside momentum. A break below the recent corrective low would invalidate this view, but above support, GBP/USD is likely to move higher toward new highs.
Stay tuned!
@Money_Dictators
Thank you :)

Nexgold Mining Daily Outlook Count 3This is my Elliott Wave count on Nexgold Mining TSXV:NEXG . Price could be making a wave 3 high and could retrace for wave 4. suppose it depends on what Gold does to a degree. The chart so far has reversed at some nice Fibonacci levels along the outlook.
The wave 5 high wouldn't necessarily be end of the bullish sequence, i just don't tend to project too far ahead, lets let these waves play out and go from there.
More comments on the chart.
If you like, show your appreciation!

Coeur Mining (CDE) Elliott Wave Outlook - Count 1 Alt1 (4H)This is an alternate outlook which sees that NYSE:CDE is already in the red wave 3 which again is approaching a typical wave 3 target at the 1.618 extension. I prefer the red wave 2 as a running flat on this outlook compared to the expanding leading diagonal count previously used, and with silver approaching $100, this outlook allows for the completion of this 5 wave sequence quicker than the previously posted 4H outlook.
That last comment suggest I have one eye on a reaction at $100 silver (I suppose I can’t rule it out also Gold approaching $5K), and that I’m preparing for a larger pull back. Well once I anchor red wave 5, yellow (5), and cyan 3 or C this does suggest a larger pullback. I am going to review this count based on my higher timeframe outlook on silver, but looking at CDE in isolation, I think this leg potentially completes a 5 wave sequence higher and the potential for pull back still exists. A pull back that I may not want to hold all of my current holding through, so may trim a little more from CDE and other miners based on correlation as this wave progresses.
The situation is of course fluid, and something could happen tomorrow that changes that sentiment.

GMR Power — Extended Wave-3, Contracting Wave-4… Resolution📉 GMR Power & Urban Infra — Weekly Context and Daily Wave-4 / Wave-5 Structure (Elliott Study)
This publication presents an educational Elliott Wave structure study 📚 using the Weekly timeframe for the overall market context and the Daily timeframe to analyse the ongoing Wave-4 correction , its probable termination area, and the conditional Wave-5 projection .
On the Weekly chart , GMR Power shows a clear impulsive advance from the 2023 base into the ₹169.25 region , labelled as Wave-(3) . Fibonacci extension analysis shows that this move exceeded the 3.618 extension and approached the 4.0 level , confirming that Wave-3 is the extended wave . After this peak, price behaviour shifted from strong trending action to overlapping and corrective movement , signalling the development of Wave-(4) .
On the Daily chart , Wave-(4) is unfolding as a contracting triangle (A–B–C–D–E) 🔺. Each leg is corrective and overlapping, volatility has contracted, and momentum has faded. This behaviour is typical of a Wave-4 triangle following an extended Wave-3 , where the market corrects more through time than price ⏳.
From a structural and Fibonacci perspective 📐, the Wave-E termination zone is identified between approximately ₹85–95 . This region aligns with the 0.618–0.786 retracement band of the prior advance. In Elliott Wave studies, Wave-E of a triangle often resolves quietly and may not show a dramatic breakdown, which matches the current behaviour.
Because Wave-3 is extended , Elliott alternation principles suggest that Wave-5 is more likely to be contracted rather than extended . Therefore, Wave-5 expectations are best framed using triangle thrust measurement and reduced Fibonacci relationships to Wave-1 , rather than equality or extension relative to Wave-3.
Using these methods, the primary Wave-5 reference zone lies in the ₹120–140 region . A move toward the ₹160–170 area would be considered a lower-probability stretch scenario and would require clear impulsive behaviour and momentum expansion. A truncated Wave-5 remains possible but is not the base expectation.
This study focuses on structure, probability, and wave behaviour 🧠 rather than prediction. Discussion of Wave-5 becomes relevant only after the triangle completes and price clearly transitions from corrective overlap to impulsive movement .
This publication is shared strictly for educational and analytical discussion 📚⚠️ and does not constitute investment advice.

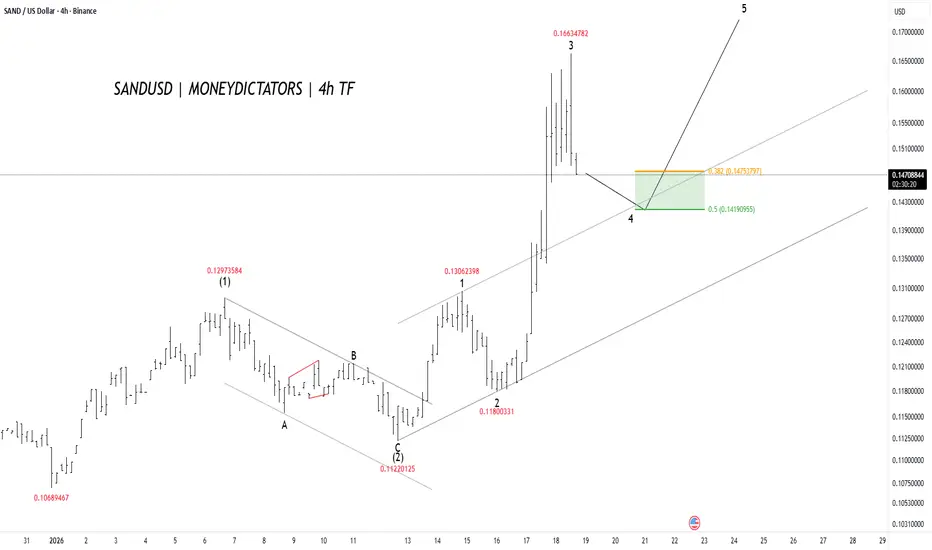
SANDUSD Is Ready for Up MoveSAND is in a strong uptrend on the 4-hour chart. Price has already completed waves 1, 2, and 3, where wave 3 was a sharp and powerful rise. Now the market is doing a small pullback (wave 4), which is normal after a strong move. This pullback is expected to stay in the green support zone around 0.142 – 0.141 (Fibonacci 0.5 area). As long as price holds this zone, the trend stays bullish. After wave 4 finishes, price is expected to move up again into wave 5, targeting higher levels above 0.16. Overall, trend is bullish, and the current dip looks like a buy-the-dip move, not a trend change.
Stay Tuned :)
4H Chart Outlook on MP Materials Corp.Since the last outlook the chart has played out pretty well with green wave 5 tagging $100 and then selling off in wave 2.
In this updated outlook on NYSE:MP i put forward a couple of possibilities, a near term bullish and bearish outlook, both of which are explained further on the chart comments.
i did add to my position on the sell off as a potential running flat pattern was on the cards, but that level didn't hold. now currently watching to see how this pattern develops. have a target of $140 where i will reassess my position.
More comments on the chart.

BTC: Looking for one last leg down toward 78k?The General Outlook It looks like Bitcoin might be in the final stages of this corrective move. Before we see a real reversal, the market likely needs to complete the structure with one more push lower.
There are two main ways this could play out. We might see a direct, sharp drop where support levels break relatively quickly. Alternatively, it could turn into a "diagonal" style move—this would be choppier and slower, with lots of overlapping bounces, but the destination would likely be the same.
The Key Level The bears seem to be in control as long as the price stays below the recent high of $94,800. If we get a sustained break above that level, this immediate bearish setup is probably invalid.
First Target: Watch for a reaction around $85,500.
Second Target: A sweep of the lows near $80,300.
Final Target: The move could potentially finish somewhere in the $76,000 – $78,000 zone.
Just my thoughts on the chart

BABA: Multi-Year Rounding Bottom Breakout — Wave 4 Support CheckThis chart for Alibaba (BABA) showcases a massive multi-year accumulation pattern, specifically a "Rounding Bottom" or "Cup" formation that began in late 2022. From an Elliott Wave perspective, the stock appears to have completed a primary Wave 3 impulse peak near the $190 level in late 2025 and is currently in the late stages of a Wave 4 corrective pullback.
The long-term outlook for BABA remains highly bullish as it successfully transitions from a multi-year basing phase into a structural uptrend. The recent pullback from the October 2025 highs represents a textbook Wave 4 correction, which has found precision support at the 0.382 Fibonacci retracement level ($143.58). This level aligns perfectly with the breakout point of the major rounding base, transforming old resistance into new support.
Key Technical Levels:
* Support Zone: The $143 - $150 area is critical; as long as the pivot at point 4 holds, the impulsive structure remains intact.
* Wave 5 Target 1: A 1.0 Fibonacci extension projects an initial target of $205.42, which would reclaim the 52-week highs.
* Wave 5 Target 2: The primary 1.618 extension sits at $242.59, aligning with major historical supply zones from early 2021.
* Invalidation: A sustained daily close below the Wave 2 low (approx. $70-$80) would invalidate this specific count, though the $143 level is the immediate "line in the sand" for bulls.
Projected Outlook:
The current price action at $150.96 is forming what looks like a bullish consolidation (handle) following the massive cup breakout. With cloud and AI demand accelerating revenue growth into 2026, the fundamental narrative supports a re-rating toward the $200+ consensus analyst targets. Traders should watch for a breakout above the Wave 3 peak to confirm the start of the final fifth-wave leg higher.

ELF - Completion of 5-Wave Impulse Down - Bullish ABC Underway?This daily chart highlights a potential trend reversal following the significant 1-2-3-4-5 impulse decline observed throughout late 2024 and 2025. The completion of this 5-wave sequence at the $49.40 low appears to have set the stage for a major corrective recovery or the start of a new bullish cycle. We are currently tracking an ABC zig-zag structure, with Wave 'b' recently finding support near the $80 level, aligning with the bottom of the descending parallel channel.
Key Technical Levels:
* Wave 'C' Target: The immediate focus is the 1.0 Fibonacci extension at $168.82, which represents an equal-leg move (a=c).
* Long-Term Extensions: If the recovery develops into a larger impulsive move, the 1.618 extensions at $202.67 and $231.52 serve as secondary targets.
* Invalidation: A breakdown below the recent pivot at point 'b' (approx. $75-$80) would delay the bullish outlook and suggest further consolidation within the channel.
Projected Outlook:
The price action is currently reacting to the median line of the descending channel. A sustained breakout above the $100-$110 resistance zone would confirm the Wave 'c' trajectory toward the May 2026 target window. This setup offers a favorable risk/reward ratio for those looking to play the recovery of a quality growth stock that was heavily oversold in 2025.

Gold in Final Bullish Wave – Last Push Higher ExpectedGold (XAU/USD 4H) is in a strong bullish trend and is currently moving in the last part of Wave (5). The clear breakout above the previous resistance shows that buyers are in control, and the bullish structure is still valid. As long as the price stays above the main support area, the outlook remains positive, with the next target around 4,580–4,650 , where this upward move is likely to finish. For short-term trades, a sensible stop-loss can be placed below 4,420 , while the bullish view becomes invalid if the price falls below 4,360 . If everything goes as expected, Gold should make one final move higher and then take a normal corrective pullback (A-B-C) after the strong rally.
Stay tuned!
@Money_Dictators
Thank you :)

ETH(based on NEo wave)still I think a heavy bullish wave is coming.you just need to wait for it.
wave G has different scenarios.
you should see the post pattern confirmation on smaller degree.

ETHUSD - Are Bears Ready for the Fall?ETHUSD on the 4H timeframe is clearly in a corrective downtrend, not a healthy bullish structure. The price action fits an Elliott Wave decline where wave 3 already completed near 2620 , followed by a weak and overlapping recovery that looks like wave 4. That recovery stayed inside a falling channel and never showed impulsive strength, which already tells you buyers are weak. More importantly, wave 4 is flirting with wave 1 territory, which puts the entire bullish hope on thin ice.
Right now, ETH is at a make or break zone. If this move is just a fake breakdown, price must quickly reclaim the channel and hold above recent highs. If not, then this is likely wave 5 of C, and downside continuation becomes the dominant scenario. The structure favors a final flush toward the 2380 to 2350 area, where wave 5 projection and channel support align. Anyone blindly bullish here is ignoring structure. This is not a buy the dip market, it is a wait for confirmation or respect the downtrend market.

XAG/USD Ends Impulsive Rally, Healthy Correction ExpectedThe Silver daily chart shows a strong five-wave impulsive uptrend that has now completed at the recent high marked as wave 5. This confirms that bullish momentum was strong, especially during wave 3 and the final wave 5 extension. After completing a full impulsive cycle, the market usually enters a corrective phase, and the projected A-B-C correction on the chart fits well with Elliott Wave theory. The first pullback (A) is expected to relieve overbought conditions, followed by a temporary bounce (B), and then a deeper correction (C). This correction would be healthy and normal after such a strong rally. Overall, the larger trend remains bullish, but in the short to medium term, Silver is likely to correct before starting the next major upside move.
Stay tuned!
@Money_Dictators
Thank you :)

EUR/USD Holding Key Support – Wave 5 Upside in FocusThe EUR/USD chart shows that a larger corrective phase (A-B-C) has already finished, and the market has entered a new bullish impulsive structure. Price has completed Waves 1, 2, and 3, with Wave 3 showing strong upward momentum, which confirms bullish strength. The current pullback looks like a normal Wave 4 correction, and it is holding inside the 0.5–0.618 Fibonacci support zone, which is a common area where Wave 4 usually ends. As long as price stays above the invalidation level near 1.1655, the bullish Elliott Wave structure remains valid. This suggests EUR/USD is preparing for Wave 5, which could push price to new highs in the coming sessions.
Stay tuned!
@Money_Dictators
Thank you :)

GER40 Holds Key Fibonacci Support – Upside Continuation LikelyThe GER40 chart indicates that a larger A-B-C corrective structure has been completed at the recent low, marked as (C), after which the index began a fresh impulsive upward move. From that bottom, price has formed a clean five-wave advance, confirming the start of a new bullish cycle. The recent pullback appears to be a normal Wave 2 correction, which has respected the 0.5–0.618 Fibonacci support zone, a typical area where corrections end. This suggests the correction is likely complete and the market is preparing for Wave 3, which is usually the strongest and fastest upward wave. As long as price holds above the Wave 2 low, the bullish Elliott Wave structure remains valid. Overall, the setup favors continued upside toward higher highs in the coming sessions.
Stay tuned!
@Money_Dictators
Thank you :)
