ETHUSD: Where Price Could Go?4h tf
ETHUSD has bounced back strongly from around $3,826 after completing an A-B-C wave pattern. Right now, the price is testing resistance near $4,756. It could drop a little to around $4,440 before moving higher again. If the uptrend continues, the next target levels are $4,955, $5,300, and $5,500.
Stay tuned!
Thank you,
@Money_Dictators
Elliottwaveprojection

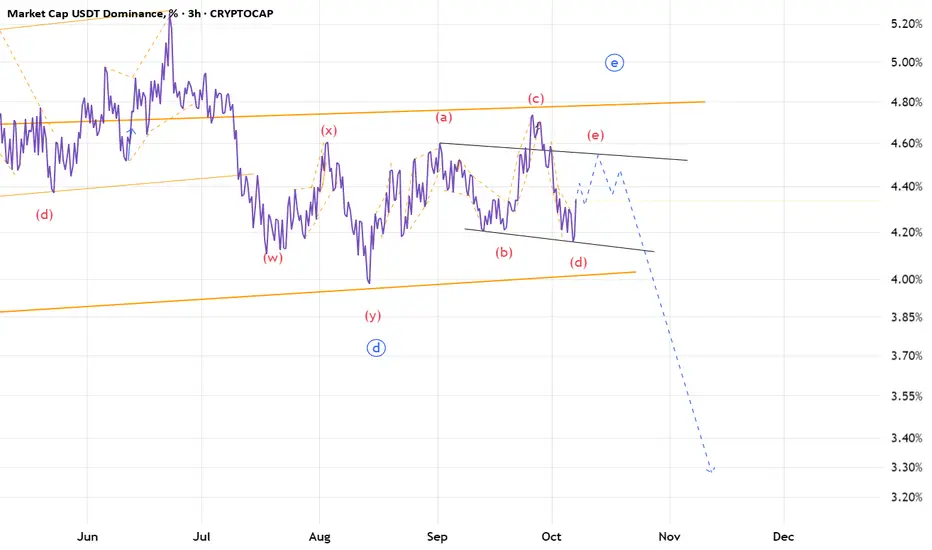
USDT.D(based on NEo wave)the bigger degree is a huge triangle and also wave E is a triangle with abcd waves which all are diametrics.
I hope wave e break the curse and change the pattern.
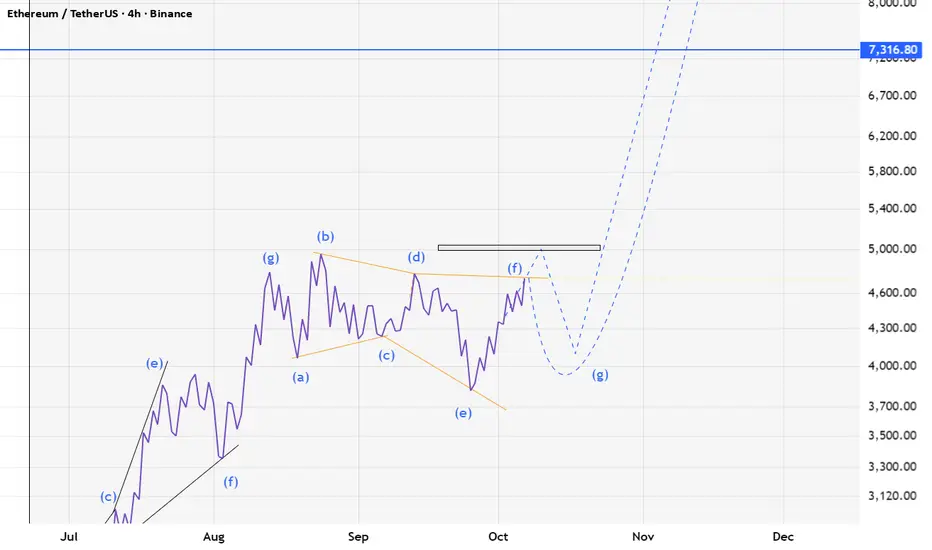
ETH(based on NEo wave)soon eth will start a temporary correction and goes for higher bullish waves.
it is the last chance to buy it.
Stop loss is 3800.
NQ TradesB wave is in. Currently within 1st minutte wave of the intermediate C wave down, of the current 4th wave. Entry of the 382 retracement of the most recent 3rd wave, SL coveres upto 618. Looking for just 161.8% trend based fib of the 1-2 waves. Effectively predicting the terminus of the 3rd wave, we then allow a 4th to occur, then 5 to complete the first wave down of the C wave. Bosch.

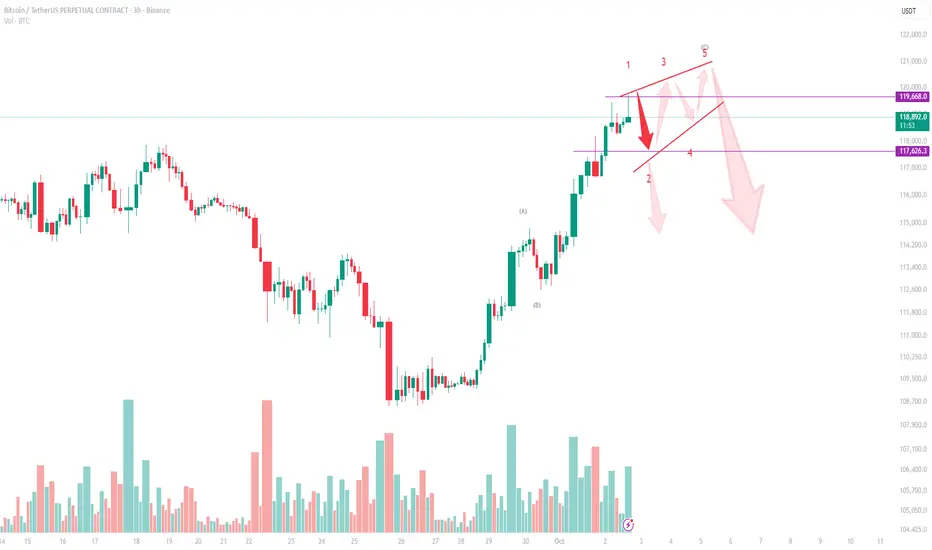
Bitcoin (BTC/USDT) Technical Analysis – 3H ChartWave Structure Outlook
Bitcoin is currently trading near $119,300, where the wave structure suggests a possible Ending Diagonal formation. This leaves us with two bearish scenarios to monitor:
Scenario 1 – Immediate Downside After 1–5 Completion
The 1–5 wave sequence may already be completed.
If so, the market could trigger an immediate downside move, breaking wedge support.
First critical level is $117,600. A clean break below this level would confirm the start of a deeper correction, opening the way toward $115,000 – $113,000.
Scenario 2 – Choppy Ending Diagonal (Light Red Arrows)
Alternatively, BTC may still extend within an Ending Diagonal.
This would mean choppy, back-and-forth price action (small up-and-down moves) before the final breakdown.
In this case, price may retest the $119,800 – $120,000 zone, but the structure remains corrective, and the eventual expectation is still bearish reversal.
Key Levels to Watch
Resistance: $119,800 – $120,000 (upper wedge boundary)
Support: $117,600 (first breakdown level)
Bearish Targets: $115,000 → $113,000
Conclusion
BTC is losing momentum at the end of a 5-wave structure. Whether the market follows Scenario 1 (immediate breakdown) or Scenario 2 (choppy diagonal ending before reversal), the overall outlook is bearish in the short term.
LINKUSDT just entered wave CI was watching and buying into the falling knife at the bottom of wave B looking for my indicator to confirm the bottom with a spike in volume. This is the move I make over and over. I use my indicator and analysis tools to determine the wave count and enter long at the bottom of wave B. This is my classic go to for trading. I bought the dip last night as we dipped under $23 and I am looking for a target of $27

Nifty 50: Genuine Rally or Selloff Setup?The Nifty 50 Index went up, but this upward move was likely just a temporary correction, not the start of a new, long-term rise.
Bottom (Wave W): The index first hit a low around 24,377
Bounce (Wave X): It then went up to a high near 25,448. This rise was a clear, three-part corrective move (like an ABC pattern) that stayed inside a rising channel .
Clue: Because the move from the bottom (W) to the peak (X) was corrective, it suggests the overall trend is still bearish (downward).
Points to look at:
1. Reversal: The index is currently around 24,836 and is starting to turn down from the top of that rising channel. This suggests the temporary rise is over.
2. Projected Drop (Wave Y): The main prediction is a significant drop (Wave Y) that will likely break the previous low of 24,377 .
3. Target: This decline is expected to head toward the lower blue trendline on the chart, completing a larger WXY corrective pattern.
4. Projection: Ending point of wave (Y) can act as the ride for the new impulse cycle.
5. Bearish Stance: Traders should be cautiously bearish (expecting the price to fall).
6. Price action perspective: Previous swing is bearish, better to look at short positions for safe entry.
7. Selling Opportunities: Any small upward movements (retracements) are seen as good selling opportunities (betting on the price going down), as long as the price doesn't break above the recent highs or the channel ceiling.24,300 is indeed a strong demand zone.
Stay tuned!
Money Dictators :)

1H Chart Outlook on MP Materials Corp.On this 1H Chart outlook of NYSE:MP MP Materials, im still looking for the wave v in green to play out. but the outlook puts forward a couple of different paths. The orange zone holds and this marks the completion of wave (ii) in orange and price heads higher in wave (iii). Alternatively price could tag the 'Alternate Outlook Structural Level' at $61.41, before a potential reversal to make the wave V. We will soon find out which path it takes.
Recent position taken is shown on the chart.

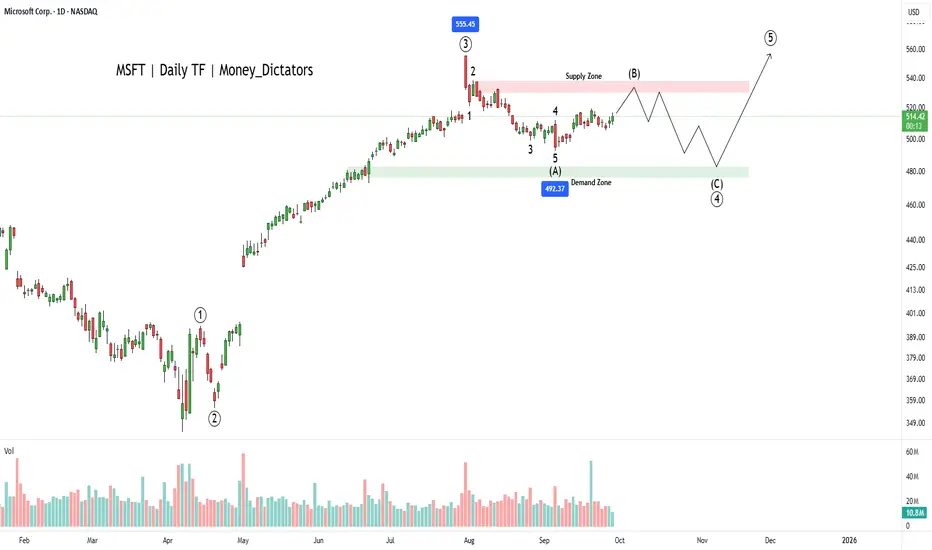
Why MSFT Could Be a Smart Pick in 2025?MSFT has bullish signals from the multiple moving averages, RSI and volume analysis. However, wave principle asks evidence from the buyers. The wave count suggests that the corrective wave (B) is ongoing, and bears will control the final wave of the primary wave 3.
Wave C will start falling nearby the supply zone and high of the 2nd wave of wave intermediate wave A. Wave C can fall up to 476 which will be the strength for wave primary wave 5. As per the chart, breakout above 540 will be a good signal for bulls to take charge back.
Zones:
Supply zone: 538 - 528
Demand zone: 482 - 476
I will update the chart and details shortly.
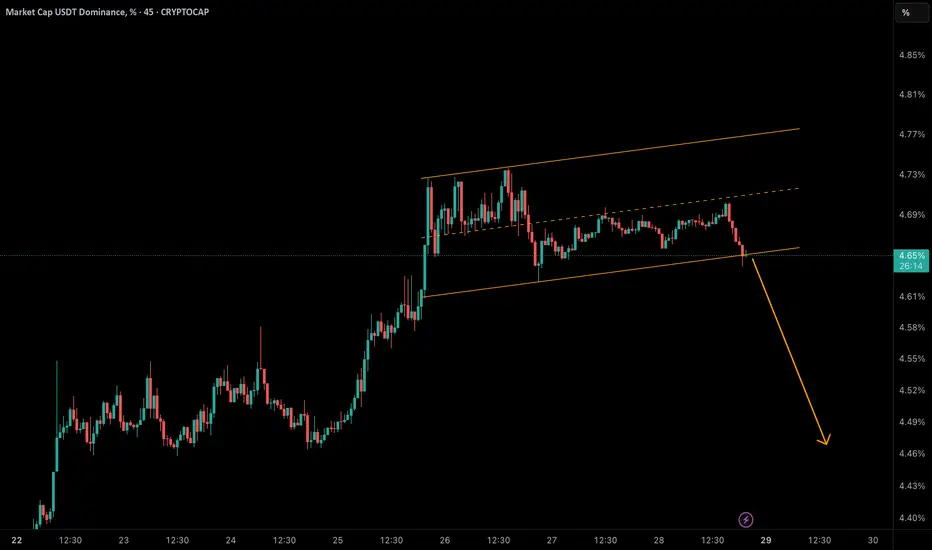
USDT Dominance at a Critical Breakout Point!USDT dominance has touched the bottom of its rising channel near 4.65%.
• 🔻 A breakdown below this support could trigger a correction toward 4.58% → 4.50% → 4.45%.
• 🟢 But if buyers defend this zone and reclaim 4.70%, we may see another push toward 4.75% – 4.77%.
📈 Why it matters: Falling USDT dominance often signals liquidity flowing back into crypto & altcoins, potentially sparking short-term rallies.
LINK — Massive $20 Support Zone, Wave 5 Loading?I haven’t seen this much confluence stack in one place for LINK in a long time. The $20–$19 zone is absolutely packed with technical factors, making it a critical level to hold for bullish continuation.
🧩 Confluence at $20–$19
Golden Pocket: $20.19 (0.618) → $19.59 (0.666)
Yearly VWAP: $18.87
21 Weekly EMA/SMA: $19.68 / $18.39
Yearly Open: $20.02
0.666 Fib Speed Fan: aligned with $20 zone
1.0 Trend-Based Fib Extension: at $20 → completion of wave 4
Pitchfork Buy Zone: 0.702–0.75 levels right at $20
Midpoint of 1-Year Trading Range
Anchored VWAP (from $30.94 high, 287 days): $19.55
Daily Level: $19.66
Weekly Level: $19.28
Monthly Level: $19.27
Yearly Level: $19.51
🟢 Long Setup
We’ve already seen a bounce from $20, confirming demand at this zone.
Plan: Buy now and add on retracements if price dips back toward $20/$19.
Stop-Loss: Below 21 SMA weekly at $18.39
TP1 → $30 psychological resistance & prior key high
TP2 → $34.57 (0.618 Fib retracement)
This setup offers an R:R of 1:7+ with a possible yield of +70% if played toward TP2.
Structure Outlook
With this stacked confluence, it looks like wave 4 has completed and LINK could be ready for its next leg up. The $20 zone is make-or-break, and as long as it holds, the case for bullish continuation remains strong.
Indicators used
DriftLine — Pivot Open Zones → For identifying key yearly/monthly/weekly/daily opens that act as major S/R reference points
Multi Timeframe 8x MA Support Resistance Zones → to identify support and resistance zones such as the Weekly 21 EMA/SMA.
➡️ Available for free. You can find it on my profile under “Scripts” and apply it directly to your charts for extra confluence when planning your trades.
_________________________________
💬 If you found this helpful, drop a like and comment!

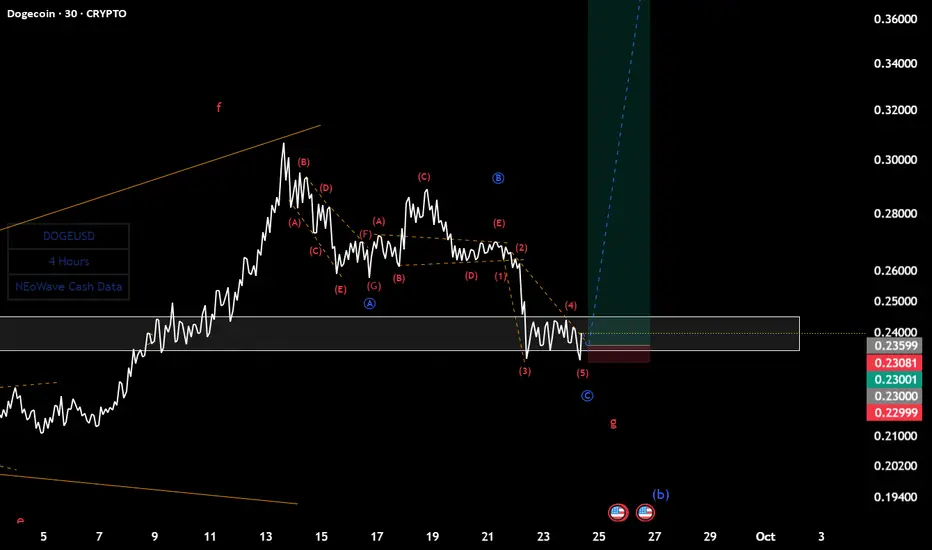
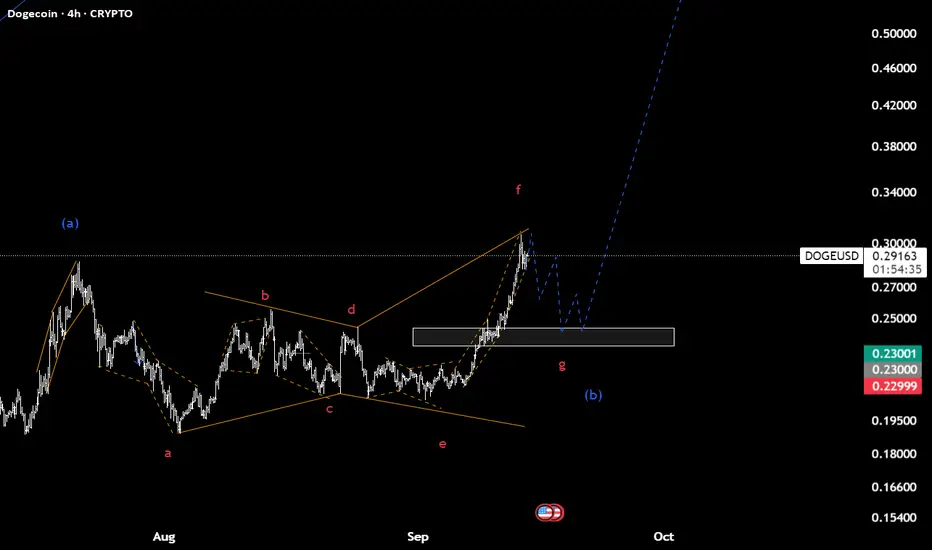
Doge(based on NEowave)wave g of diametric shown as a flat and wave 5 of c is finishing the downtrend.
soon we should see a heavy bullish wave.
I think 0.23 is good for stop loss.
Equinox Gold 4H Chart Outlook Bullish ImpulseHere is my current take on AMEX:EQX Equinox Gold Corp. The 4H chart shows an unfolding bullish impulse. I hold this stock and have added to this position numerous times as shown on the chart. As the outlook suggest we could see a pull back in green wave iv at some point, which could provide another potential point to add to the allocation once it has played out. It's correlation to gold hasn't been very strong recently, but that can always change, I'm of the opinion that gold is overdue a pull back, I have linked one potential outlook on OANDA:XAUUSD , I have some other variations which I will work to post out soon. so keeping a close eye on Gold at these levels. More comments on the chart.

Understanding Elliott Wave Analysis: A Daily Outlook ExampleHello Friends, Welcome to RK_Chaarts!
Today we're going to explore Elliott Wave Analysis using a daily outlook example of Lloyds Enterprises Ltd Chart. Please note that this is for educational purposes only.
Important Disclaimer:
- This analysis is not trading advice.
- I am not a SEBI-registered analyst.
- Please consult your financial advisor before trading or investing.
Understanding Elliott Wave Analysis
In this educational guide, we'll walk through a daily outlook analysis using Elliott Wave theory. Our goal is to identify potential price movements and understand the underlying wave structure.
Current Market Analysis
We are currently analyzing a daily chart, and our analysis suggests:
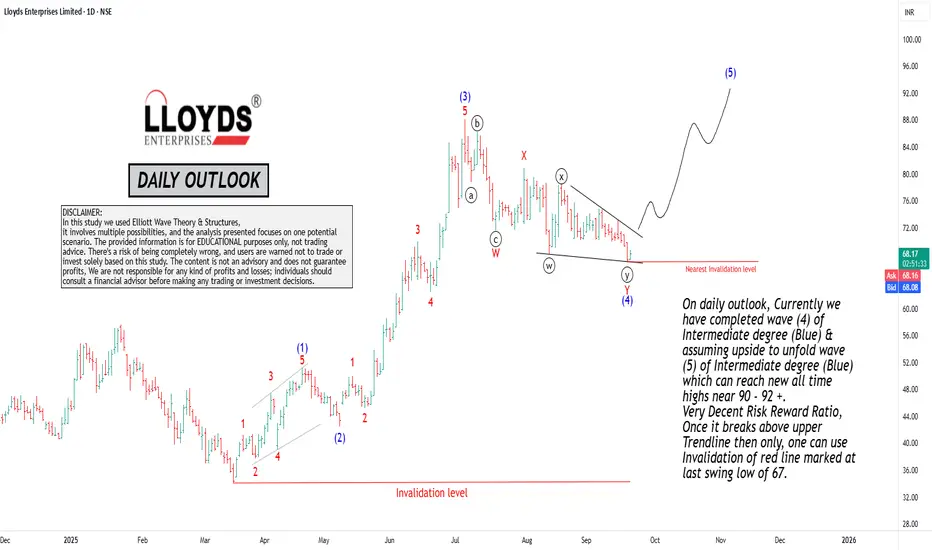
- We have completed wave (4) of Intermediate degree (blue).
- We assume an upside movement will unfold, forming wave (5) of Intermediate degree (blue).
- This wave (5) has the potential to reach new all-time highs near 90-92+.
Risk-Reward Ratio
Our analysis indicates a very decent risk-reward ratio. This means that the potential upside movement is substantial compared to the potential downside risk.
Trade Setup
To validate our trade setup, we are watching for a break above the upper trendline. Once this break occurs, we can consider using the invalidation level marked at the last swing low of 67.
Key Takeaways:
1. Elliott Wave Structure: Understand the current wave structure, including the completed wave (4) and the anticipated wave (5).
2. Potential Price Movement: Recognize the potential for wave (5) to reach new all-time highs.
3. Risk-Reward Ratio: Acknowledge the decent risk-reward ratio, which supports the trade setup.
4. Trade Validation: Wait for a break above the upper trendline to validate the trade setup.
By applying Elliott Wave analysis and understanding the underlying wave structure, traders can make more informed decisions and identify potential trading opportunities.
Remember:
Most investors treat trading as a hobby because they have a full-time job doing something else. However, if you treat trading like a business, it will pay you like a business. If you treat it like a hobby, hobbies don't pay, they cost you!
Hope this post is helpful to the community!
Thanks,
RK
Disclaimer and Risk Warning:
The analysis and discussion provided on in.tradingview.com are intended for educational purposes only and should not be relied upon for trading decisions. RK_Chaarts is not an investment adviser, and the information provided here should not be taken as professional investment advice. Before buying or selling any investments, securities, or precious metals, it is recommended that you conduct your own due diligence. RK_Chaarts does not share in your profits and will not take responsibility for any losses you may incur. So please consult your financial advisor before trading or investing.
Still more to go! Don’t short.. Don’t be afraidWe are still in wave C and we have not ran out of energy yet. According to the volume we are still in wave C and still have another move to push higher. How do I know? I used my custom made indicator that tells me exactly when a wave is actually done. If you want to try it for free send me a message. Full instructions included.

Doge(based on NEo wave)wave (b) is at the end and last chance to buy in low price.
I think a heavy bullish wave is coming and you can see targets on cycle analysis which I reply on that.
New ATH in Short-Term?In this video, I have updated my previous daily chart #elliottwave counts on #BTC, #ETH, and #totalmarketcap, explaining why a new ATH is quite possible in the short-term.

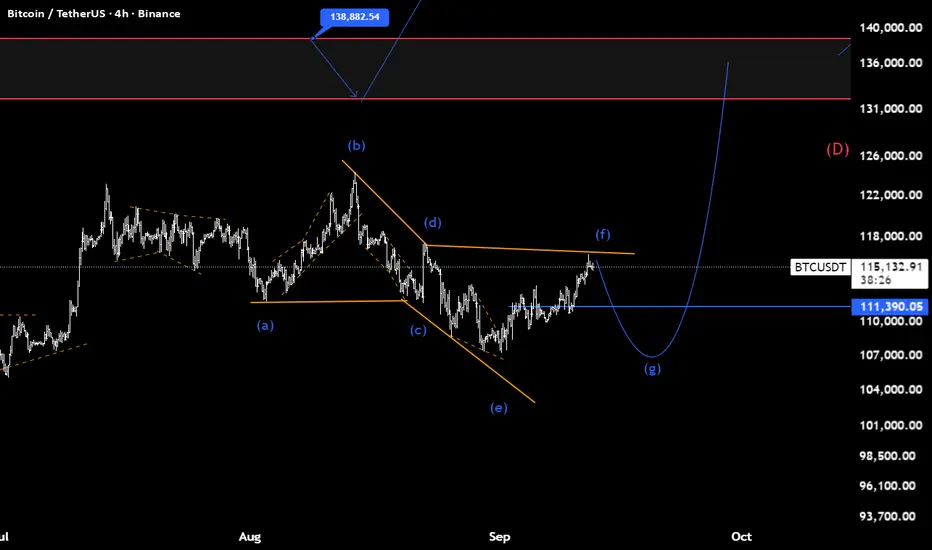
BTC(based on NEo wave)bitcoin is making a bow-tie diametric and finale wave is starting.
pay attention: do not buy bitcoin on this final correction,its a good time to buy altcoins like eth,doge,sol and others.
ASX STOCKS SCAN: ANZ - 10 SEP, 2025 Conclusion: ANZ is moving higher.
Key Points: Wave iii)purple is unfolding and subdividing into wave i,ii,iii,iv-blue, and wave iv-blue may have ended at 32.61. From there, wave v-blue is unfolding higher, possibly targeting the high of 36.24.
Invalidation Point: 32.61

USD/JPY: Downside Pressure MountsUSD/JPY has completed a corrective rally into the wave (2) region, stalling around the 152.00–150.50 supply zone and respecting the descending trendline resistance. This rejection confirms that the broader bearish cycle is intact, and the pair is now entering a wave (3) decline.
From the structure, wave (1) has already unfolded strongly to the downside, and the recent corrective bounce aligns as a double three (W–X–Y) correction, which has likely ended. With this in place, we should see downside continuation, targeting lower levels in a clean five-wave decline.
T1 = 144.289
T2 = 142.288
SL = 150.525
As long as USD/JPY holds below the 150.80–152.00 invalidation zone, the outlook stays bearish. Selling momentum remains strong, and any pullback is likely to create new opportunities for sellers until wave (5) completes.

Daily Outlook on GSVR Guanajuato Silver CompanyThis is my Daily chart outlook for TSXV:GSVR I have added in tranches during the decline looking for the up move which I believe is unfolding now. The chart could unfold in ABC or 12345. Price currently looks like it is ready to breakout of the wave 2 consolidation.

CRYPTO: OTHERS (1W)'OTHERS' is an index that tracks the total market cap of crypto excluding the top 10. This is very helpful in determining the performance of alt coins.
Chart shows that there is a current resistance hanging in around the ATH (486.4B). If it breaks, we can likely see targets of around 798.92B as it is trying to complete wave (3) of the wave 5 encircled count. If price decides to reject the resistance rather than breaking, it is still safe to assume that we are in an uptrend as long as the price doesn't enter the area of wave (1) once it reaches 471.66B.
Summary:
Target of Wave (3) - 471.66B or 798.92B
Invalidation - 177.51B
Feel free to comment your thoughts :)

Mastering the Elliott Wave Pattern🔵 Mastering the Elliott Wave Pattern: Structure, Psychology, and Trading Tips
Difficulty: 🐳🐳🐳🐋🐋 (Intermediate+)
This article is for traders who want to understand the logic behind Elliott Waves — not just memorize patterns. We’ll cover the structure, trader psychology behind each wave, and practical tips for applying it in modern markets.
🔵 INTRODUCTION
The Elliott Wave Theory is one of the oldest and most respected market models. Developed by Ralph Nelson Elliott in the 1930s, it proposes that price doesn’t move randomly — it follows repeating cycles of optimism and pessimism.
At its core, Elliott Wave helps traders see the bigger picture structure of the market. Instead of focusing on one candle or one setup, you learn to read the “story” across multiple waves.
2021 BTC TOP
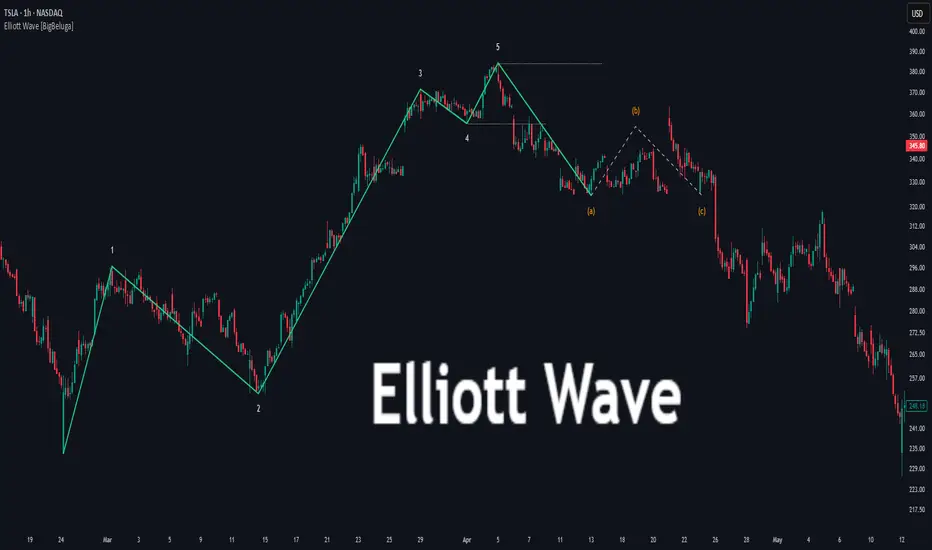
TESLA Stock
🔵 THE BASIC 5-WAVE STRUCTURE
The foundation of Elliott Wave is the Impulse Wave — a 5-wave pattern that moves in the direction of the trend.
Wave 1: The first push, often driven by smart money entering early.
Wave 2: A correction that shakes out weak hands but doesn’t retrace fully.
Wave 3: The strongest and longest wave — fueled by mass participation.
Wave 4: A pause, consolidation, or sideways correction.
Wave 5: The final push — often weaker, driven by late retail traders.
🔵 THE CORRECTIVE 3-WAVE STRUCTURE
After the 5-wave impulse comes a 3-wave correction , labeled A-B-C.
Wave A: First countertrend move — often mistaken as a dip.
Wave B: A false rally — traps late buyers.
Wave C: A stronger decline (or rally in bearish market), often equal to or longer than Wave A.
Together, the impulse (5) and correction (3) form an 8-wave cycle .
🔵 PSYCHOLOGY BEHIND THE WAVES
Each wave reflects trader psychology:
Wave 1: Smart money positions quietly.
Wave 2: Retail doubts the trend — “it’s just a pullback.”
Wave 3: Mass recognition, everyone piles in.
Wave 4: Profit-taking and hesitation.
Wave 5: Final retail FOMO.
A-B-C: Reality check, trend unwinds before cycle resets.
🔵 TRADING WITH ELLIOTT WAVES
1️⃣ Spot the Trend
Identify whether the market is in an impulse (5-wave) or correction (A-B-C).
2️⃣ Use Fibonacci for Validation
Wave 2 usually retraces 50–61.8-78.6% of Wave 1.
Wave 3 often extends 161.8% of Wave 1.
Wave 5 is often equal to Wave 1.
3️⃣ Trade the Highest-Probability Waves
Wave 3 (trend acceleration) and Wave C (correction completion) are often the cleanest opportunities.
4️⃣ Don’t Force It
Not every market move is Elliott Wave. Use it as a framework, not a rulebook.
🔵 COMMON MISTAKES
Over-labeling: Trying to force waves where they don’t exist.
Ignoring timeframes: Waves may look different across scales.
Trading every wave: Not all waves are high-probability setups.
🔵 CONCLUSION
The Elliott Wave Theory isn’t about perfection — it’s about perspective. It helps traders understand market cycles, recognize crowd psychology, and anticipate major turning points.
Use Elliott Wave as a map , not a prediction tool. When combined with confluence — volume, liquidity zones, or trend filters — it becomes a powerful edge.
Do you trade with Elliott Waves? Or do you think they’re too subjective? Share your experience below!