ASX STOCKS SCAN: PLS - 27 AUG, 2025 - BULLISH POTENTIALConclusion: Wave v))green may be moving higher.
Key Points: Wave v))green is extended and subdivides into waves i,ii,iii)purple. Wave iii)purple may now be moving higher, targeting the nearest target at the high of 3.12. While price must remain above 2.07 to maintain this view.
Invalidation Point: 2.07
Elliottwaveprojection

ASX STOCKS SCAN: S32 - 27 AUG, 2025 - BULLISH POTENTIALConclusion: Wave 3-red may be moving higher.
Key Points: Wave 2-red may have ended as a complex corrective wave, and since 2.84 wave 3-red may be unfolding to move higher. Target a high of 3.59 or higher. While price should remain above 2.84 to keep the weight and confidence for the bullish market view.
Invalidation Point: 2.47

ASX STOCKS SCAN: MIN - 27 AUG, 2025 - BULLISH POTENTIALConclusion: Wave 5-red may be moving higher.
Key Points: Wave 5-red may be extending and subdividing into waves i,ii,iii))green. And its wave iii))green may be moving higher, targeting 48.60 or higher. While price should remain above 34.81 to maintain confidence, the weight of this bullish view.
Invalidation Point: 27.45.

APEUSDT – 1D AnalysisHey traders! 👋
Looking at APEUSDT on the daily chart, we can see that the market has completed a clear 5-wave impulse to the downside. After that strong bearish move, the resistance line was broken, which gave us the first signs of a potential reversal.
From there, we formed a smaller 5-wave impulse upwards, which could very well be wave A of an ABC zig-zag correction. Following that, wave B unfolded in what looks like an irregular correction.
👉 Now, I’m watching closely for wave C to unfold, which should take the form of another 5-wave impulse. According to Elliott Wave guidelines, wave C often equals the length of wave A. However, in this case, wave A was already quite extended, so I wouldn’t be overly optimistic with projections. The minimum correction target has already been reached, but structurally we’re still missing wave C – so I expect it to play out, potentially in the form of a rising wedge.
The good news is that the structure will become clearer as it develops, and we can adjust targets dynamically once price action confirms the pattern. For now, I’m eyeing the green zone as a possible target area for wave C.
📊 Potential Trade Levels:
Entry zone: 0.60 – 0.65 USDT
Stop Loss: 0.51 USDT
Target: 0.99 USDT
⚠️ Important reminder: This is not financial advice – just sharing my Elliott Wave perspective and how I’m viewing the structure right now. The market may develop differently, so please manage your own risk and adjust accordingly. Trade safe, friends! 🙌

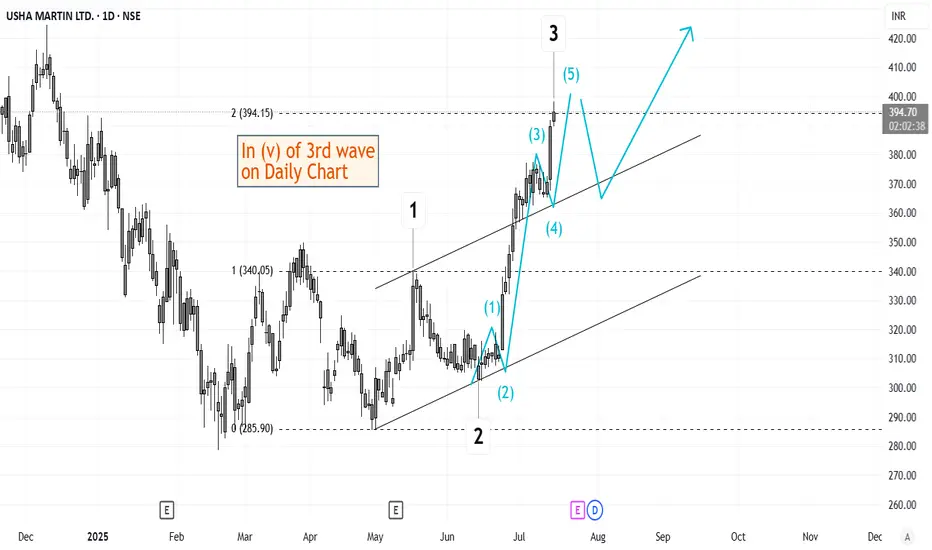
Elliott Wave Analysis of Usha Martin USHAMARTThe script is currently in (v) of 3rd wave on daily time frame. This should be followed by a short retracement and then a 5th wave up. Will keep updating this chart as it progresses.
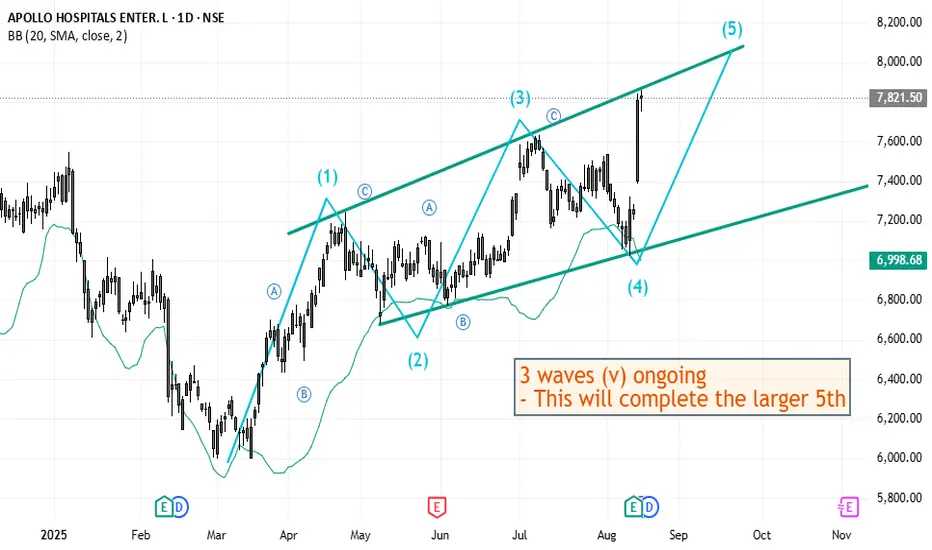
Elliott Wave Analysis of Apollo Hospitals APOLLOHOSPApollo Hospitals has been doing a diagonal and is currently in the (v) wave of the diagonal 5th. After this short term long, it appears to be followed by a bigger retracement.
ASX LIMITED: 15 AUG, 2025 ELLIOTT WAVE ANALYSISConclusion: Bearish pressure is increasing, wave C)-blue is likely pushing lower.
Key Points: Wave C)-blue is moving lower, targeting 48.12. While price must remain below 73.88 to remain bearish.
On the other hand, when price action moves above 73.88, it is directly suggesting that wave 3)-purple is moving much higher at that point.
©By Hua Chi Cuong (Shane), CEWA-M (Certified Elliott Wave Analyst - Master Level).

BTC and Total Market Cap Daily Wave Count UpdatesIn this video, I have updated my Elliott Wave Counts for #btcusd and #totalmarketcap. My previous expectation for bitcoin to see the zone of 108-107 has now been invalidated while my previous projection for the total market cap is in play as of now.
Make sure to watch the previous videos as well as the one on #ethusdt to gain a better understanding of the logic behind the wave counts.

BITCOIN (BTCUSDT): 13 AUG, 2025 - ELLIOTT WAVE ANALYSISConclusion: Wave iii))-green is continuing to move higher.
Key Points: Wave iii))-green is extending, and subdividing into wave i)-purple to wave iv)-purple. I am not sure if wave iv)-purple is finished, but it should not move lower than 115,720 (Invalidation Point: Wave 4 should not overlap wave 1).
On the other hand, 118,050.11 acts as a key level that price needs to hold higher, to gain confidence, weight for this view.
©By Hua Chi Cuong (Shane), CEWA-M | Certified Elliott Wave Analyst - Master Level

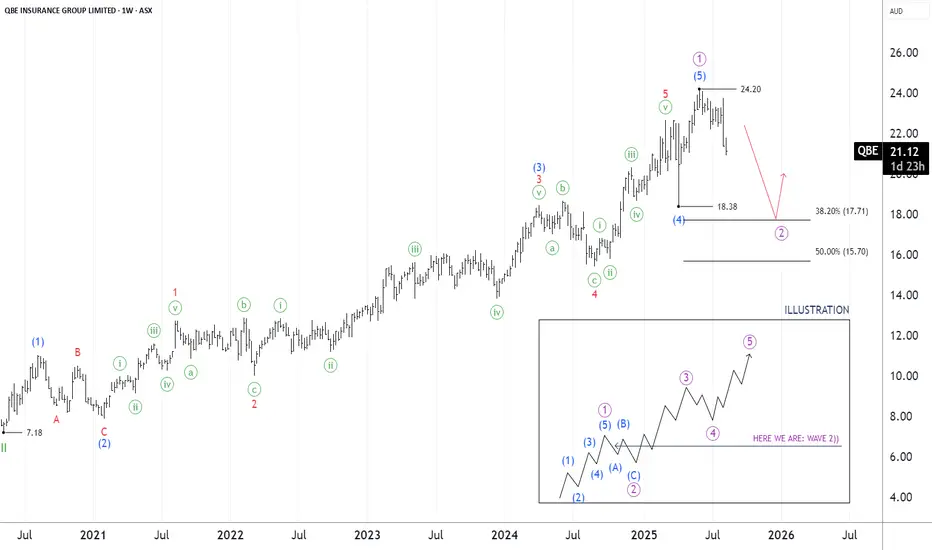
ASX:QBE - 13 AUG, 2025 - ELLIOTT WAVE ANALYSISConclusion: Wave 2))-purple is moving lower.
Key Points: Wave 1))-purple ended at the high of 24.20, wave 2))-purple is unfolding towards 17.38 - 17.50. So there is no convincing evidence of a developing Bullish trend, instead it shows a downward move of the market.
On the other hand, I would only reconsider the bullish market view if the market moves above 24.20 quickly enough, strongly enough.
©By Hua Chi Cuong (Shane), CEWA-M | Certififed Elliott Wave Analyst - Master Level
ASX:REA - 13 AUG, 2025 - ELLIOTT WAVE ANALYSISConclusion: Wave 4)-blue needs more time to complete, then wave 5)-blue can move higher.
Key points: Wave 4))-purple has finished at 62.05 and wave 5))-purple is moving higher. It is subdividing into wave 1)blue to wave 4)blue. Basically wave 4)blue is not completed, because there is not enough convincing evidence, it will probably last longer and develop as a Triangle. After we have more price action, we will know what it is trying to say, for now just wait.
Invalidation point: 180.67 (Wave 4 does not overlap wave 1).
©By Hua Chi Cuong (Shane), CEWA-M | Certififed Elliott Wave Analyst - Master Level

ASX:QAN - 13 AUG, 2025 - ELLIOTT WAVE ANALYSISConclusion: Wave 5)-blue could move higher.
Key Points: Wave 4))-purple ended at 7.55 and wave 5))-purple has been moving higher since then. It is subdividing into wave 1)-blue to wave 5)-blue. Now wave 5)-blue is extended and subdividing into wave 1-red to wave 3-red.
Basically its wave 3-red will move higher, targeting targets around 11.90 - 12.68.
While price must remain above 10.63 to keep this Bullish view valid.

ASX:PLS - 13 AUG, 2025 - ELLIOTT WAVE ANALYSISConclusion: Short-term, wave 2-red is moving lower.
Key points: Wave 2)-blue has ended at 1.070 and wave 3)-blue is moving much higher. It is subdividing into wave 1-red, which has just completed. Wave 2-red is now probably unfolding to push lower, targeting a low around 1.710.
So short-term, this stock is moving lower. Medium-term, it has a lot more to go.
©By Hua Chi Cuong (Shane), CEWA-M | Certififed Elliott Wave Analyst - Master Level

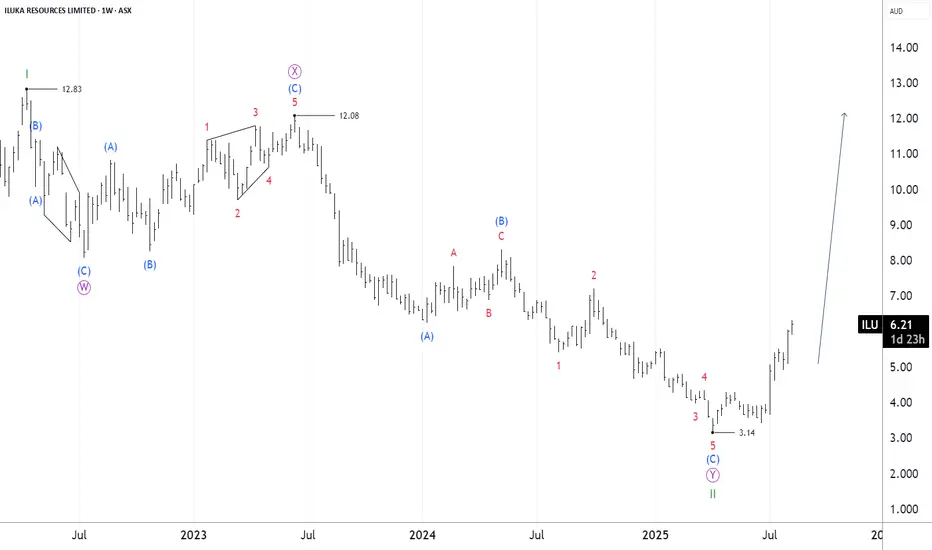
ASX:ILU - 13 AUG, 2025 - ELLIOTT WAVE ANALYSISConclusion: Wave III-green could be moving higher.
Key takeaways: Wave II-green ended as a Double Zigzag at 3.14. Wave III-green then moved higher, targeting the nearest target at 12.83. While price must remain above 3.14 to keep this bullish view valid.
©By Hua Chi Cuong (Shane), CEWA-M | Certififed Elliott Wave Analyst - Master Level
FETUSDT|C&H Setup +100% Breakout MA cluster-A High Quality BreakCup&Handle setup with a high quality breakout the confluent MA cluster—especially the 200-day— as the gatekeeper.
If price hold above the ma200 (and the nearby 20/50) cluster a high-quality breakout and more likely to break the handle and the cup rim.
Here is how I’d weigh it and trade it: DON'T WAIT FOR CUP RIM BREAKOUT
Priority of BUY signal strength indication:
1. Daily close & hold above the ma200 dynamic resistance the most institutions watch - follow BUY
2. Cup handle breakout watch for volume expansion on the break (> 20-day average)
3. Cup rim breakout with a golden cross ma20 reclaim > ma50 curl up is a follow-through BUY
Decision matrix:
- Breaks above key fib level - look for a shallow retest of the breakout line / MA bundle at key fib zone 38.2% - 61.8% liquidity zone for proper trailing stop / limit order.
Target
- TP1 100% fib zone (+50%)
- TP2 extended 161.8% (+100%)
SL slightly below previous low
RR: 3:1
Always trade with affordable risk and respect your stop!

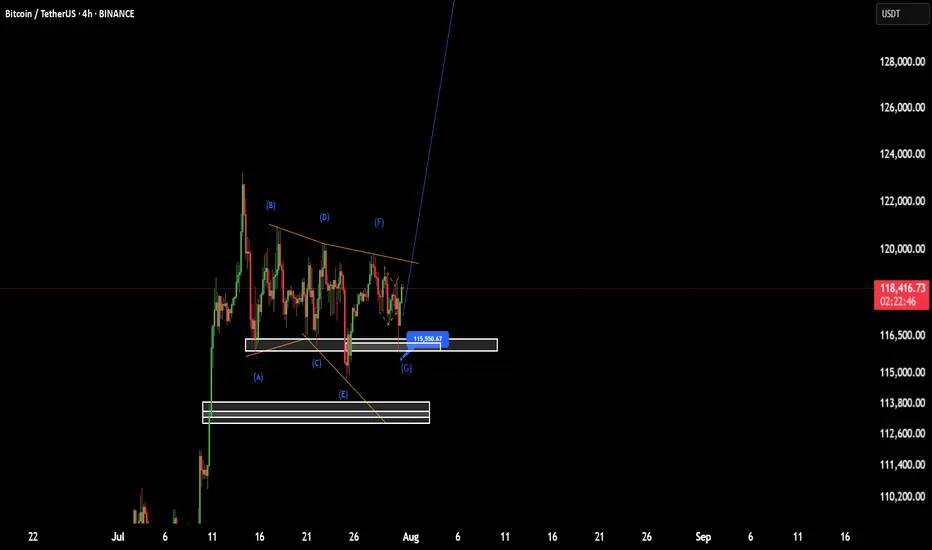
BTC(based on NEo wave)I think wave G is finished and soon it will pump to 138K.
stop loss is 115500.
attention:138K is the first target of these bullish waves.
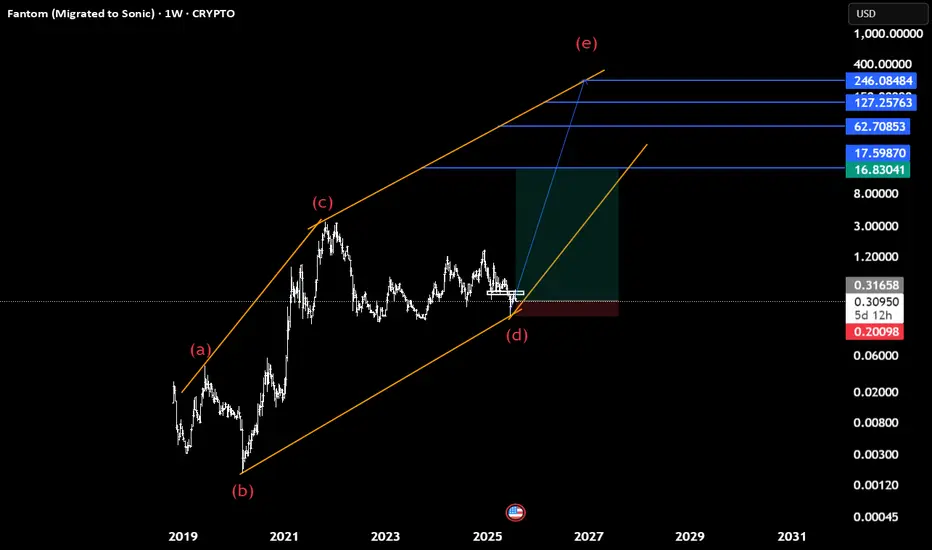
Sonic(based on NEo wave)Soon Sonic will start heavy bullish waves to the targets which shown with blue lines.
95% it is a diamnod diametric and we cant consider this as descending triangle because there is no overlap between wave d and a.
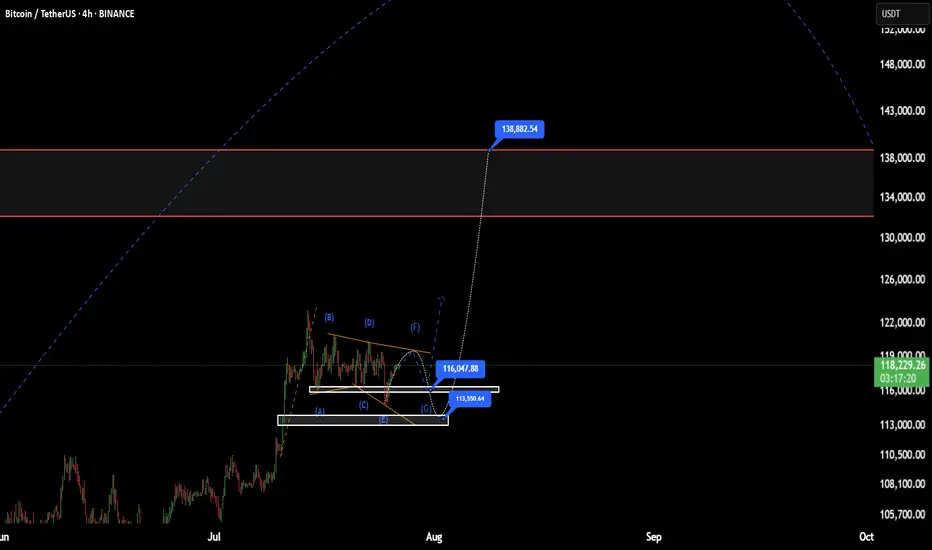
BTC(based on NEo wave)This range price is shown as a bow-tie diametrical.
I think G wave will end at one of those prices, 113 or 116
after this it will start a good bullish wave.
stop loss is 110K and the first target is 138K.
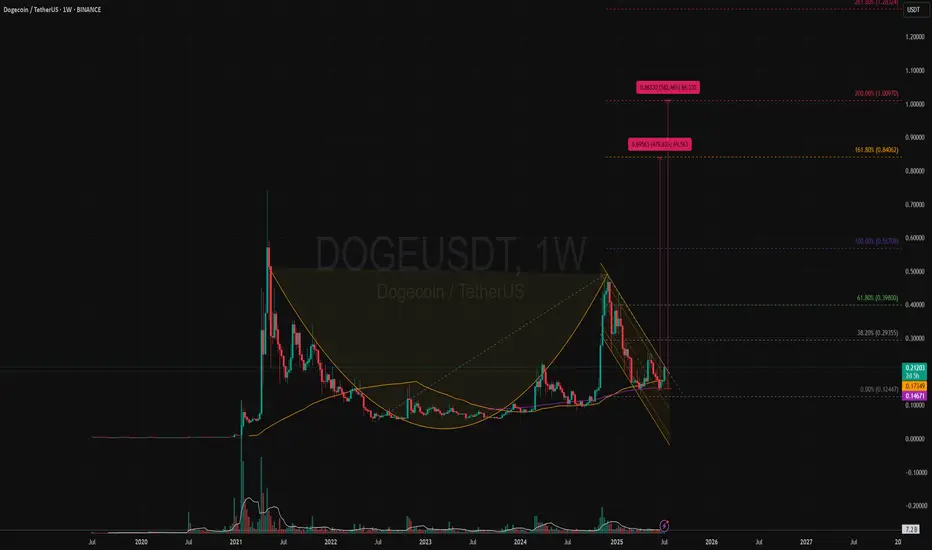
DOGEUSDT | Bullish Cup & Handle Revisiting Target +500% (1 USD)?Price Action and Chart Pattern Analysis:
DOGE cup bottom happened around $0.05 with the rim around $0.48. That gives a depth of roughly $0.42. If the breakout occurs near the rim, the measured move target would be $0.90 zone.
This aligns with several analyst projections suggesting DOGE could reach $0.90 to $1.00 if the breakout confirms.
Another way to project this cup & handle is the fibonacci-based target. These levels suggest that if DOGE breaks above the handle and sustains momentum, $0.85–$1.00 is a realistic zone for profit-taking at 161.8% and 200% extension as 1-2-3 wave pattern.
Reliability of the Cup and Handle Pattern for DOGE
The cup and handle is a classic bullish continuation pattern, but when applied to Dogecoin, its reliability depends on several dynamic factors:
Strengths of the Pattern in DOGE’s Context
Historical Accuracy: DOGE has previously respected technical patterns like rounded bottoms or (THE CUP) and breakout channels (THE HANDLE), especially during alt coin rallies.
Current Setup: a well-formed cup and handle on DOGE’s weekly chart, with price rebounding from $0.14 and testing resistance at $0.2 zone which also the key resistance SMA50W and the downtrend channel (the handle)
WATCH OUT: still a possible throw-under pattern or a final bear trap liquidity below previous low!
Key Action: If breakout confirmed with volume > Follow BUY | if not, wait for retraced SMA20 or breakout support.
Always trade with affordable risk and respect your stop...
EUR/USD – Falling Wedge at Major Fibonacci Zone | Bullish ReversAfter a strong mid-June rally, EUR/USD has pulled back into a key fib cluster, showing early signs of reversal from a classic falling wedge pattern — often a precursor to bullish breakouts.
Technical Breakdown:
📉 Descending Trendline
🔍 Fibonacci Confluence:
Price is reacting from the 0.5-0.618 – 0.705 zone (1.16421-1.15969), aligning perfectly with historical demand and the golden zone of the fib retracement.
Just below sits the 0.79 fib (1.15339), which also marks our invalidity level for this idea — a deep but powerful retracement if tested.
💡 RSI:
While still below 50, it has created a hidden bullish divergence between July 12–17, hinting that momentum is flipping back to bulls.
🧠 Educational Insight:
This setup combines Trendlines, Fibonacci retracement theory, and EMA dynamics to build a multi-layered trade thesis — the type of confluence we look for at Wright Way Investments.
Price doesn’t just reverse because it hits a fib level. But when structure, EMAs, and RSI align — the odds increase significantly.
📈 Trade Setup (Idea-Based, Not Financial Advice):
Long Entry Zone: Current area (1.159–1.161), with confirmation above 1.1626
Invalidation: Clean break & close below 1.15339
Target Zones:
🎯 TP1 – 1.1642 (50 fib & retest zone)
🎯 TP2 – 1.1686 (38.2 fib)
🎯 TP3 – 1.1755 (Weekly Resistance)
📌 Summary:
EUR/USD is forming a textbook reversal setup, supported by fib precision and EMA alignment. Patience is key — but the ingredients are here for a strong bullish continuation.

XAU/USD Elliott Wave Setup : Triangle Ends, Impulse BeginsThe 8-hour XAU/USD chart presents an Elliott Wave structure, currently in the final stages of Wave 4 within a larger impulsive cycle. The complex correction in Wave 4 has unfolded as a WXYXZ (triple-three pattern), forming a contracting triangle (ABCDE) — a classic consolidation phase that typically precedes a sharp impulsive breakout.
Wave E has recently completed near the lower boundary of the triangle, supported by the ascending trendline drawn from the April low. This suggests the correction is mature and Wave 5 is ready to ignite.
Target 1 (T1) : 3434.845
Target 2 (T2) : 3500.535
Stop Loss (SL) : 3309.729
The triangle (Wave 4) breakout structure suggests bullish continuation.
Multiple internal WXY corrective waves have completed, signaling exhaustion.
Volume and candle structure support the possibility of impulsive buying in Wave 5.

USD/JPY – Rising Wedge Meets Major ResistanceChart Overview:
USD/JPY is printing a textbook rising wedge formation, typically a bearish pattern—especially when occurring at the top of a major move.
What makes this setup compelling:
Price is testing the upper wedge resistance near the 148.50–149.00 region, a historically reactive zone.
There’s clear confluence with the 200 SMA, horizontal resistance, and wedge structure—all signaling potential exhaustion.
🔍 Key Technicals:
Resistance Zone: 148.00–149.00 (Highlighted Supply Zone)
Rejection Candle Pattern: Recent upper wick shows rejection and buyer fatigue
Bearish Divergence on RSI (14): Price made higher highs, RSI printed lower highs — a classic warning signal
🧠 Educational Note: Rising Wedge Patterns
A rising wedge is a bearish reversal pattern, especially potent when it forms after an extended rally. The structure narrows as buyers lose steam, leading to a likely breakdown once support is breached.
Pro Tip: Always confirm a wedge breakdown with a close below support + volume spike or bearish engulfing.
🔄 Invalidation:
This idea becomes invalid above 150.467, where the wedge breaks upward and price potentially enters a new bullish phase. Marked clearly as “Idea Invalid” on the chart.
🧠 Final Thoughts:
This chart combines price action, pattern structure, RSI divergence, and SMA confluence — a high-probability scenario favored by elite traders. If you trade based on confirmation rather than prediction, this could be a setup to watch closely.
🗣 Drop your thoughts or questions below!
💬 Let’s learn and grow together.

Dollar Major BottomDollar has just finished a major zigzag correction. I was correct, in my last idea, of calling one more leg lower before this major low. Watch for the dollar to PUMP in 5 waves!
