EUR/USD Elliott Wave Setup Points to Further UpsideOn the EUR/USD 4-hour chart, the market first completed a normal ABC correction and then started a strong move upward, which shows that the trend has turned bullish. Price respected the key support level around 1.1655 and bounced strongly from it, proving that buyers are in control. The sharp and fast rise looks like a Wave 3, which is usually the strongest part of an uptrend. After this strong move, the market may take a small pullback (Wave 4), but as long as price stays above 1.1655, the bullish structure remains valid. After the pullback, the final push higher (Wave 5) can take price toward the 1.1950–1.2000 area. Overall, the bias remains bullish, and buying on pullbacks is safer than chasing price at the top.
Stay tuned!
@Money_Dictators
Thank you :)
Elliottwaveretracement

GBP/AUD: Corrective Rally, Downtrend IntactGBP/AUD is trading in a clear bearish Elliott Wave structure on the 4H timeframe. The market has already completed a strong impulsive decline and is currently moving in a Wave 4 corrective pullback, which is happening inside a downward channel and near key Fibonacci retracement levels. This correction looks weak and corrective, suggesting sellers are still in control. As long as price remains below the invalidation level around 2.0050 , the bearish bias stays valid. The expectation is for the correction to finish soon, followed by Wave 5 to the downside, targeting the lower channel area and the 1.96–1.95 zone. Overall, the trend remains bearish, and any short-term bounce is likely a selling opportunity before the next leg lower.
Stay tuned!
@Money_Dictators
Thank you :)

USD/CHF Approaching Breakdown from RangeUSD/CHF is moving in a sideways corrective pattern, not a strong trend. The price is forming an A-B-C-D-E structure, which usually happens before the market makes a bigger move. Right now, price is in the last part of this pattern (wave E) and is sitting near a resistance area, where it has failed to move higher and has started to turn down. This behavior often means sellers are becoming stronger. As long as the price stays below 0.795–0.798 , the outlook remains bearish, and the market is expected to move lower toward the 0.782–0.775 support area. If this move happens, it would complete the corrective pattern after a short pause, and then the market can decide its next big direction.
Stay tuned!
@Money_Dictators
Thank you :)

USD/CAD: Elliott Wave Bearish BiasUSD/CAD is showing a bearish Elliott Wave structure on the 4H chart. Price appears to have completed a corrective Wave 2 near the 0.5–0.618 Fibonacci retracement zone, which is a common area for corrections to end. From there, the market has started to turn lower, suggesting the beginning of a new impulsive Wave 3 to the downside, which is usually the strongest bearish wave. As long as price stays below the recent swing high near the retracement zone, the bias remains bearish, with downside targets toward the 1.365–1.360 area. A move above the Wave 2 high would invalidate this count and delay the bearish scenario.
Stay tuned!
@Money_Dictators
Thank you :)

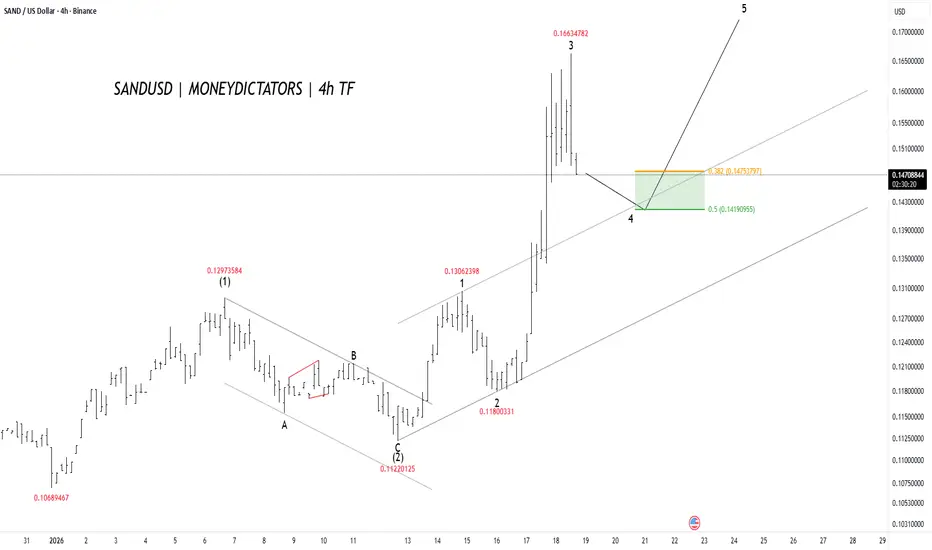
SANDUSD Is Ready for Up MoveSAND is in a strong uptrend on the 4-hour chart. Price has already completed waves 1, 2, and 3, where wave 3 was a sharp and powerful rise. Now the market is doing a small pullback (wave 4), which is normal after a strong move. This pullback is expected to stay in the green support zone around 0.142 – 0.141 (Fibonacci 0.5 area). As long as price holds this zone, the trend stays bullish. After wave 4 finishes, price is expected to move up again into wave 5, targeting higher levels above 0.16. Overall, trend is bullish, and the current dip looks like a buy-the-dip move, not a trend change.
Stay Tuned :)
ETHUSD Bull Trap? - Final Breakdown Setup Is Almost Locked InETH is still stuck inside a clear falling channel, and the entire pattern is behaving like a corrective downtrend. The recent bounce from 2620 looks sharp, but it’s still just a counter-trend move. Nothing here screams trend reversal yet.
Wave 3 ending at 2620 , and now the price is rising for a Wave 4 retracement. Wave 4 usually moves back toward the mid-channel and tests previous breakdown zones.
The red box around 3200–3300 is the key trap zone. This is where sellers can return because Wave 4 must not enter Wave 1 territory, which sits higher. As long as ETH stays under that invalidation level, the bearish structure remains fully intact.
The move looks like a classic (a)-(b)-(c) correction inside Wave 4. Once this corrective bounce completes, the chart suggests ETH will resume the downward path. The channel alignment and wave symmetry both support a final Wave 5 drop.
If the bearish count plays out, ETH could slide toward 2400 – 2300 in Wave 5 before a major bottom forms. That’s the zone where sellers exhaust and buyers take control again. Until ETH breaks the invalidation level with strength, downside remains the more probable outcome.
Stay Tuned!
@Money_Dictators

ETHUSD: Reversal or Another Bull Trap?Look at this:
ETH played the trap perfectly. After pushing into the 3200–3400 resistance zone, price failed to sustain above it and rolled over, confirming that the move was distribution, not strength. Sellers stepped in exactly where a Wave 4 rally should fail.
The rejection was followed by a clean breakdown of the parallel rising channel, which shifts the short-term bias back in favor of the bears. That channel was the last structure holding the corrective bounce together. Once it broke, the bullish case weakened sharply.
This drop reinforces the view that the move up from 2620 was only a Wave 4 correction, not the start of a new trend. With Wave 4 likely complete, ETH appears to be transitioning into Wave 5 of the broader corrective decline.
As long as price remains below the broken channel and prior resistance, downside continuation remains the dominant scenario. The structure opens the door for a retest of 2620 , with a deeper extension toward 2465 if selling pressure accelerates.
Until ETH reclaims the channel with strength and acceptance, this remains a sell-the-bounce environment. The warning came at the trap zone, and the market is now following through.
Stay Tuned!
Money Dictators,
R.D :)

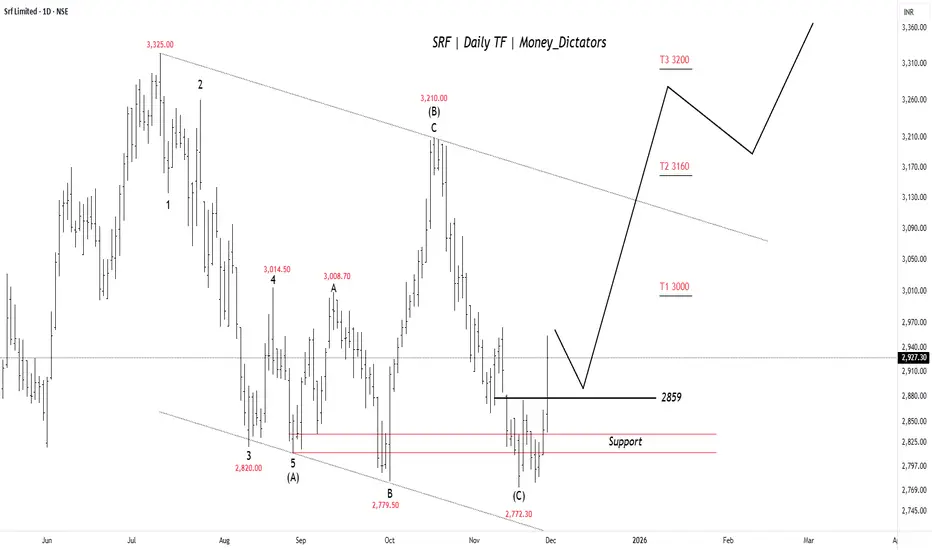
SRF on the Edge of a Sharp BreakoutSRF seems to have finished its ABC correction near the 2770–2800 support zone, and the price has bounced back above 2859 , which now acts as a short-term trigger. If the stock stays above this level, it can move toward 3000 first, then 3160 , and possibly 3200 . The chart shows buyers gradually taking control again after the correction, but the outlook stays positive only as long as price holds above the support region.
Stay Tuned!
@Money_Dictators
BTCUSD - Wave 5 Decline Still Likely AheadPrevious Analysis:
BTC is approaching a critical reaction zone where the current rise looks more like a corrective push than the start of a new trend. Price is moving toward the highlighted supply region, which aligns with a potential wave 4 completion inside the descending channel. The structure from the recent low shows an internal a–b–c formation, suggesting this bounce could run into exhaustion as it enters the red zone. Unless BTC breaks out of the channel with conviction, the broader momentum still leans bearish. A rejection from this region would likely trigger the final wave 5 leg, driving price toward deeper Fibonacci levels and completing the corrective cycle before any meaningful recovery attempt can begin.
Stay Tuned!
@Money_Dictators

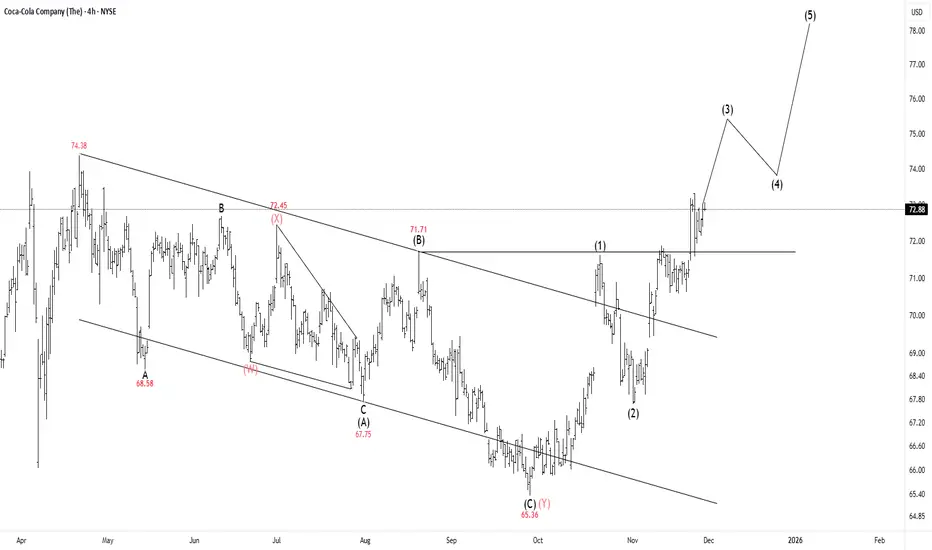
Coca Cola - $78 Target for New Highs Imminent 🥤The Coca-Cola Company (KO) suggests the stock has definitively finished a long period of price correction and is now ready for a significant upward trend. This pullback, which had been complex, officially concluded when the price hit its low at $65.36. Critically, the strong bounce that followed has broken the stock out of its long-term downward trading range, confirming that the selling phase is fully over.
Following this successful breakout, the chart indicates that a major new five-wave rally is starting, with the stock currently engaging the powerful middle part of this upswing (Wave 3). The analysis projects that after completing this rally, the price will ultimately reach a target around $78.00. This suggests that the stock is now in a strong phase of growth, making it a key focus for traders looking for the next major increase in value.
Stay Tuned!
@Money_Dictators
BTC(based on NEo wave)everything is ok with flat.
time of wave B is more than wave A and wave C is making a beautiful impulse wave.
bitcoin price under 74500$ is a bear trap!

XAU USD - correction playing out of ABC
I'm referring to the Daily price chart and key counts are in line with Wave counting and supply and demand curve trading levels based on fair value gap intervals of weekly trading sessions plotted to a daily chart at intervals of 60.
Current wave - 3 of 5 in the Elliott wave count.
Experiencing ABC corrective structure.
Corrective structure B has formed now nicely at $4,232. XX and rejected nicely, with a newly supply formed - based on A point of structure holding at at $4,372 - $4,217 zone within the inside candle.
Price has nicely breached the wick and sold off accordingly.
Now what happens?
two things -
1. Price will fall to $4000.00 and use this psychological zone and the previous order block to create and nice order block and move up - retaining the Demand control.
2. This looks to be a setup of a technical alignment of a drop, base, drop where price channel or corrective wave from Point B - to point C is forming.
The gap between on the daily structure left shows between $3,850 - 3,720 est is the real zone of interest where the Demand driver will derive from.
Master Key for zones
Black = Three Month
Blue = Monthly
Purple = weekly
Pink = Consolidative box example (Daily)
Orange = Daily
White = Wave
Red = Lines - Fibonacci, wave alignment.
Risk Warning
Trading leveraged products such as Forex, commodities and CFDs, carries with it a high level of risk and so may not be suitable for every investor. Prior to trading the foreign exchange, commodity or CFD market, consider your investment objectives, level of experience and risk appetite. You should never risk more than you can afford to lose. If you fail to understand or are uncertain of the risks involved, please seek independent advice and remember to conduct due diligence as criteria varies to suit the individual.
Below are some of the take aways from the video - please listen again incase any detail is missed.
Do you enjoy the setups?
Professional analyst with 8+ years experience in the capital markets
Focus on technical output not fundamentals
Focus on investing for long term positional moves
Provide updates where necessary - with new updated ideas tracking the progress.
If you like the idea, please leave a like or comment.
To all the followers, thank you for your continued support.
Thanks,
LVPA MMXXIV

NAS100 Forecast: A Fresh Bullish Impulse Toward New HighsThe NAS100 index is currently moving within a classic Elliott Wave structure. After completing wave (3), the market entered a correction phase that formed wave (4). This correction appears to have ended in the highlighted support zone, where buyers stepped in strongly. The five-wave pattern before wave (4) confirms a solid bullish trend. Now, the index seems to be preparing for the final upward move wave (5). This wave often represents the last push of a rally before a larger correction starts. As long as the price stays above the recent support near 24,400 , the next targets could be seen around 25,200–25,600 . In simple terms, the market is expected to continue its uptrend after a short pullback, following the typical Elliott Wave sequence of five upward waves and three corrective ones.

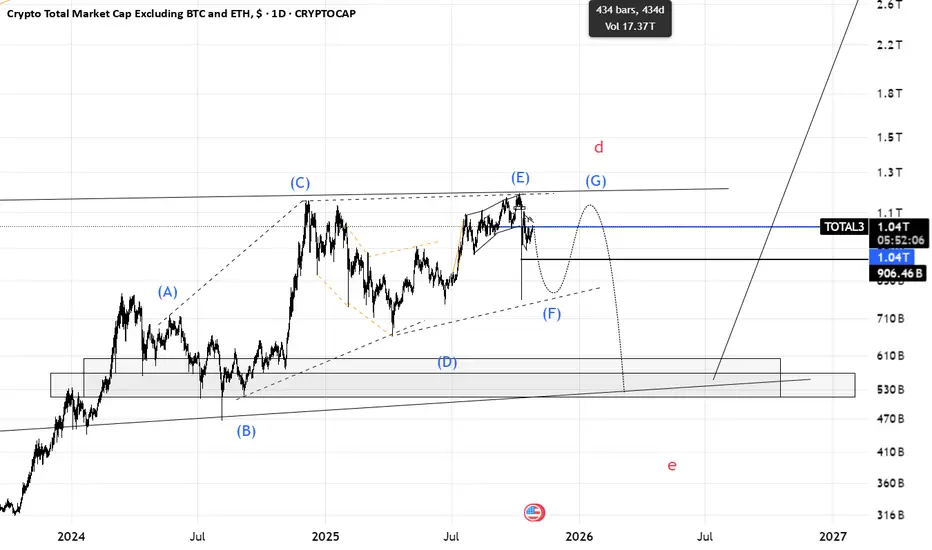
Total3(based on NEo wave)I think this branch is diametric. in last chart I thought its a triangle but its a diametric.
we should for wave F to finish and wave G to start then there is a heavy bearish wave for total3 and altcoins.
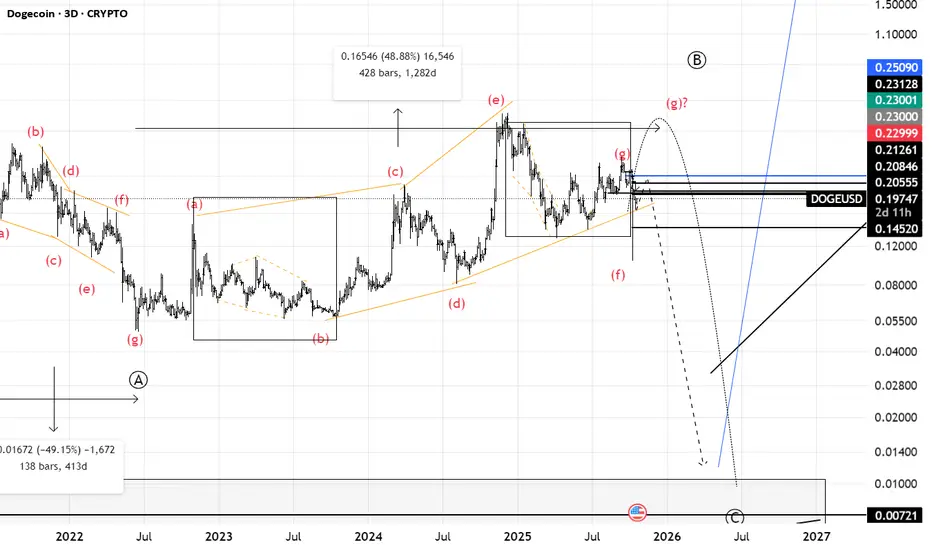
Doge(based on NEo wave)I think Its gonna be a flat and some how we will see a very strong bearish wave to 0.01$!
I dont see any bullish waves for long terms.
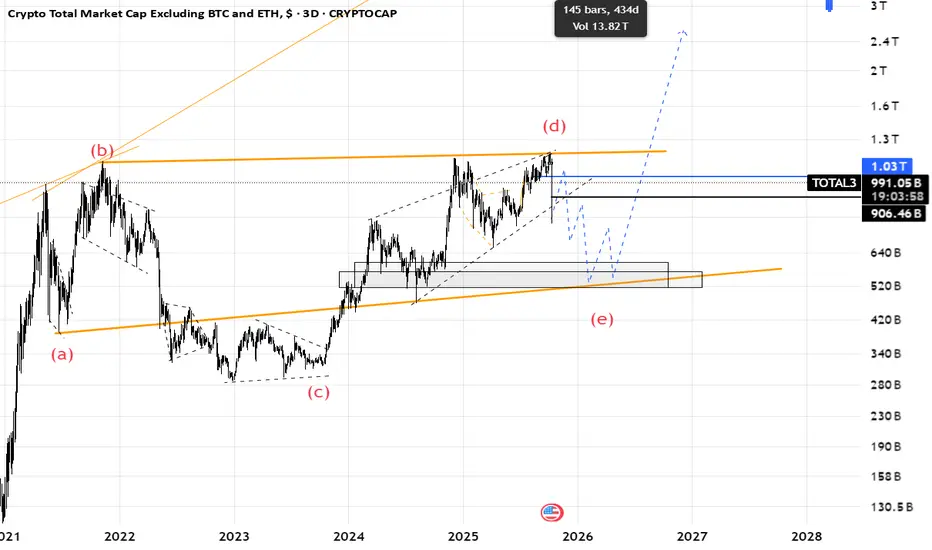
Total3(based on NEo wave)I thought wave (e) is finised but I was wrong.
now I think its the start of wave (e) and we should afraid of altcoins.
when wave (e) is finished altcoins will start to pump.
every upward is a chance to sell.
there is another scenario that I will share it on next post.
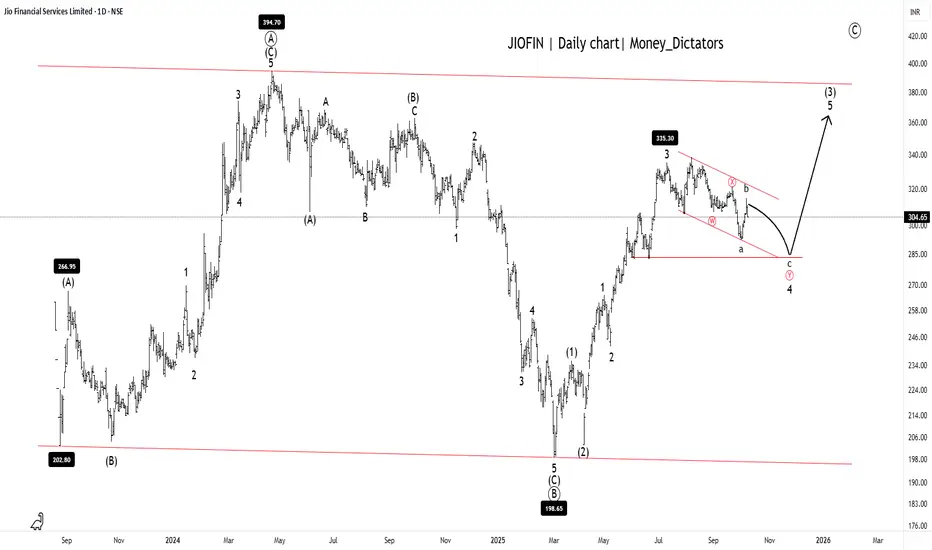
JIOFIN Setting Up for the Next Big Breakout!JIOFIN Daily chart
Possible short-term dip toward 285 - 290.
Long-term Levels: 335, 368, and 342.
Overall Trend: Bullish
Short-term trend: Bearish
JIOFIN is ready for the final upsurge as the correction ends at wave (C). A major A-B-C correction of the primary degree is clearly visible on the daily timeframe chart. Upon closer examination, it appears that the JIOFIN is currently in wave (Y) of wave 4. After completion of the wave 4 structure, Stock will set for the wave 4 for the given long-term levels.
Stay tuned!
@Money_Dictators
Thanks :)
NQ TradesB wave is in. Currently within 1st minutte wave of the intermediate C wave down, of the current 4th wave. Entry of the 382 retracement of the most recent 3rd wave, SL coveres upto 618. Looking for just 161.8% trend based fib of the 1-2 waves. Effectively predicting the terminus of the 3rd wave, we then allow a 4th to occur, then 5 to complete the first wave down of the C wave. Bosch.

Nifty 50: Genuine Rally or Selloff Setup?The Nifty 50 Index went up, but this upward move was likely just a temporary correction, not the start of a new, long-term rise.
Bottom (Wave W): The index first hit a low around 24,377
Bounce (Wave X): It then went up to a high near 25,448. This rise was a clear, three-part corrective move (like an ABC pattern) that stayed inside a rising channel .
Clue: Because the move from the bottom (W) to the peak (X) was corrective, it suggests the overall trend is still bearish (downward).
Points to look at:
1. Reversal: The index is currently around 24,836 and is starting to turn down from the top of that rising channel. This suggests the temporary rise is over.
2. Projected Drop (Wave Y): The main prediction is a significant drop (Wave Y) that will likely break the previous low of 24,377 .
3. Target: This decline is expected to head toward the lower blue trendline on the chart, completing a larger WXY corrective pattern.
4. Projection: Ending point of wave (Y) can act as the ride for the new impulse cycle.
5. Bearish Stance: Traders should be cautiously bearish (expecting the price to fall).
6. Price action perspective: Previous swing is bearish, better to look at short positions for safe entry.
7. Selling Opportunities: Any small upward movements (retracements) are seen as good selling opportunities (betting on the price going down), as long as the price doesn't break above the recent highs or the channel ceiling.24,300 is indeed a strong demand zone.
Stay tuned!
Money Dictators :)

RKLB: Elliott Wave Analysis. TARGET $71
RKLB is in its final move up to complete its fifth wave in wave three.
If W1=W5 target is 71.
After this move a deep retracement likely a complex Wave 4 should unfold before we see continuation to the upside.

Elliot Wave📚 Elliott Wave Trading Strategy — Education Framework
1. Origins & Philosophy
Ralph Nelson Elliott (1920s–1930s): Found that markets, while seeming chaotic, often move in repeating wave structures.
Core Belief: Market psychology cycles between optimism and pessimism in a fractal pattern.
Purpose: Provides a roadmap of where the market could be within a cycle (not a certainty).
2. The Two Types of Waves
Impulse (Motive) Waves (1–5):
Move in the direction of the main trend.
Rules:
Wave 2 never retraces >100% of Wave 1.
Wave 3 is never the shortest.
Wave 4 doesn’t overlap Wave 1.
Net result = trend continuation.
Corrective Waves (A–B–C):
Move against the main trend.
Three-wave structure: down (A), up (B), down (C) in a bull market.
Typically retraces a Fibonacci % of the prior impulse.
3. Key Components
Fractals: Small waves make up bigger ones, across timeframes.
Degrees of Waves: From Grand Supercycle (multi-century) to Subminuette (intraday).
Fibonacci Ratios: Common retracement levels (38.2%, 50%, 61.8%) and extensions (161.8%) guide targets.
4. Practical Trading Strategy
Elliott Wave by itself is subjective. The edge comes when combined with confirming indicators.
Example Workflow for Swing Trading
Identify Trend Direction:
Use 50-day/200-day MA, Ichimoku, or ADX.
Wave Counting:
Label impulse waves 1–5.
Wait for a corrective wave A–B–C.
Entry:
Many Enter end of Wave 2 or Wave 4 (buy dips in uptrend). Try entering a wave earlier, so that you lock in better Risk to Reward.
Use momentum oscillators (RSI/Stochastics) to confirm end of correction.
Exit/Profit Target:
Project Wave 3 or 5 using Fibonacci extensions (often 161.8% of Wave 1).
Stop Loss:
Below Wave 1 start (if long).
Above Wave 1 start (if short in a bear sequence).
5. Who Uses Elliott Wave?
Day Traders / Swing Traders: To catch impulse waves.
Long-term Investors: To avoid topping markets (useful in bubbles).
Cross-Market Traders: Applies in stocks, forex, commodities, crypto.
6. Advantages
✅ Provides forward-looking framework (not just lagging).
✅ Works across asset classes and timeframes.
✅ Helps identify where we are in a market cycle.
✅ Blends well with Fibonacci, RSI, and trend filters.
7. Disadvantages
❌ Highly subjective (two traders may count waves differently).
❌ No guarantee — probabilities, not certainties.
❌ Developed in the 1930s, critics argue it hasn’t adapted well to algorithmic/modern markets.
8. Famous Elliott Wave Calls
Dow 2002–03 Crash: Prechter predicted drop from 11,000 → 7,000.
Gold 2011 Peak: Predicted ~$1,900 top.
Bitcoin 2017: Analysts called $20K top → $3K.
9. Common Mistakes
Forcing wave counts (bias confirmation).
Ignoring other indicators.
Trading every wave → instead, focus on the big impulses.
No patience (wave structures can take weeks or months).
✅ Summary Strategy (Simple Version)
Use MAs or trendlines → determine main trend.
Count impulse waves → focus on Wave 3 and Wave 5 (strongest).
Wait for corrective pullback (Wave 2 or 4).
Enter with oscillator confirmation + Fibonacci retracement.
Exit at Fibonacci extension or trend exhaustion.

EUR/USD – Elliott Wave + FVG Orderblock | Key Short Setup Ahead🔎 Analysis Breakdown:
1. Wave Structure: Market is completing the corrective ABCDE pattern, with wave D testing the upper supply area.
2. Supply Zone: The highlighted zone shows active sellers, increasing probability of rejection.
3. Liquidity & FVG Orderblock: Below, we have a fair value gap (FVG) and orderblock acting as a magnet for price.
4. Scenario: If price rejects the D leg zone, bearish momentum could accelerate towards the FVG orderblock area (1.1580 – 1.1560).
⚠️ Invalidation:
Any clean break and sustained close above the D-leg supply zone would invalidate this short setup.
---
Conclusion:
EUR/USD is at a critical juncture. Sellers are active, and rejection here could open the door for a deeper drop into the FVG orderblock zone. Keep risk tight and watch for confirmations before entry.
💬 What’s your take — are you bearish from here, or do you expect a breakout? Comment below 👇
---
#EURUSD #ElliottWave #Forex #SmartMoney #Liquidity #FVG #Orderblock #Trading

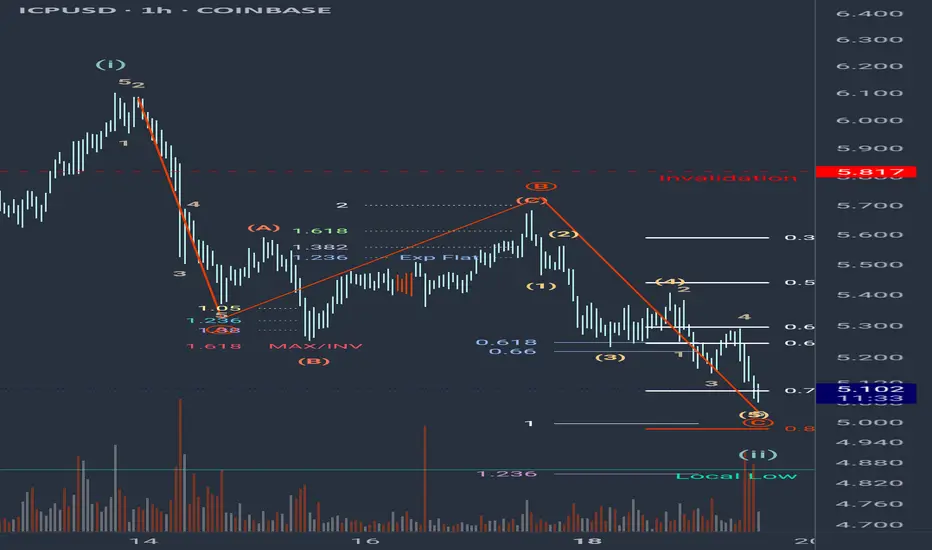
ICP Wave 2 correction! Simple ABC zigzag...is the move done thouSince the 14th of August the crypto markets have been in a corrective phase, a much needed retracement if you ask me. There were plenty of bullish moves before the 14th on loads of alts (Arbitrum) to keep us busy but we need the reset so we can continue with confidence that the bottom will not fall out from under us. Displayed is a wave 2 retracement of wave 1, which is the second 1,2 pattern (Extremely Bullish) in the move up. Likely we will see this fractal play out on a smaller degree, following in past fractals footsteps. Triple 1,2 is the move i believe is the most probable at this point (Expanding Diagonal is super rare) Happy Trading 🌊