BTCUSDT – ABC Correction Hey traders 👋
Bitcoin might be setting up for a strong move downwards after completing what appears to be a 5-wave impulse structure on the higher timeframe.
There’s also a clear RSI bearish divergence, suggesting that bullish momentum is fading and a correction could be near.
I’m currently expecting a medium-term ABC corrective phase, though it’s still uncertain whether it will develop as a classic zig-zag or a flat/flag-type correction.
🎯 Trade Plan (Short Setup)
- Entry Zone: 112,000 – 118,000 USDT
- Stop Loss: above 125,000 USDT
- Take Profit 1: 75,000 USDT
- Take Profit 2: 52,000 USDT
- Final Target (Wave C): around 43,000 USDT
⚡ Notes:
If BTC breaks below the previous wave 4 area with strong momentum, that would add more confirmation to the corrective scenario. However, if the market maintains higher lows, we could still see an extended B-wave or even a continuation of the uptrend.
📘 Reminder:
This is not financial advice — always DYOR and manage your risk properly.
Elliott Wave

Virtual updateas expected the wave 2 was not finished on sun 22 jun but it was a wave b and now the wave c to the down side is almost finished
wave 3 would be valid only if it breaks the 27 may high u guys can accumulate for a potential wave 3 to the upside targeting 5.77$

Ena spot planmade huge gains from this coins trading it from wave C to D
now the wave D has topped looking for wave E to hit my minimum target and then fly to moon
Entry Tp and Sl are mentioned in Chart

Gold. where is FOMO and JOMO zone? 12/Oct/25XAUUSD where would be roughly the FOMO ( Fear of Missing Out ) ( To trap buyers ) and JOMO ( Joy of Missing Out ) ( To trap Seller and Abandoned Gold Buyer ) are would occur? A Nature Harmonic Phenomenon/ Pattern where price balance out from imbalance of supply/demand..

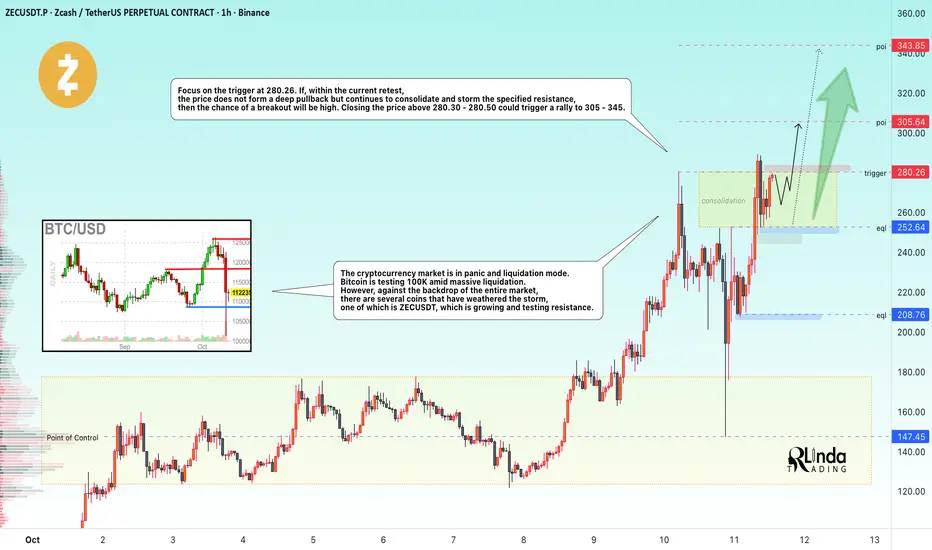
ZECUSD → The altcoin exception that is growingBINANCE:ZECUSDT withstood the blow of the global decline that affected the entire cryptocurrency market, liquidating long positions worth $10 billion. But even in such a situation, there can be exceptions ;)
The cryptocurrency market is in panic and liquidation. Bitcoin is testing 100K amid massive liquidation. However, against the backdrop of the entire market, there are several coins that have withstood the blow, one of which is ZECUSDT, which is growing and testing resistance
ZEC was also hit by the decline, but after testing the control point in the area of maximum volume density 145-155, the market aggressively and quickly bought up the altcoin, indicating bullish strength at the moment.
Resistance levels: 280.30, 305.65
Support levels: 242.64, 208.76
Focus on the trigger at 280.26. If, during the current retest, the price does not form a deep pullback but continues to consolidate and storm the specified resistance, then the chance of a breakout will be high. A closing price above 280.30 - 280.50 could trigger a rally to 305 - 345.
Best regards, R. Linda!
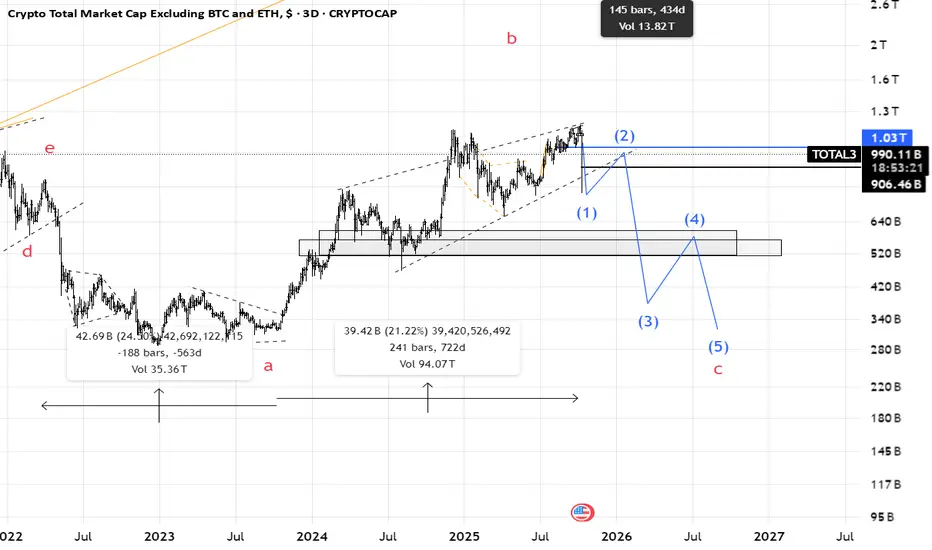
Total3(based on NEo wave) second scenario as the second way for market there is a possibility that we were in wave b of flat and now wave c which is impulse has started.
so I should see it make impulse waves or corrective waves.
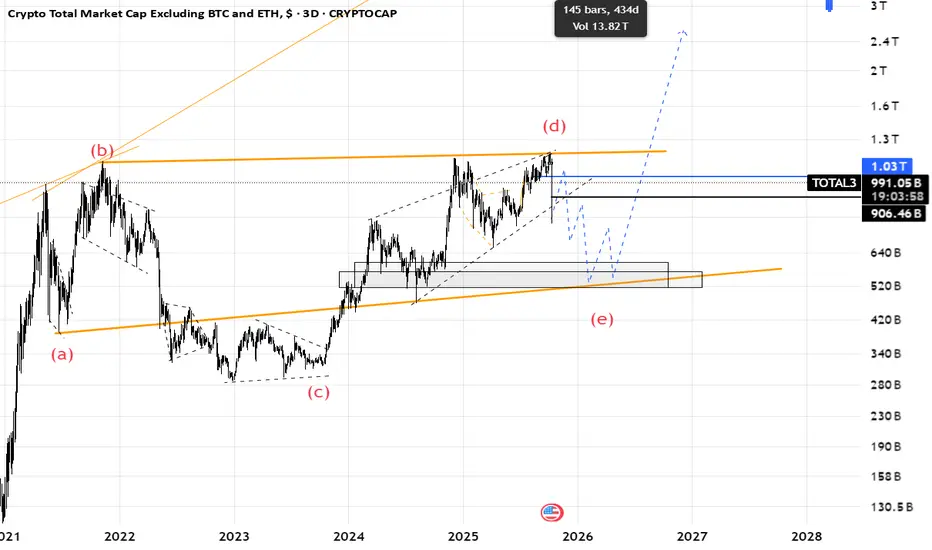
Total3(based on NEo wave)I thought wave (e) is finised but I was wrong.
now I think its the start of wave (e) and we should afraid of altcoins.
when wave (e) is finished altcoins will start to pump.
every upward is a chance to sell.
there is another scenario that I will share it on next post.

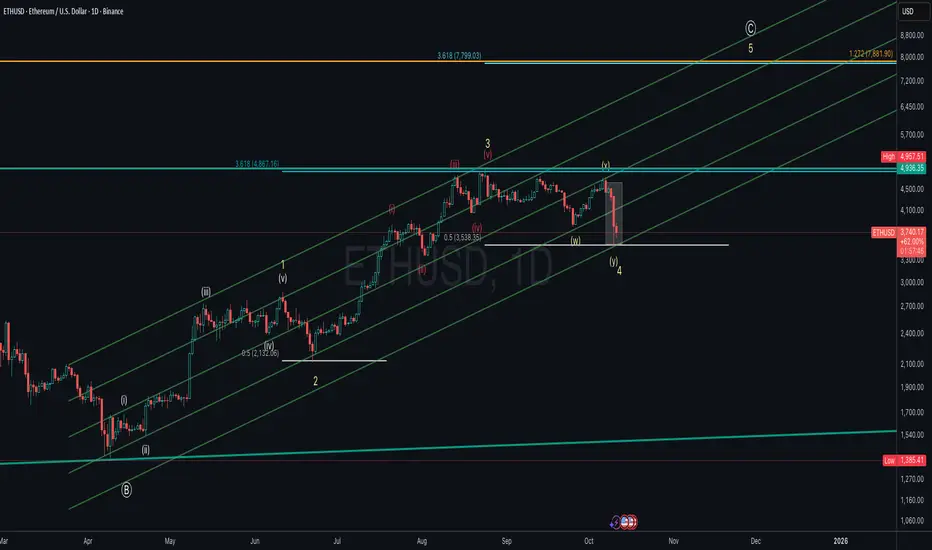
ETHUSD – Wave 4 Correction Near Completion? Preparing for the FiEthereum (ETHUSD, Log Mode) appears to be completing a Wave 4 corrective structure (W–X–Y) within the broader impulsive cycle from the March lows.
Wave 4 found strong support near the 0.5 retracement level around $3,500, aligning with the lower parallel channel of the wave 3 advance.
A potential Wave 5 rally could begin once confirmation of reversal is seen, with upside targets projected at:
$4,867 (3.618 extension of Wave 1)
$7,800–$7,900 (1.272 extension of the macro structure)
If ETH breaks below $3,500, it could invalidate this immediate bullish count and suggest a deeper correction.
Key Levels:
Support: $3,530 / $3,350
Resistance: $4,867 / $7,800
Invalidation: Below $3,500
Watching for signs of a Wave 4 bottom to confirm the start of Wave 5, potentially leading Ethereum into new all-time-high territory in the coming months.
Follow up to my previous post on SPY potential support levelsSPY Technical Analysis — Elliott Wave & Fibonacci Structure
After failing to hold at two key support levels highlighted in the previous update, SPY finally found a temporary bounce at the 0.50 Fibonacci retracement level around 646.84. This aligns with a common Wave 4 retracement bounce zone after an aggressive Wave 3 move down.
1. Wave Structure
The current bounce appears corrective in nature and is likely forming Wave 4 (up) within the broader downtrend.
I do not view this bounce as a full reversal yet — price action still favors a final Wave 5 leg lower.
Ideally, Wave 5 could form a double bottom near the 0.50 Fib level (646.84), providing a potential base-building zone.
2. Key Levels to Watch
🟡 0.50 Fib (646.84) — current bounce zone; potential double-bottom target.
0.618 Fib (640.39) — next critical support if 0.50 fails. A break here may prolong the corrective structure.
⚫ 0.786 Fib (631.21) — deeper retracement zone. There’s a supply zone just above this level (see grey box on chart), which may offer initial demand or reaction.
3.Scenario Planning
If 646.84 holds and price consolidates, a short-term bullish structure could form, but any upside is likely corrective.
If 646.84 fails, the 0.618 level becomes pivotal. Breaking this area may push price into the grey supply zone near 0.786.
My preferred setup in this scenario would be to wait for a clean reaction at the grey zone:
Look for a bounce ➝ retrace ➝ breakout above the bounce high to signal a potential long entry.
Stop-loss placement would likely be just below 0.786 Fib (631.21) to reduce downside exposure.
4. Macro Consideration
Headline risk remains — any unexpected bullish catalyst (e.g., political or macroeconomic news, such as statements from Donald Trump) could accelerate or truncate the Wave 4–5 structure. A short squeeze from oversold levels is also possible but would need confirmation.

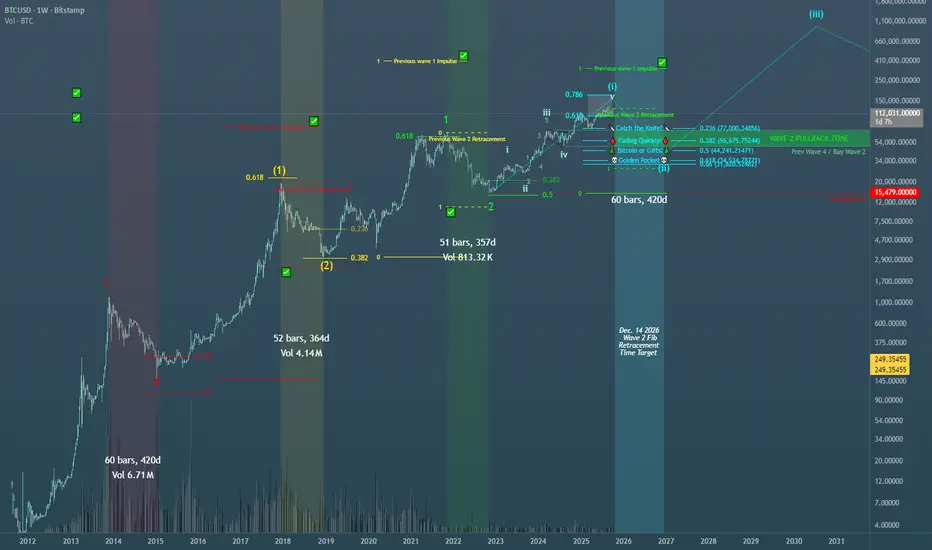
Bitcoin Multi 1,2 Elliott Wave Cycle Analysis: Wave 2 Decryption Shown on the chart is BTCUSD:BITSTAMP on the Weekly Timeframe. This is a breakdown of the Multi 1,2 Elliott Wave Scenario plotted on the chart. This is by far my most bullish scenario for Bitcoin, as we haven't even reached the main wave 3 thrust up, i know its hard to fathom BTC over 1 million dollars, but this is one way to get us beyond that.
Historically the 1,2 pattern has mimicked past 1,2 fractals, usually returning smaller gains and retracements compared to its past 1,2 structure. This is only a guideline for the 1,2 pattern and not a hard rule, although BTC has maintained the right look for this Multi 1,2 Structure throughout its cycle. We are already on the 4th 1,2 pattern continuing the bullish movement to the upside. I have this degree of trend as the final 1,2 before the wave 3 thrust up. Probabilities get lower the more 1,2s we build leading to the 3rd of 3rd of 3rd of 3rd wave thrust, this is already a dream scenario on the Weekly Timeframe, not often do we see these "Rare Unicorn" patterns play out on a HTF, but more often on <15 min TF the rare pokemon are spotted more frequently.
I have highlighted my preferred buy area for the coming wave 2 pullback. The 2nd waves have reached higher fib ratios while still remaining smaller than the previous 1,2 ratios, showing the right look between impulsive and corrective structures thus far. Considering this, wave 2 could surprise us all (MMs known for this) and retrace to the .618 - .66 Golden Pocket area, while still remaining smaller than its past 1,2 fractal. I hope someone finds this useful or at least interesting! Happy Trading
SOLANA – Last Line of Defense🚨 CRYPTO:SOLUSD has completed a 3-wave corrective pullback, testing the April trendline and reaching the equal legs support zone at $175–$160. This area is acting as a potential launchpad for a bounce through the rest of the month.
💥 Can SOL break into new highs, or will this bounce form a lower high, signaling a possible trend reversal?

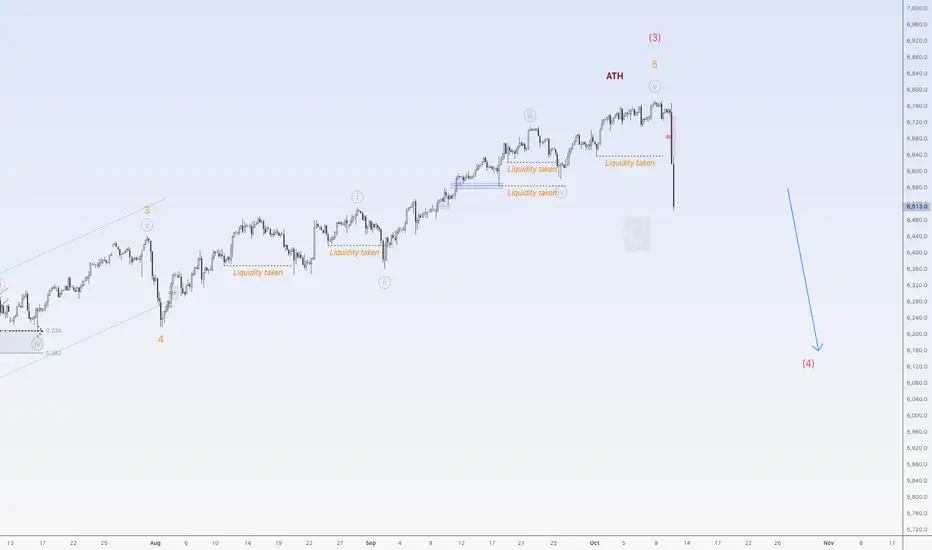
Wait for the correction on BitcoinHi traders,
This time my outlook on Bitcoin last week was great. After it made a new ATH, price went down impulsive (= bearish), made a small correction up and dropped to the previous swing lows. Last week I already said that the move up came out of nowhere.
Now it could go up again. But let's wait for the correction up (bearish) or down (bullish) to take a trade.
Let's see what the market does and react.
Trade idea: Let price make a correction to take a trade bullish or bearish.
If you want to learn more about trading FVG's with wave analysis, please make sure to follow me.
This shared post is only my point of view on what could be the next move in this pair based on my analysis.
Don't be emotional, just trade your plan!
Eduwave

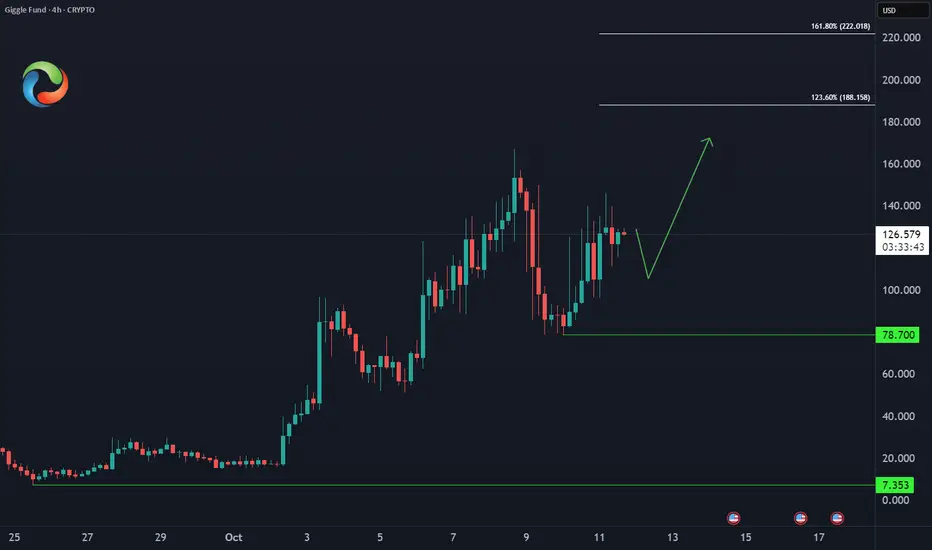
Giggle Fund – Upside Targets📈 As long as BINANCE:GIGGLEUSDT.P holds above yesterday’s low of $78.70, the bullish outlook remains intact. Price is expected to continue pushing higher toward the target zone of $188–$222.
#ElliottWave #Binance
Correction down for goldHi traders,
Last week gold went up some more and started a correction down.
This could become a bigger correction but at the moment we could see one more move down for next week.
Let's see what price does and react.
Trade idea: Wait for a small correction up on a lower timeframe and a change in orderflow to bearish to trade (short term) shorts.
If you want to learn more about trading FVG's & liquidity sweeps with wave analysis, please make sure to follow me.
This shared post is only my point of view on what could be the next move in this pair based on my technical analysis.
Don't be emotional, just trade your plan!
Eduwave

TAOBOT Bullish Reversal After Surviving the Crash📈 UNISWAP:TAOBOTWETH_8FE920.USD held firm at the June low of $0.20, shrugging off the recent market crash and now printing a daily bullish reversal.
🔹 Holding key support = structural resilience
🔹 A weekly confirmation could unlock momentum toward the August highs near $0.60
This setup puts TAOBOT back on the radar for trend reversal traders.

Bigger correction down for SPX500USDHi traders,
I called the top in my outlook of last week for SPX500USD.
After a small correction last week it went up one more time to make a new ATH. After that it dropped.
Now it started the bigger correction down.
So next week we could see a correction up and more downside for this pair.
Let's see what the market does and react.
Trade idea: Wait for a correction up and a change in orderflow to bearish on a lower timeframe to trade shorts.
If you want to learn more about trading FVG's & liquidity sweeps with Elliott wavecount and patterns, then please make sure to follow me.
This shared post is only my point of view on what could be the next move in this pair based on my technical analysis.
Don't be emotional, just trade your plan!
Eduwave
Will EU go up this time?Hi traders,
Last week EU started with a gap down and dropped to take the lower liquidity.
Next week we could see price come into the lower Daily FVG and reverse from there. It still looks like that the downmove is corrective and this pair goes up one more time to finish a big ending diagonal into the Weekly FVG.
Let's see what the market does and react.
Trade idea: Wait for price come into the Daily FVG and reverse. After an impulse wave up and a correction down, look for a change in orderflow to bullish on a lower time frame to trade longs.
If you want to learn more about trading with FVG's, liquidity sweeps and Elliott wavecount and patterns, then make sure to follow me.
This shared post is only my point of view on what could be the next move in this pair based on my technical analysis.
Don't be emotional, just trade your plan!
Eduwave

A map of PepeusdtA right and left shoulder is made + head + Elyot waves analysis. This is a corrective rise and not a motive .. The movement
It is expected to land on the area specified below in the coming weeks
*In principle, I am not a supporter of any direction, but I am only giving my point of view, which may be right or wrong. If the analysis helps you, then this is for you. If you do not like this analysis, there is no problem. Just ignore it. My goal is to spread the benefit. I am not one of the founders of the currency.

HBAR Reversal time?My long-term golden pocket target has finally been reached leaving a long lower wick behind as demand soaked up the drop. Price is likely to retrace into the middle of the wick and find its final support if the move was truly the wave 2 bottom!
If we go lower the ‘alt-coin golden pocket’, 0.786, sits at the major High Volume Node support and would be a great buy as well as a good spot to look out for longs.
Weekly RSI has room to fall but bullish divergence is forming!
Wave 3 has a minimum expected target of $0.65 aligning with targets from the standard deviation bands above. Wave 5 has a minimum target of $0.75
Safe trading

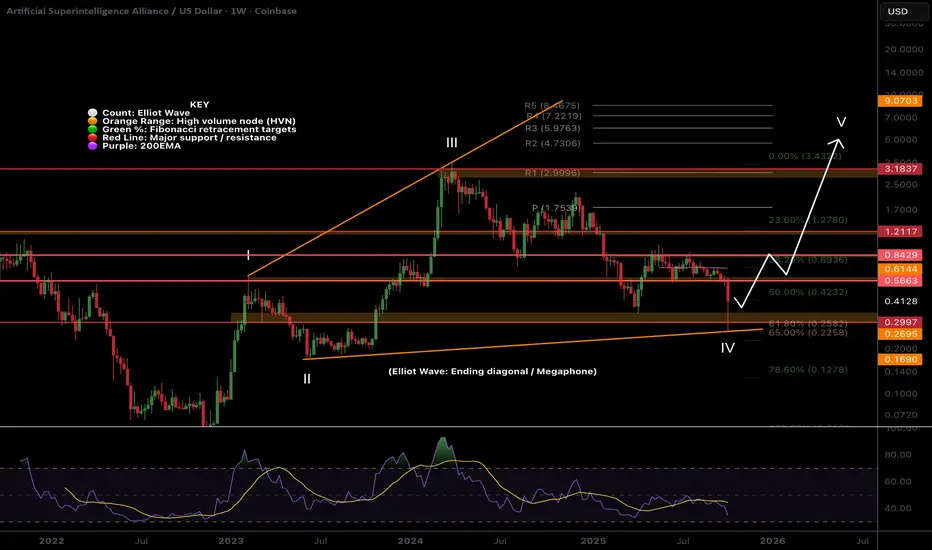
FET extreme opportunity zone!NYSE:FET wave IV megaphone pattern is still in play despite the lower low and is invalidated only if we get blow wave II at $0.1685. This is a complex Elliot wave structure where investors and traders get trapped easily!
Weekly RSI now has bullish divergence forming but is not yet confirmed. Price found support at the major High Volume Node and Fibonacci Golden Pocket, a high probability reversal area!
Wave V has an expected target of the R2 weekly pivot at $4.73 but can over-extend in an exuberant market conditions.
Fetch had one of the largest runs last year offering a 56x from a swing below the SD-3 green opportunity band zone. When an asset moves with such momentum to the SD+3 threshold (where it is expected to spend <1% of the time) momentum is found in the opposite direction and gives way to extreme undervaluation! This is were we strike!
Price has now reached the opportunity green band zone once more quickly catching a bid of 20% as of writing. Price is expected to spend <5% of the time in this zone offering investors a short window of opportunity. It can go lower of course but there is a good chance a bottom is formed in this area! I intend to buy here and I am looking out for longs which give me larger position size than buy and hold due to the nature of the risk management.
Price targets for fair value, where we expect price to return to at least, is currently at $0.60. Another irrational alt-season with backed momentum could see a new all time high towards the $5 range and I will take profits at each band threshold along the way!
DKNG Update | Crash AheadOne of the best fractal overlays I've seen with some Elliott Waves to go with it.
Price is still in a uptrend but with growing sellers It'll come to an end similar to the last fractal.
During the 3rd wave in the last pattern price experienced its first pullback at (B), and its second at correction wave 4 and the third after the last wave before we witnessed the last push in buyers.
This current cycle price is in a similar stage with a swing low at (b) meaning that we could see another run-up towards major resistance ($63).
This would be the final blow-off-top in general markets. TVC:RUT is already showing signs of weakness which works well with this TA example.
When the time is right I'll do another TA for the downfall. For now I'm bullish but for the horizon I'm very bearish.

Relief Rally or Further Drop? Key Levels to Watch on ARBUSDTARBUSDT continues its descent after invalidating the macro rising wedge, with price action firmly suppressed below key supply zones. Current wave structure hints at a potential relief rally toward 0.3886 before resuming the broader bearish trajectory toward the projected drop target at 0.1718. Until the macro descending trendline at 0.6259 is decisively broken, bearish sentiment remains dominant.
