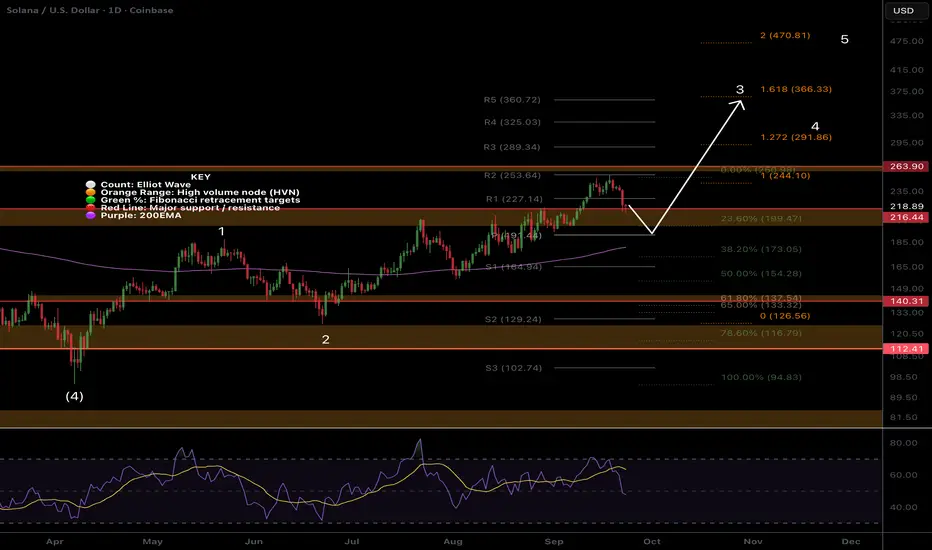
SOL Rejected at all time high! Whats next?Local Analysis / Targets / Elliot Wave
Solana attempted to break into price discovery but was rejected harshly back to the High Volume Node support trapping new traders and investors with the all time high excitement. Wave 3 appears to be underway with a minimum target of $365 the 1.618 Fibonacci extension and R5 daily pivot. Wave 3 pull backs should be shallow.
Continued downside bring up the ascending daily 200EMA and 0.382 target of $173. RSI is at the EQ and crossed bearishly.
Standard Deviation Band Analysis
Solana continues in the expected range just above fair value. Its attempts to break through the SD+2 threshold continue to thwarted but the next attempt will be number 4, the higher probability breakout!
Safe trading
Elliott Wave
ONDO Flat Correction Near Completion?Local Analysis / Targets / Elliot Wave
Ondo appears to be in a flat correction defined by the pattern and depth of the interior Fibonacci’s. Wave X appears complete and Y is underway, often a strong sell off phase as we can see here. Price would only be expected to whip below wave W to complete wave 2 before heading to new highs in wave 3. This also tests the High Volume Node as support and golden pocket.
The first wave 3 target is $1.5 High Volume Node resistance and R4 daily pivot. RSI has plenty of room to fall.
Standard Deviation Band Analysis
Price is riding the fair value regression line but remains just below after several tests as resistance. Continued downside would put Ondo in the green opportunity buy zone which most often presents great returns and price only stays there <5% of the time.
Safe trading

ETH Correction Finally Underway!Local Analysis / Targets / Elliot Wave
I have been banging the drum about a deeper ETH pullback for a weeks and it appears to be finally underway with bearish market structure confirmed with the lower low from yesterday. Online sentiment, mainstream media attention, silly price targets from analysts, discussions of the ‘the flippening’ returned and Trumps son bragging on X were all major warning signs of a local top. The ETH validator exit queue is record breaking causing a delay of 40+ days if you want to un-stake your ETH. Wrapped Ethereum like stETH may be a good option if you really want out fast! Weather this supply hits the markets is still up in the air.
Price is in the High Volume Node support and below the daily pivot. This isn’t likely to break immediately but after a few attempts to weaken it first (4? lol). The first target for the end of the correction is the same as a few weeks ago - the S1 pivot, rising daily 200EMA and 0.382 Fibonacci retracement at $3500, followed by the S2 pivot, High Volume Node support and 0.786 ‘alt-coin golden pocket’ at $2700. This could present a great buy opportunity.
RSI is making its way to oversold which is a good sign when in a range.
Standard Deviation Band Analysis
Standard deviation bands tell a different story with price still only testing the fair value regression line as resistance after presenting a fantastic buy opportunity from the green zone earlier this year. Price rides this line most of the time as you can see by looking left. A significant breakout above would see the SD+2 threshold target around $7000, a blow off top could reach $10,000 at the SD+3 threshold.
Safe trading

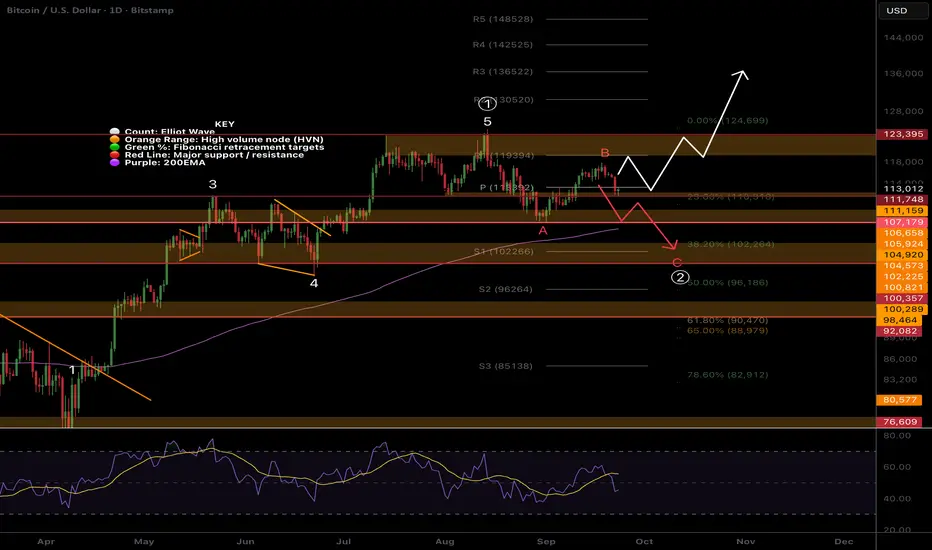
BTC Continues to Range, Lower to come in wave C of 2?Local Analysis / Targets / Elliot Wave
Yesterdays BTC pullback could be wave 2 of 1 terminating with a swing below the daily pivot point straight into the demand High Volume Node. Bulls want to see this move back above the pivot at least today.
Alternatively wave B of the wave (2) pull back could be complete at $117k, wave C has a target of the S1 daily pivot, High Volume Node Support and 0.382 Fibonacci retracement at $102k. This would coincide with a swing below the daily 200EMA and recovery offering a long signal.
RSI is at the EQ and bearishly crossed.
Standard Deviation Band Analysis
Bitcoin standard deviation bands remain the same as price grinds along its upwards trend just above the fair value regression line after testing it as support. Not much to add here, all is normal!
Safe trading
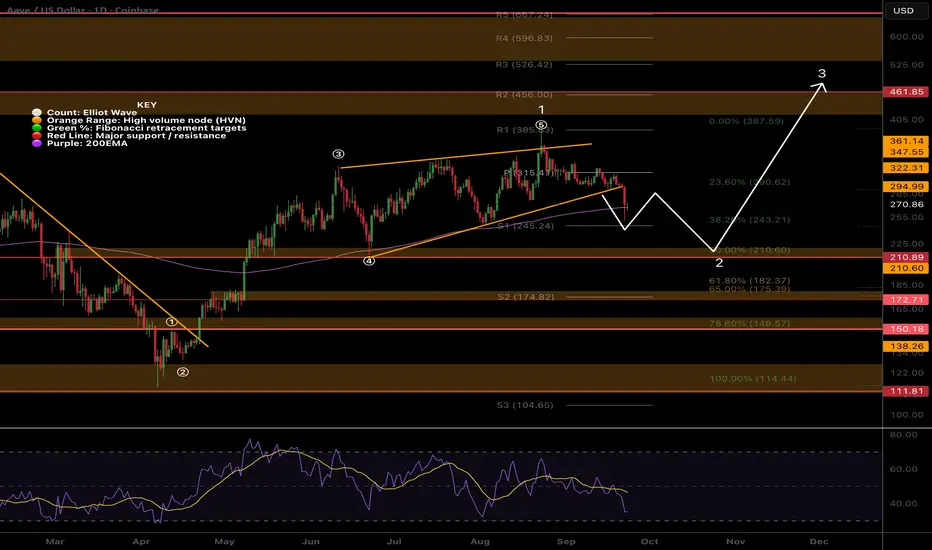
AAVE Breakdown from wave 5 wedge. Whats next?Local Analysis / Targets / Elliot Wave
CRYPTOCAP:AAVE broke down out of the wave (5) of 1 wedge per my previous analysis reaching the paths first target to find support the daily 200EMA and S1 pivot point. If price continues lower I expect it to bounce first before delivering a final thrust down in wave C of 2.
The major support High Volume Node, $210, is the target at the 0.5 Fibonacci retracement. Further breakdown brings up the golden pocket and S2 pivot, $175, and the alt-coin ‘golden pocket’ sits at $149 the 0.786 Fibonacci retracement. This is the most common area for alt-coin pull backs to terminate and a characteristic area for low volume, highly volatile assets in general due to the psychology as I discuss on my Fibonacci tutorial on YouTube.
RSI is making its way down into oversold but has plenty of room to fall with no bullish divergence yet.
Standard Deviation Band Analysis
Standard deviation bands are non-normally distributed unlike the renko chart shared in yesterdays report when time is removed. Price continues to spend way to much time at extremes with fast movement through the fait value zone. Bands are shifting significantly positive as time goes on due to price spending so much time in th eupper boundaries. This is a good sign of strength, dips remain shallow showing strong demand.
Price is testing the SD+2 threshold as support now and losing this would bring up the next target of the fair value regression line at $150 which adds confluence to the alt-coin ‘golden pocket’ targets in the technical analysis.
Safe trading
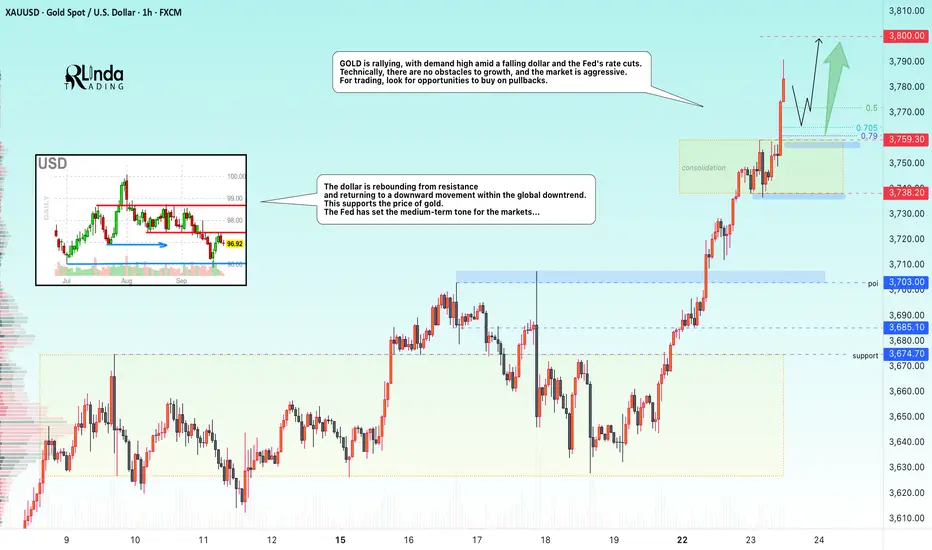
GOLD → Aggressive growth is not over. Powell's speech...FX:XAUUSD is rallying, with demand high amid a falling dollar and the Fed's rate cuts. Technically, there are no obstacles to growth, and the market is aggressive. For trading, look for buying opportunities on pullbacks.
Gold is rallying and hitting new highs as people realize what's going on (interest rates are falling). Powell's speech is coming up, and it may trigger a correction (profit-taking) amid growing risks.
Key factors: Powell's speech today, at which time the market is waiting for hints of further easing of Fed policy.
PMI data (US), weak figures will support the possibility of further rate cuts...
Demand for metal is supported by geopolitical tensions in the Middle East and Eastern Europe.
Resistance levels: 3800
Support levels: 3760
Many factors are supporting the rise in gold, and there are no compelling reasons to sell gold now. The ideal trading strategy is to wait for a pullback and retest of support levels with the formation of strong reversal points for buying.
Sincerely, R. Linda!
Dogecoin DOGE – Extreme Buying Zone in Play🚀 CRYPTO:DOGEUSD has pulled back into the equal legs area at $0.23–$0.22, right inside the uptrend channel from June, and is now forming a higher low, a classic setup for a bullish reaction.
If momentum kicks in here, this could mark the beginning of the next impulsive leg, with potential to break above $0.30.
Eyes on the meme king this zone could be the launchpad.
#ElliottWave #MemeCoins #ALTSEASON

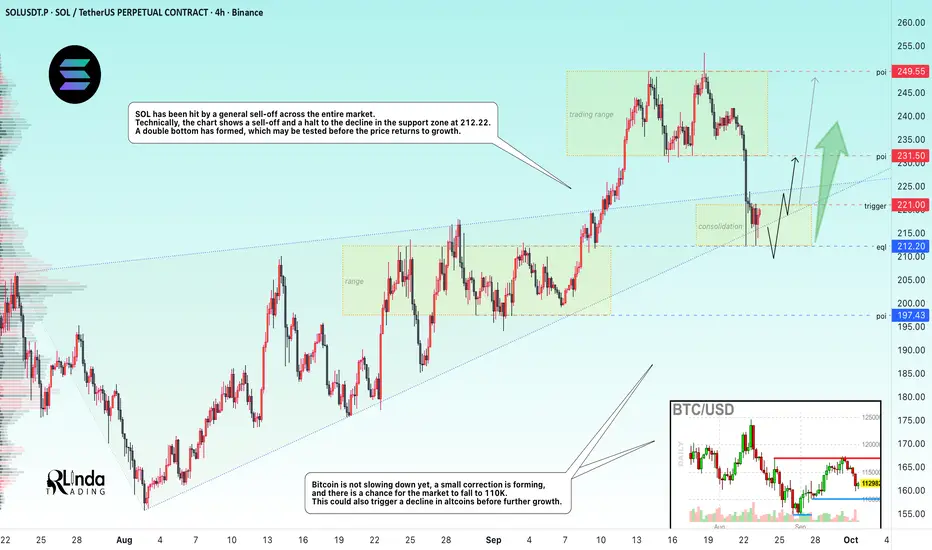
SOLANA → When will the sale end? Bullish trend...BINANCE:SOLUSDT.P is testing the key support zone of 210-215 amid a market decline. However, it is too early to say that the correction is over; additional signs are needed...
Bitcoin is not slowing down yet, a small correction is forming, and there is a chance for the market to fall to 110K. This could also trigger a decline in altcoins before further growth. SOL has been hit by a general sell-off across the entire market. Technically, the chart shows a sell-off and a halt to the decline in the support zone of 212.22. A double bottom has formed, which may be tested before the price returns to growth.
The current consolidation in the range of 212.0 - 221.0, the boundaries of which are of interest to the market, gives hope.
Support levels: 212, 200, 197
Resistance levels: 221, 231.5
A breakout of the local consolidation resistance and a close above 223.5 - 224 could trigger further growth within the bullish trend. Otherwise, MM may test the liquidity and support zone of 212.0 before the coin begins its recovery phase.
Best regards, R. Linda!
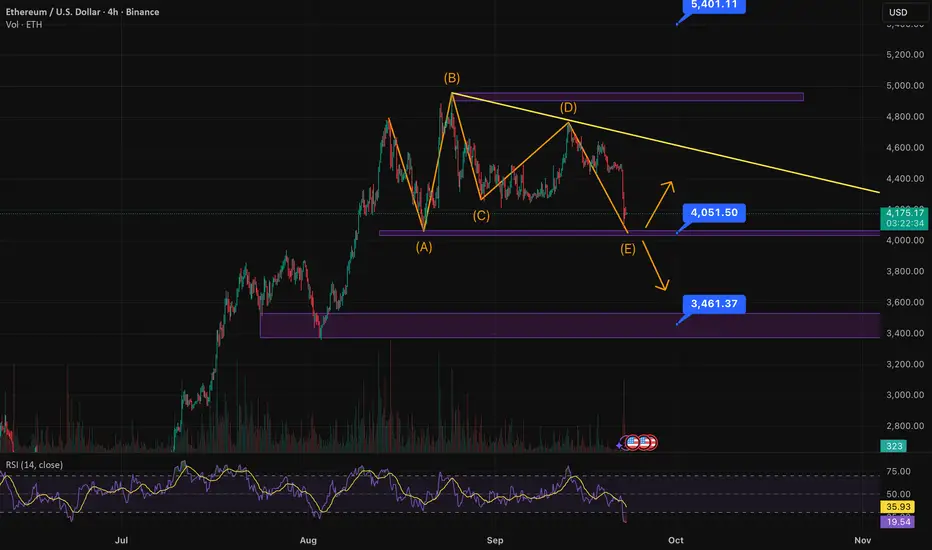
$ETH 09/22: New ATH or continue dumping?CRYPTOCAP:ETH is most likely in Wave 4 of an Elliott 5-wave structure. The ideal scenario is a Triangle Correction for Wave 4. If that plays out, we’ll see a breakout into Wave 5 after this consolidation.
Key level: $4,050. This is the crucial support to watch. A solid bounce here could launch ETH into Wave 5, targeting ~$5,400 (based on the 0.618–1.0 Fib extension of Waves 1–3).
Bearish case: If ETH breaks below $4,050 with strong volume, price could slide further toward the previous low near $3,460.
Signals to watch:
Volume is fading, which fits the triangle pattern.
RSI is oversold, hinting at a potential bounce.
Keep an eye on divergences in MACD/Stochastic for reversal confirmation.
Wave 4 is usually longer and more complex than Wave 2, so ETH may still chop sideways before the real breakout.
👉 Bottom line: ETH is at a key crossroads — hold $4,050 and aim for $5,400 on Wave 5, or lose support and revisit $3,460.
Klarna long idea🎯 Technical Setup:
Daily demand zone at ~$42-44 providing STRONG support
Break of structure (BOS) confirmed with rejection from demand
Perfect 1-2 Elliott Wave setup developing after correction
Target: 50% retracement minimum = $52+ (20%+ gain from current levels)
🚀 Klarna FINTECH PHENOM:
BNPL Empire: 150M+ users, $6.9B GMV quarterly – the "Buy Now, Pay Later" king
AI Powerhouse: Replaced 700 jobs with AI for 40% faster decisions & $40M savings
Siemiatkowski's Vision: Building the next-gen digital bank disrupting Visa/Mastercard
3x E-commerce Leverage: KLAR surges 3x on any online shopping boom
💰 The Ultimate BNPL Play:
Pure Growth Exposure: No legacy bank baggage, just explosive consumer finance
Global Commerce Revolution: 790K+ merchants, from H&M to Amazon – everywhere you shop
Institutional Darling: Wall Street's go-to for fintech revival post-IPO pop
Revenue Rocket: Q2 up 54% to $823M, first profitable quarter at $29M
🎪 Why This Could Be EXPLOSIVE:
Demand Zone Bounce: $42-44 institutional accumulation holding firm post-IPO dip
E-comm Catalyst: Any holiday spending surge above $7T GMV triggers KLAR mania
Wave 3 Setup: Most powerful Elliott Wave primed to launch
AI Effect: Klarna's AI army driving efficiency & user addiction to seamless payments
Entry Strategy:
Current: $43 (bouncing perfectly off daily demand)
Confirmation: Above $46 with volume surge
Stop: Below $41 (demand zone violation)
Target 1: $52 (50% Fibonacci level)
Target 2: $60+ (if GMV breaks $8B quarterly)
KLAR = BNPL on steroids at perfect technical entry! 🚀

EURUSD | BUY SETUP | 15 MIN EUR/USD (15M timeframe) intraday outlook 📊
Completed 5-wave structure near resistance (ending diagonal).
Short-term rejection visible around 1.1783 – 1.1818 zone.
Price likely to correct toward 1.1772 – 1.1773 buyers’ area before next move.
Short-term traders can look for scalp opportunities with tight risk management.
⚡Key Levels:
Resistance / Order Block: 1.18176 – 1.18187
Intraday Pivot: 1.17837
Buyers’ Support: 1.17718 – 1.17721
📌 This setup aligns with Elliott Wave + price action confirmation for intraday trade planning.
#EURUSD #Forex #ElliottWave #Scalping #SmartMoneyConcepts #PriceAction #OrderBlock

EUR/USD Elliott Wave + Order Block Analysis | Buyers in Control EUR/USD (2H timeframe) technical outlook 📊
Completed 5-wave impulse ✅
ABC correction in play
Strong Buyer Zone around 1.1772 – 1.1750 highlighted 💹
Price expected to retest Order Block (1.1818 zone) before next move
Watching for bullish confirmation patterns around buyers’ zone
⚡Key Levels:
Order Block: 1.18187
Buyers Support: 1.17721 – 1.1750
This setup combines Elliott Wave + Smart Money Concept (Order Block) to refine entries.
#EURUSD #Forex #ElliottWave #OrderBlock #ForexAnalysis #PriceAction #SmartMoneyConcepts

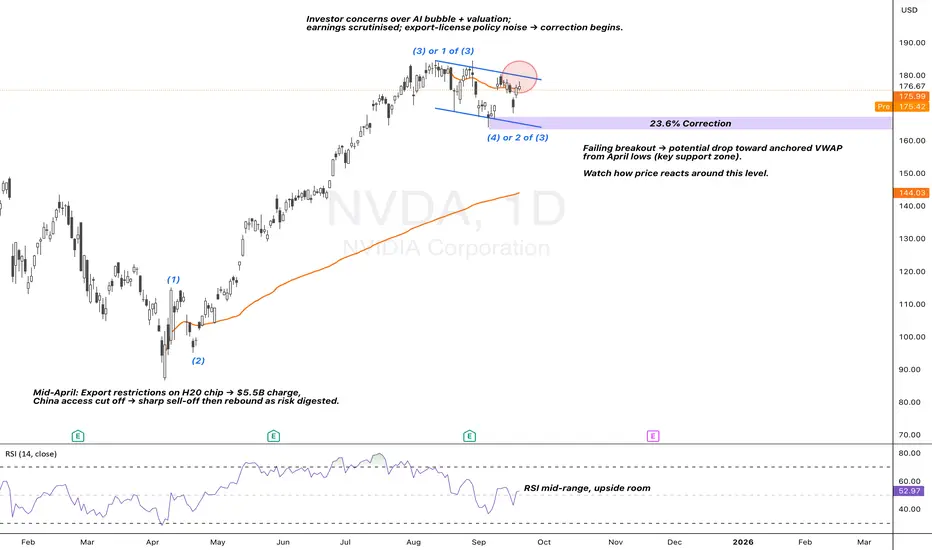
NVDA | Wave (3) in Play at Key Consolidation ZoneNVIDIA’s rally since April was powered by AI infrastructure demand and a rebound in risk sentiment after tariff and export-control concerns were digested. Strong hyperscaler capex and global AI partnerships reinforced the bottom-up story, while a broader tech bid lifted growth equities. Yet, the same catalysts pose risks: valuation stretch, regulatory noise, and questions on AI monetisation timelines leave room for volatility.
Technical Lens:
Price action suggests NVDA is tracking a larger wave (3). However, the sub-wave structure remains unproven, with only a shallow 23.6% retracement, leaving scope for further correction. Current consolidation sits at a decision point, supported by RSI, which remains mid-range with room to extend higher.
Scenarios:
If breakout holds: Momentum can carry into the next impulsive leg of wave (3), supported by structural demand.
If breakout fails: Price could rotate lower toward the anchored VWAP from April 2025 lows, a key support zone.
Catalysts:
Ongoing AI-driven hyperscaler spend and sovereign partnerships (upside).
Renewed U.S.–China export restrictions or capex digestion (downside).
Macro policy shifts and market positioning into year-end.
Takeaway:
This is a consolidation decision point within wave (3). Breakout = continuation, failure = correction toward April VWAP support.
GOLD → The rally continues. We are waiting for a pullback to buyFX:XAUUSD is rallying since the opening of the trading session. The movement has been continuing since Friday, after the end of the correction. The market is realizing the potential for interest rate cuts...
The metal is showing gains for the fifth week in a row, despite the local recovery of the dollar.
Key supporting factors: The forecast of two rate cuts before the end of the year continues to fuel interest. Tensions in US trade relations with India and other sources of instability. Upcoming PCE data on Friday may confirm the need for a soft policy. BUT! Caution is needed, as a short-term correction (profit-taking) is possible after record growth.
Resistance levels: 3730, 3740, 3750
Support levels: 3703, 3685, 3674
The price is in the ATH zone, having come a long way since the opening of the session, and a correction may form. It is dangerous to sell in the current zone, and for trading within the bullish trend, it is worth waiting for a pullback to the nearest local support levels...
Best regards, R. Linda!

XAUUSD – Wave (v) Completed, Wave (4) Correction Ahead🔹 Title:
XAUUSD – Completion of Wave (v) and Potential Start of Wave (4) Correction
🔹 Description:
According to the current Elliott Wave count:
The impulsive wave (3) has reached Fibonacci extensions of 261.8% – 288%.
Wave (v) has completed within the 3670–3710 zone (label placed slightly higher for clarity).
A broader correction is expected toward the 3535–3500 area as sub-wave (iv), within the larger Wave (4).
❌ Invalidation level:
A break below 3435 would weaken this Wave (4) scenario and suggest an alternative count.

The BRYAT chart indicates a bullish trendRequested Analysis for BRYAT:
I usually don’t perform requested analyses unless a large number of people request the same symbol.
Analysis:
In the 2W cash data, we can see that BRYAT started an upward movement in November 2019, with a price peak of 4,667. Given the clear time and price similarity between the waves, it appears that a bowtie diametric pattern is forming, with wave (f) of the diametric currently in progress. The time correction for this wave could last until the period between October 27 and January 20 at the latest.
Therefore, one bullish wave of the diametric remains, namely wave (g), with the first target for this wave being 5,970, and it could potentially move up to 12,000.
Good luck
NEoWave Chart

Litecoin LTC – Bounce Setup in Play📊 CRYPTO:LTCUSD has completed a corrective move into the equal legs zone at $102–$97, aligning with the April uptrend channel—a classic Elliott Wave support confluence. This area is primed for a bullish reaction, with buyers likely stepping in to fuel the next leg higher.
🎯 With bullish structure intact, the next upside target within this cycle is projected at $147, marking a potential Wave 5 extension.
#ElliottWave #Altcoins

NSE BALRAMCHIN – Elliott Wave Suggests Bounce After Wave CNSE BALRAMCHIN shows that the stock completed a strong up-move earlier and is now going through a correction. At the moment, the stock is trading below its 20, 50, 100, and 200 EMAs, which means the short-term trend is still down. The ADX (21.41) also indicates that the trend is not strong right now, and the market is more sideways. However, a falling wedge pattern is visible, and such patterns often end with a sharp upward reversal.
According to Elliott Wave theory, the 5-wave rally ended near 627.80, after which the price started falling in an A-B-C correction. Currently, the stock looks close to completing the last leg of this correction (wave C). The important support zone is between 514 and 500. If the price manages to stay above 514 and crosses back above 525, traders can go long for the following targets: 543 – 576 – 615 – 640 +

Ethereum Finally Clears Path Towards $5,000+Should Ethereum maintain support above $4,245 over the next few days, it should solidify its intention for a run above $5,000 by mid-late October.
Plenty of bears await the arrival.

TeslaIf you recall, last week I mentioned that I think Tesla gives us another high before it is all said and done. That would complete what I am calling an ED to finally finish off intermediate wave (B). Currently, price is trading @ $434.32 in the overnights according to Robinhood. This creates the new high I was looking for, and if correct, would conclude this move higher. Also, if this is an ED, then once it finally completes, it will move swiftly towards the $400-$405 area as that is where it started. That move lower would be considered the start of wave (C) and would either be wave a, or the start of wave 1.
In short, I believe the high we got in the overnights should be the last leg of this move higher. Rather it finishes tomorrow or sometime in the upcoming week, I do believe this move higher is finally coming to an end. If this is correct, it would be a good area to short the stock...with stops of course.
The ALT that I am watching for is that this high we're getting now in the overnights is just the last leg of micro-wave 3 with 4 & 5 yet to come. The strength in which it moves lower after completion will answer that question for us. A swift move to the above-mentioned price level = completion. A choppy lackadaisical move lower would likely mean the turquoise count is coming to fruition.

XRP/USDT: Wave 5> Primary wave count: XRP is currently in black wave 5, with a target near $4.00 or higher.
> Validation level: This count remains valid as long as price stays above wave 1 high at $2.6549.
> Current resistance: Price is facing resistance at the $3.15 level (gray zone).
> Breakout signal: A move above $3.15 would signal strong bullish momentum.

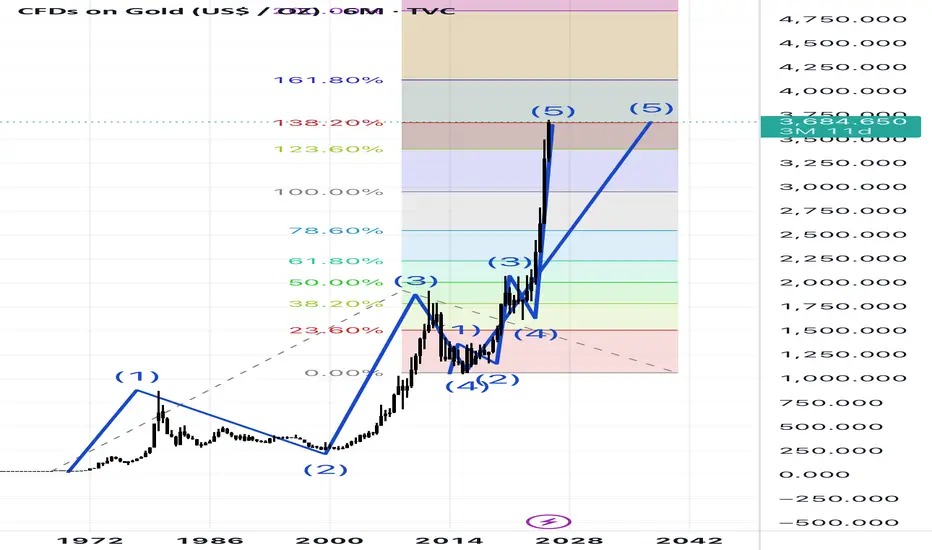
Gold in regular chart scaleThis is a regular chart scale where is shows two extended fifth wave from different degrees which is common for commodities.
And also the fifth wave reached 1.382 of the start of the wave to end of the 3rd wave.
And Also to the previous chat for gold in logarithmic chart.
So it probably will start to correct soon.
GOLD → Breakthrough of correction resistance. Uptrend FX:XAUUSD entered a correction phase after the Fed meeting and interest rate cut, but by the end of the week, the market managed to recover from the decline and return to the zone of interest, breaking through the resistance of the downtrend...
The dollar is correcting after the Fed meeting on interest rates. The index is testing resistance at 97.5-98.0, and a false breakout of this zone could trigger a fall in the index, which in turn would only support the forex and gold markets...
At this time, the metal is reducing its correlation with the DXY and breaking the resistance of the downward correction, which is provoking an impulse to 3685. Technically, Friday's trading session is closing quite positively, which generally indicates a high level of demand.
I would highlight several key levels: the previously broken resistance at 3674 (below this zone there is a hidden liquidity pool) and resistance at 3685 (trigger). A retest of the lower level is possible before the price continues its growth. The target within the current movement can be considered 3700 - 3710.
Support levels: 3674, 3668, 3660
Resistance levels: 3685, 3703, 3710
If, during the Asian/Pacific session, gold consolidates without a pullback and closes above 3685, the market may continue to rise towards the specified target. However, if the market lacks potential (after the weekend), then MM may test 3674 - 3668 before the price returns to growth towards the target of 3700.
Best regards, R. Linda!
