AUD/CAD Approaching Support: Strong Bounce IncomingAUD/CAD has finished a strong 5-wave move to the upside, completing Wave (1)/(A). Since then, price has been moving in a corrective channel and is now forming an A-B-C decline toward the lower support zone. The current structure suggests one more push down to complete Wave C of (2)/(B), where buyers are likely to step back in. Once that final dip finishes, the chart expects a powerful Wave (3)/(C) rally to the upside, targeting new highs. In simple terms: small drop left → correction ends → strong bullish continuation ahead.
Stay tuned!
@Money_Dictators
Thank you :)
Elliottwavesanalysis

META — Possible Macro Peak, Bearish Year AheadMeta may have completed its long-term C wave after reaching new all-time highs at the top of the macro channel.
The structure now shows emerging bearish sequences on lower timeframes , hinting that the next yearly cycle could be corrective or bearish rather than impulsive.
While the theoretical WCL sits far below (around 350–400), such a deep retracement would imply a 50% drop — an extreme but technical possibility.
A more realistic path could be a 20–30% macro correction as the market digests Meta’s extended rally and rebalances valuation.
Key Points:
Macro C wave completed at the upper channel boundary.
Lower timeframe sequences turning bearish.
WCL remains the ultimate downside target, though not the base case.
Expect a potentially bearish or corrective year ahead for Meta, within the long-term bullish structure.
Invalidation:
If price reclaims the 780–800 zone and breaks above the red B high, bearish structure fails.

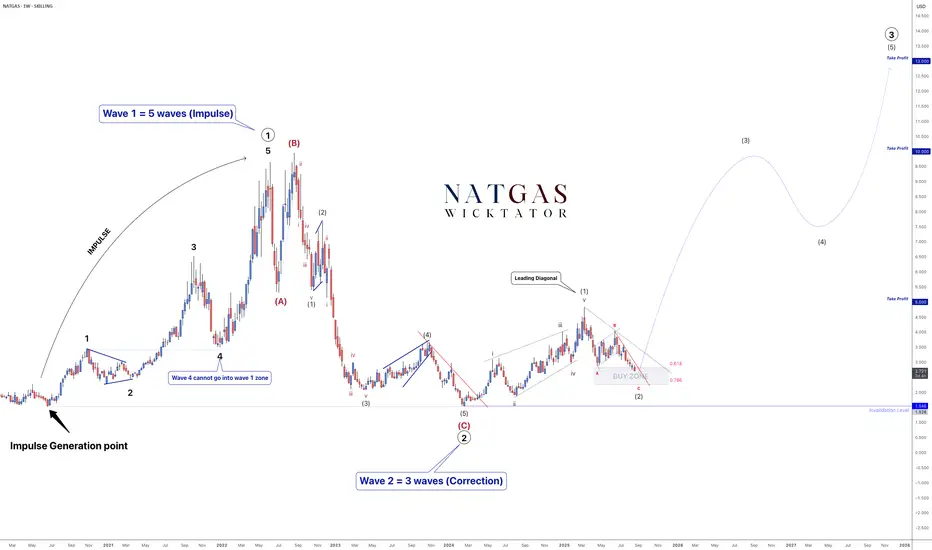
NATGAS - Catch The Impulse!As Wave Traders, our job is to spot corrections and catch the impulse, because that’s where the biggest moves happen.
On NATGAS, we completed Wave 1 with a leading diagonal, and are now finishing Wave 2 (an ABC correction). Once corrections are done, the next phase is Wave 3 - historically the longest and strongest wave in Elliott Wave Theory.
We've almost completed wave 2 and looking for a breakout for wave 3, which is the longest wave.
Trade Idea:
- Watch for break of the red trendline to indicate the start of wave 3
- enter with stops below breakout or below invalidation
- Targets: 5, 10, 13
NATGAS 12H Chart:
We'll be looking to enter on break of the red trendline with stops below breakout.
This setup is a textbook example of how Elliott Wave helps us prepare - not chase - the market.
Goodluck and as always, trade safe!
LINK Rally Cools Off — Next Long Opportunity at $20LINK has awakened with strength, rallying +60% in just 10 days. Price completed a clean 5-wave Elliott impulse, topping at the 1.0 trend-based Fib extension, which aligned with:
0.702 Fib retracement
Pitchfork upper resistance line
Key resistance zone
This perfect confluence marked the 5th wave top, followed by a -13% correction.
🔴 Short Opportunity
The current structure is forming a Head & Shoulders pattern.
➡️ Resistance zone: $23 – $23.5
🧩 Confluence factors:
Anchored VWAP (red line) from the 5th wave top
Fib speed resistance fan – Golden Pocket
➡️ Target: $20 support zone.
🟢 Long Opportunity Zone
The $20 zone offers the strongest confluence for a long entry:
Yearly Open (yOpen): $20.02
0.5 Fib retracement: $20.09 (of the 5 Elliott waves)
Pitchfork golden pocket
Anchored VWAP (green line): $20.28 (swing high)
Fair Value Gap (FVG) / imbalance fill
Liquidity pool
$20 psychological level
Trade Plan:
Entry: $20.5 – $19.5
Stop Loss: Below $19
Take Profit: $25
Potential gain: +25%
R:R: ~1:5
🔍 Indicators used:
DriftLine — Pivot Open Zones → For identifying key yearly/monthly/weekly/daily opens that act as major S/R reference points
➡️ Available for free. You can find them on my profile under “Scripts” and apply them directly to your charts for extra confluence when planning your trades.
_________________________________
💬 If you found this helpful, drop a like and comment!

Elliott Wave Insight Into EUR/USD’s Recent MovesThe EUR/USD chart has delivered a clean Elliott Wave sequence, which helps us forecast what may come next.
Wave Count Overview
The structure leading up to the high shows a clear five-wave impulsive rally, ending at Wave 3 in yellow.
This was followed by a corrective A-B-C zigzag, with:
A sharp Wave A down
A shallow Wave B bounce
A clean Wave C drop, matching Wave A in length, bottoming at the 100% Fibonacci projection around 1.10711.
Why This Matters
Elliott Wave theory tells us that a completed zigzag correction—especially when followed by a consolidation like a triangle—often leads to a continuation in the direction of the larger trend. If this consolidation is indeed a Wave 4 triangle, Wave 5 may soon emerge with strength.
What to Watch For:
Breakout from the current flag/triangle pattern.
Confirmation via price closing above the Wave B high.
Strong bullish momentum and rising volume as signs Wave 5 is kicking off.
Conclusion
EUR/USD may be gearing up for a Wave 5 breakout, following a classic zigzag correction and potential triangle consolidation. If this pattern breaks to the upside, it could offer a great trend continuation trade opportunity.

XAU/USD Enters Fourth Wave ConsolidationCurrently, XAU/USD appears to have completed the third wave, and the beginning of the fourth wave seems to be underway, indicating the start of a corrective phase. This correction can potentially extend down to the 3118.486 level. In terms of targets, the key levels to watch are 3166.464 and 3117.451 . Following this correction, there is a possibility that the fifth wave may commence.

US yeilds in a corrective rebound In analysis from a few weeks back, we talked about bearish USD and presented a bearish outlook. Since then dollar fall nicely and one of the reason are also lower US yields.
Looking at US yeilds I see bearish impulsive price action down from 4.8%, which could keep the US dollar in a downtrend. What we’ve seen so far is a strong rebound from 3.8%, as shown on the updated 4-hour chart. This rebound suggests that yields are stepping into a correction now, which could unfold as an A-B-C structure. So, it looks like we could see a bit more upside in the near term before US yields turn back to the downside. At the same time, this could mean the US dollar may find some support soon or remain in consolidation a bit longer.
GH

Nifty May have bottomed on News As per Elliott wave sequence it is coming to mind that it has completed a complex correction in the form of WXYZ. Todays bottom is very important and it also related to by the fibs 61.8 level.
For further rally it should cross the 23300 mark in less time then the c leg of z has completed its move downwards...the c leg has completed the move in 24 bars of 15 minutes and it will have cross it before 24bars....! finger crossed...!
No buy sell recommendation. Just a view.

avaxavax technical analysis basically on elliott waves Principles and priceaction strategy
avax can be grow up to 100$
wait and watch.

cakecake technical analysis basically on elliott waves Principles
cake can be make a high on 19$
wait and watch

Chain linklink technical analysis basically on elliott waves Principles and RTM price action strategy
link can be down to 8$ and then grow to 31$
wait and watch.

Bitcoinbitcoin technical analysis basically on elliott waves Principles and priceaction strategy
bitcoin can be down to 50000$ and then grow to 96000$ wait and watch

bitcoinbitcoin technical analysis basically on elliott waves Principles and price action strategy
bitcoin can be down to 50000$ again
wait and watch

BTC Possible SenarioPossible senario for Bitcoin could be completing a Crab Harmonic Pattern which is compatible with Wave III PRZ of a Elliott Waves Pack. then Break out the level $65,700 to $62,385
What do you think?

filfilcoin technical analysis basically on elliott waves
file coin is loading new wave as a wave 3
wait and watch

bomebome technical analysis basically on elliott waves Principles
bome can be make a new wave as a wave 3
wait and watch


pepepepe technical analysis basically on elliott waves principles
It can have a sharp fall, be careful of your capital
wait and watch

avaxavax technical analysis basically on elliott waves Principles
avax can be grow to 128$
wait and watch

pengpeng Technical analysis basically on elliott waves Principles
peng can be make a new high
wait and watch...

polkadotdot Technival analysis basically on elliott waves Principles
dot can be make a new high and i guess it can be 44$
wait and watch

btcbitcoin technical analysis basically on elliott waves principles and priceaction strategies
bitcoin can be make a low on 48000$ and then grow up to 98000$
wait and watch.

SBICARD: Technical Outlook, Breakout & Elliott waves AnalysisCurrent Zoomed view
Daily MACD turned Positive
Trishul Activated in RK-Brahmastra 4Hourly
Breakout
Elliott Wave Analysis of SBICARD (SBICARD)
Overall View
Zoomed View
Overview:
SBICARD has displayed a promising Elliott Wave setup, indicating the potential unfolding of a bullish wave cycle. Recent breakout movements, supported by strong volumes and positive divergences across multiple time frames, suggest a bullish bias. With various technical indicators signaling bullish momentum, the stock appears poised for further upside. However, it's crucial to exercise caution and implement proper risk management strategies.
Detailed Analysis:
Wave Cycle Completion:
On the weekly chart, SBICARD seems to have completed a larger degree wave cycle, consisting of Wave ((1)) and Wave ((2)). This suggests a significant bullish trend underway.
Current Wave Structure:
Presently, the stock appears to be in Wave ((3)), which is typically the strongest and longest wave in Elliott Wave theory.
Within Wave ((3)), we have likely completed one lower degree Wave (1) and Wave (2), indicating the initiation of a new bullish impulse.
Positive Divergences and Breakout:
Multi-time frame positive divergences, combined with a breakout accompanied by substantial volume, support the bullish bias.
Both trend indicators and oscillators across various time frames align with the bullish sentiment, providing further confirmation.
Bullish Signals:
The activation of both Brahmastra and Trishul on the RK-Brahmastra indicator, along with all green signals, indicate strong bullish momentum.
The current price action suggests the unfolding of Wave iii of (i) of ((i)) of 1 of (3), highlighting the potential for significant upward movement.
Price Targets:
If the wave counts align perfectly, SBICARD could target levels near 1050 (Equality of Wave (1)) and 1278 (1.618 Extension of Wave (1)).
Strength above 790 levels could further bolster the bullish outlook.
Risk Management:
It's essential to note the invalidation level at 655 on the lower side. A breach of this level would indicate a potential deviation from the expected wave counts and warrant a reassessment of the bullish scenario.
Traders and investors should prioritize risk management and employ appropriate stop-loss strategies to mitigate potential losses.
Educational Disclaimer:
This analysis is provided for educational purposes only and should not be construed as trading advice or tips. Traders should conduct their own research and consult with financial professionals before making any investment decisions. Proper risk management is crucial in trading, and investors should be aware of the inherent risks involved in the financial markets.
Conclusion:
SBICARD presents an intriguing Elliott Wave setup, indicating the potential for a bullish wave cycle. Positive technical signals, along with strong volume breakout movements, support the bullish bias. However, traders should exercise caution, adhere to risk management principles, and remain vigilant for any changes in the market dynamics.
I am not Sebi registered analyst.
My studies are for educational purpose only.
Please Consult your financial advisor before trading or investing.
I am not responsible for any kinds of your profits and your losses.
Most investors treat trading as a hobby because they have a full-time job doing something else.
However, If you treat trading like a business, it will pay you like a business.
If you treat like a hobby, hobbies don't pay, they cost you...!
Hope this post is helpful to community
Thanks
RK💕
Disclaimer and Risk Warning.
The analysis and discussion provided on in.tradingview.com is intended for educational purposes only and should not be relied upon for trading decisions. RK_Charts is not an investment adviser and the information provided here should not be taken as professional investment advice. Before buying or selling any investments, securities, or precious metals, it is recommended that you conduct your own due diligence. RK_Charts does not share in your profits and will not take responsibility for any losses you may incur. So Please Consult your financial advisor before trading or investing.
