Ripple -Keep an eye on cycles Hello everyone. I hope you had some wonderful days with your family and loved ones over the last two weeks during the Christmas and New Year holidays. Now we are at the start of a new year, which is usually the time when we step back and scan higher degree time frame charts to get a sense of what may happen in 2026, especially by looking at monthly and even yearly structures.
The first market I want to look at is Ripple. As you know, XRP has a lot of upside potential and there is a lot of optimism around this coin, mainly because it was trapped in a very large range for a long time due to the lawsuit filed by the U.S. Securities and Exchange Commission against Ripple Labs back in December 2020. The SEC claimed that XRP was an unregistered security, which created huge legal uncertainty. Many US exchanges delisted or suspended XRP, large funds avoided it, and new capital stayed away. With demand capped, price moved sideways for years.
Now that the market has finally broken to new all time highs, it feels like everyone wants to ride this trend further, and I do think more upside is possible. However, as you know, markets never move in straight lines, and even in strong uptrends we get sharp and sometimes aggressive pullbacks. These large swings, especially when they appear late in a cycle, can offer both opportunities and serious risks.
If you look at the cycle analysis on the monthly chart, it suggests we could already be in the late stages of the current bull run. On top of that, the structure can be interpreted as a fifth wave coming out of a large triangle. This opens the door for another push higher, possibly toward the 4 area, or even higher into the 5 to 6 zone. However, this could also represent a final leg up before the market starts a much larger and higher degree correction.
If we do get one more strong push higher next year, it is important to be very careful. Cryptocurrencies are extremely volatile, and once sentiment shifts, retracements can be deep and fast. If you are already riding this move and are waiting for one more new high, that could very well be the opportunity to take profits, while others are rushing in late.
All the best and good luck catching some nice trades in 2026.
Grega
Elliotwaveanalysis

Bitcoin's next move in the medium term..Given the end of wave three in the microwaves of the main wave, I expect an upward movement until the Fibonacci range is marked, and then it corrects towards the $70,000 to $75,000 range, and after completing the regular flat pattern, we see the beginning of wave five..
The range of $108,000 to $110,000 could be a good place to exit..

BTCUSD Bullish trend 3/1/2026BTCUSD bullish target $150,000, currently the price is starting to look strong with a change from the correction phase to the impulsive phase.
Follow me for more analysis.

UNH – Weekly / Daily Structure | Potential Wave 3 SetupThesis
UNH is working through a corrective phase and attempting to transition into a new impulsive structure, with a potential Wave 3 setup forming.
Context
- Daily timeframes
- Deep corrective move completed (ABC structure visible on higher timeframe)
- Price currently trading below the 200-day moving average
- Long-term trend remains intact on the weekly chart
What I see
- Price has stabilized above the recent lows
- A higher low is in place on the daily chart
- Price is approaching the 50-day moving average, acting as near-term resistance
- Structure suggests a basing phase rather than continuation lower
What matters now
- A clean break and hold above the 50-day MA (~$334) would improve short-term structure
- The key confirmation level remains the 200-day MA ($350 area)
- Until that level is reclaimed, both consolidation and continuation scenarios remain valid
Buy / Accumulation zone
- Current consolidation range above recent lows remains the area of interest
- Risk is defined against the recent base
Targets
- First major structural target sits at the 200-Week MA at $460 area
- If reclaimed 200-Day MA, the larger Wave 3 reference aligns with the 1.618 Fibonacci extension near the $540 area
- Dividend yield remains supportive (~2.6%)
Risk / Invalidation
- Loss of the recent higher low would weaken the reversal thesis and I will start the alternative Wave counting

Gold Prices Fall Due to Profit TakingGold XAUUSD's movement was quite weak during the New York session, likely triggered by weekend profit-taking.
Liquidity was also limited at the end of the week.

BTC: The 15-Year Prophecy (Hosoda Time & The Diagonal)There is a ghost in the machine.
For the last few months, amidst the noise of breakouts and new highs, a specific signal has been flashing a warning that defies the rules of a standard Bull Market. It is a "glitch" in the data—a silence where there should be noise.
Most are ignoring it. Some are confused by it. Today, we are going to try solving it.
Below is the full evolution of the Bitcoin setup, from the Daily traps to the Macro truth, revealing why the "Silence" is actually the loudest signal we have ever seen.
Part 1: The Micro Trap (1D Chart)
Zooming into the daily timeframe, the structure of the decline is textbook. We are currently navigating Wave (4), but the context provided by the previous move is critical.
The "Extended" Wave 3: The drop we just witnessed wasn't a standard correction; it was an impulsive sell-off where Wave 3 was extended. when the third wave extends, it confirming strong momentum in the direction of the trend. The bears are in control.
Current Status (Wave 4): We seem to be in the middle of a Wave (4) relief rally, potentially unfolding as an ABC correction.
Sub-waves 'a' and 'b' appear complete, with 'b' potentially establishing a local higher low.
What's Next: We are likely waiting for Wave 'c' to expand upwards to potentially complete the structure.
The Potential Resistance ($99k): If this structure holds, Wave 'c' might push towards the resistance confluence around $99,323. This area could serve as a ceiling for this corrective phase.
The Downside Risk ($79k): Traders should remain cautious. If Wave (4) finds resistance near $99k, the Elliott Wave guidelines suggest a Wave (5) decline could follow. If that scenario plays out, the market might target the major support zone near $79,000.
Part 2: The Time Anomaly (1W Chart)
While the daily chart showed us the immediate price action, the Weekly chart reveals the true scale of the move. As discussed in previous updates, we are navigating a large-scale Irregular Flat Correction, and we are currently at the tail end of Wave (1) of the 5-wave impulse that makes up the larger C-Wave.
So, the entire impulsive structure we just analyzed on the Daily chart? That was just the first leg of this Weekly move.
☁️ The Ichimoku Signal: Testing "Senkou Span B" Price action has now entered the Ichimoku Cloud (Kumo), a critical zone of turbulence.
The Level: you can see candles trading inside the cloud. We have already tested the bottom support, specifically the Leading Span B (Senkou Span B).
The Forecast: Hitting this level signals that Wave (1) is either ending or has already ended. However, the market rarely makes it easy. I am expecting a potential "False Breakout" below the Cloud to trigger panic, followed by a sharp reclamation. That fake-out would likely mark the bottom of Wave (1) and start of Wave (2).
⏳ The Time Anomaly: Why so fast? There is a strange disconnect in the "Time" dimension of this cycle compared to history (see picture).
2021 Cycle: In the previous bull run, the correction for Wave 1 typically took 70 days to cool the RSI down to 37.
Current Cycle: We have smashed down to an RSI of 35.8 in just 42 days.
The Question: Why is the market correcting nearly twice as fast as before? This "Time Compression" indicates the cycle is moving faster and more violently than we are used to.
The "BBWP Mystery" Finally, look at the BBWP (Volatility) in the below picture. This presents a genuine anomaly. Throughout this cycle, we have seen contractions many times, yet the spectrum never reached the extreme 90% expansion levels. Now, at the very end of the cycle, we are seeing another massive BBWP Contractions.
Why is this happening? Is it just noise, or is this contraction actually telling us the truth?
Part 4: The Truth (6-Month Macro Chart)
Why is the market moving so fast? And what is the "BBWP Signal" we mentioned Before? Look at the 6-Month Logarithmic Chart below.
The Big Picture: Elliott Wave Supercycle on 6M Log Scale
On the logarithmic chart, Bitcoin appears to be wrapping up a massive impulse wave that started from its early days:
Wave (I): Peaked around 2013 (~$1,200 high).
Wave (II): Bottomed in 2015 (~$200 low).
Wave (III): Explosive rally to the 2021 all-time high (~$69,000).
Wave (IV): The 2022 bear market low (~$15,500).
Wave (V): Ongoing since late 2022, but here's the twist—it's unfolding as an ending diagonal (wedge pattern with overlapping subwaves: 1-2-3-4-5).
2.Applying Hosoda Time Theory (Ichimoku Time Theory indicate potential future market turning point).
The vertical lines in the chart are not Fibonacci; they are Hosoda Numbers (9, 13, 17, 21...),
9: Marked the 2023 Bull Run start.
13: Exactly Marked the Jan 2025 Top as end of wave 3, which matches the irregular flat analysis on Weekly chart which states that Cycle top was on Jan 2025.
17 (±1): Matches our projection for the next major pivot—the end of wave IV and the start of the final Wave V run on Jul-2026 or Jan-2027.
The "Mystery": The BBWP Anomaly
BBWP is contracting sharply now on weekly chart—at what feels like the end of the cycle, not the start. This flips the script on historical behavior. Why? I tie it back to the higher-degree Elliott count: The ending diagonal's converging nature naturally squeezes volatility, compressing Bollinger Bands as momentum fades. Instead of signaling a fresh bull, this late-cycle contraction could be foreshadowing a reversal—think trend exhaustion rather than accumulation.
A Possible Explanation: If the macro structure is indeed an Ending Diagonal, then this volatility crunch (BBWP contractions) and the market correcting nearly twice as fast as before makes perfect sense. We would be squeezing into the apex of a 15-year wedge. The market might be running out of "oxygen".
The Verdict: With the 6-Month structure potentially squeezing into a corrective Wave IV, the weight of evidence suggests that the path of least resistance is down. Until the market touches the lower boundary of this diagonal (or invalidates the structure), the only logical macro view is bearish.

Coeur Mining (CDE) Elliott Wave Outlook - Count 1 (4H)Since the previous weekly outlook on NYSE:CDE , price has moved pretty much in line with the expectation, with wave (3) and wave (4) playing out. The pull back in wave (4) was more aggressive and deeper than I would have liked, but wave (2) was fairly flat, so based on the guideline of alternation it does suggest a sharper correction in wave (4), it did run just beyond the 50% fib retracement which is getting a little deep.
In this interpretation I have the chart moving higher in wave (5) with red wave 1 underway. I'll add a caveat, there are alternative wave counts available and should we see an aggressive sell off in silver, then CDE may get hit alongside it. in that scenario this recent up move from $13.55 may instead be a corrective wave, which would mean more consolidation in wave (4), and potentially a break below $13.55 (which is the invalidation level for red 1), unless a triangle pattern forms and we instead go sideways.

BTC to 74k!?All going to plan!
Currently in sub wave 3 of a Wave 5 to the downside - looking for $74k but we’ll see.

Bias Remains Bullish, But Bearish Potential RemainsAlthough Gold recorded a daily correction (into negative territory), the long-term market structure remains constructive. The uptrend remains dominant as long as the price maintains its position above critical support levels.
✅ Key Upward Resistance Levels
If buyers successfully take control after this consolidation phase, the targets are:
- $4,550: All-Time High. This is the nearest psychological and technical hurdle.
- $4,600: A major psychological figure that will become a new long-term target if a record breakout occurs convincingly.
✅ Key Downward Support Levels
If selling pressure continues during this "digestion period," the following levels should be watched:
- $4,430: Initial support (December 23rd low).
- $4,338: Next downside target (December 22nd low).
- $4,300: A psychological round number and the December 17th low.
Conclusion: Technically, Gold is in a healthy correction phase from overbought conditions.
As long as the price doesn't fall below $4,300, the prospect of a rally towards a new record of $4,600 remains wide open, especially if supported by uncertainty regarding the Fed's independence and slow progress in the Ukraine peace process.

BABA – Weekly Structure UpdateThesis
BABA, after multi year base, is completing an intermediate corrective phase within a broader bullish reversal structure.
Context
- Weekly timeframe
- Multi-year base completed
- Price trading above key long-term levels
What I see
- Impulsive advance followed by a controlled pullback
- Structure suggests intermediate wave (4) nearing completion
- Pullback is respecting prior breakout area
- Pullback is holding rising moving-average support
- Consolidation is forming above former resistance
What matters now
- Structure remains constructive while the recent higher low holds
- Resolution of consolidation should define the next directional leg
Buy / Accumulation zone
- Current pullback range aligned with wave (4) retracement
Targets
- Intermediate upside reference near the $230 area

Gold in Final Bullish Wave – Last Push Higher ExpectedGold (XAU/USD 4H) is in a strong bullish trend and is currently moving in the last part of Wave (5). The clear breakout above the previous resistance shows that buyers are in control, and the bullish structure is still valid. As long as the price stays above the main support area, the outlook remains positive, with the next target around 4,580–4,650 , where this upward move is likely to finish. For short-term trades, a sensible stop-loss can be placed below 4,420 , while the bullish view becomes invalid if the price falls below 4,360 . If everything goes as expected, Gold should make one final move higher and then take a normal corrective pullback (A-B-C) after the strong rally.
Stay tuned!
@Money_Dictators
Thank you :)

ETH(based on NEo wave)still I think a heavy bullish wave is coming.you just need to wait for it.
wave G has different scenarios.
you should see the post pattern confirmation on smaller degree.

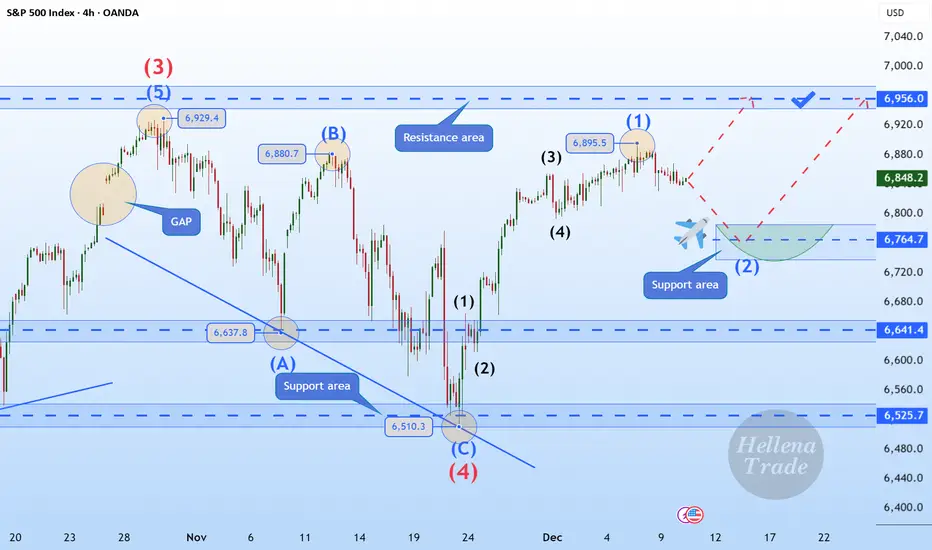
Hellena | SPX500 (4H): LONG to the area of 6956.Hello, colleagues!
I previously published a forecast for an upward movement, and I believe it is time to update the plan slightly. The direction of movement remains the same, but wave “1” has lengthened, which means that the correction in wave “2” may occur slightly higher than previously.
I expect a corrective movement to the support area of 6764, followed by a continuation of the upward movement and an update of the peak level of wave “3” of the higher order 6929 and reaching the area of 6956 at a minimum.
An extension of wave “1” is also possible, but then it will be necessary to slightly revise the wave markings again.
Manage your capital correctly and competently! Only enter trades based on reliable patterns!
DXY Breakdown After Major Top – Wave v in ProgressThe DXY chart shows that the U.S. Dollar has completed a larger corrective structure and is now moving inside a new impulsive bearish phase. After forming a major top near the 110 area, the index started a clear five-wave decline, indicating strong downside momentum. The recent sideways movement looks like a corrective pause (wave iv / Y) rather than a trend reversal. As long as the price stays below the key resistance zone around 100–101, the overall structure remains bearish. This suggests the dollar is preparing for the final wave lower (wave v / 3), which could push the index toward deeper support levels. Overall, the Elliott Wave structure favours continued weakness in the U.S. Dollar in the coming months.
Stay tuned!
@Money_Dictators
Thank you :)

GBP/JPY | Potential for Medium-Term CorrectionGBP/JPY experienced selling pressure for the second consecutive day, trading around 210.50. Despite the correction, the price remains near the 17-year high (211.00) reached last Monday. The market is currently caught in a tug-of-war between the yen, supported by the Bank of Japan's policy stance, and the pound, supported by the Bank of England's cautious stance.
✅ Factors Supporting the Japanese Yen (JPY)
- October BoJ Minutes: The newly released document showed broad agreement among officials to continue raising interest rates if economic forecasts are met.
- 30-Year High: Given that the BoJ just raised interest rates to 0.75% in December and is open to further tightening, the JPY has improved yield appeal.
- Geopolitics: Global uncertainty (Venezuela, Ukraine, the Middle East) continues to fuel safe-haven flows into the yen.
✅ Factors Supporting the British Pound (GBP)
- Hawkish Interest Rate Cut: Although the Bank of England (BoE) cut interest rates to 3.75%, the very tight vote (5-4) suggests the committee is in no rush to ease further.
- Expectation Revision: Investors are now scaling back speculation of aggressive interest rate cuts next year, providing a strong foundation for the GBP.
✅ Technical & Strategy Guide
- Consolidated Sentiment: The current decline is still considered a healthy correction. Strong follow-through selling is needed to confirm that the price has truly peaked in the 211.00 area.
- Thin Volume: Light year-end trading could lead to unexpected volatility or subdued (choppy) price movements.

Hellena | EUR/USD (4H): LONG to resistance area of 1.18000.Colleagues, the price is successfully moving in an upward impulse “12345” in a medium-term wave “3”.
I believe that this week we will see a continuation of the upward movement.
A slight correction to the support area of 1.17049 is possible to complete wave “4”, followed by an update of the local maximum of the lower-order wave “3” and reaching the resistance area of 1.18000.
Manage your capital correctly and competently! Only enter trades based on reliable patterns!

XAG/USD Ends Impulsive Rally, Healthy Correction ExpectedThe Silver daily chart shows a strong five-wave impulsive uptrend that has now completed at the recent high marked as wave 5. This confirms that bullish momentum was strong, especially during wave 3 and the final wave 5 extension. After completing a full impulsive cycle, the market usually enters a corrective phase, and the projected A-B-C correction on the chart fits well with Elliott Wave theory. The first pullback (A) is expected to relieve overbought conditions, followed by a temporary bounce (B), and then a deeper correction (C). This correction would be healthy and normal after such a strong rally. Overall, the larger trend remains bullish, but in the short to medium term, Silver is likely to correct before starting the next major upside move.
Stay tuned!
@Money_Dictators
Thank you :)

NASDAQ100 vs BitcoinCryptocurrencies are still struggling to find strong bullish momentum, despite the rebound in stocks over the last few days after the US unemployment rate jumped and US CPI softened, as reported last week. These are ideal conditions for the Fed to consider more rate cuts in 2026, which explains why the dollar has been moving lower and stocks look more attractive.
Bitcoin, however, is not showing a clear bullish structure yet. If the NASDAQ 100 consolidates a bit longer through the Christmas and New Year holidays, it’s very possible that Bitcoin could retest the recent lows. As usual, we can expect correlations to normalize again later on, possibly in January, when the NASDAQ 100 could finally break higher into wave five. In the meantime, Bitcoin may still be trying to complete five waves down, with the black wave five potentially still unfolding.
Grega

Hellena | Oil (4H): LONG to 50% Fibo lvl (58.00).The structure has broken down. Wave “2” of the middle order should not have updated the minimum of 56,420 of wave “B” of the higher order, but this has happened.
This means that the wave structure will have to be revised.
It seems that the major correction is not yet complete, and in order for the scenario to be completed, impulse “12345” must be completed.
At the moment, I think that the price will begin to form wave “4”.
I expect movement towards the 50% Fibonacci level from wave “3” at 58.00.
The target is not far off, but at the moment we need confirmation of the impulse.
This would mean that the price will update the local minimum, but more on that later.
Manage your capital correctly and competently! Only enter trades based on reliable patterns!

S&P500 Elliott Wave Analysis | SPX | SPY This technical analysis is not financial advice. This is bases on Elliott Wave Theory. SP:SPX

EUR/USD Holding Key Support – Wave 5 Upside in FocusThe EUR/USD chart shows that a larger corrective phase (A-B-C) has already finished, and the market has entered a new bullish impulsive structure. Price has completed Waves 1, 2, and 3, with Wave 3 showing strong upward momentum, which confirms bullish strength. The current pullback looks like a normal Wave 4 correction, and it is holding inside the 0.5–0.618 Fibonacci support zone, which is a common area where Wave 4 usually ends. As long as price stays above the invalidation level near 1.1655, the bullish Elliott Wave structure remains valid. This suggests EUR/USD is preparing for Wave 5, which could push price to new highs in the coming sessions.
Stay tuned!
@Money_Dictators
Thank you :)

GER40 Holds Key Fibonacci Support – Upside Continuation LikelyThe GER40 chart indicates that a larger A-B-C corrective structure has been completed at the recent low, marked as (C), after which the index began a fresh impulsive upward move. From that bottom, price has formed a clean five-wave advance, confirming the start of a new bullish cycle. The recent pullback appears to be a normal Wave 2 correction, which has respected the 0.5–0.618 Fibonacci support zone, a typical area where corrections end. This suggests the correction is likely complete and the market is preparing for Wave 3, which is usually the strongest and fastest upward wave. As long as price holds above the Wave 2 low, the bullish Elliott Wave structure remains valid. Overall, the setup favors continued upside toward higher highs in the coming sessions.
Stay tuned!
@Money_Dictators
Thank you :)

$GOLD -Wave 5 Completed (NATH)- TVC:GOLD and TVC:SILVER prices climbed to new highs in Asian afternoon trading session as Geo-Political tensions escalated.
The Wall Street Journal, citing three U.S. officials, reported that the U.S. Coast Guard was pursuing another oil tanker transporting oil from Venezuela.
This came shortly after the U.S. seized an oil tanker not on its sanctions list. Additionally, on Friday, U.S. forces launched attacks on more than 70 targets in Syria.
