BTCUSD 1D - Pause Before the Next Leg Down?On the 4H chart, Bitcoin is retesting a critical resistance area - the 111K–113K sell zone, where a descending trendline, prior support-turned-resistance, and local volume cluster converge. This confluence makes the current level a potential short-entry area.
After failing to sustain above 115K, BTC entered a corrective phase. The recent bounce looks like a retest of the broken structure, and unless bulls reclaim 113K+, the bias remains bearish with a target near 100K–101K, a key liquidity zone.
Technically, momentum is fading:
– Bearish RSI divergence at recent highs;
– Volume contraction on rallies, expansion on drops;
– Price structure forming a likely ABC correction, with wave C projection toward 100K.
Fundamentally , near-term pressure persists as traders take profits and global risk sentiment cools ahead of potential Fed guidance. However, the macro bull case remains intact - hashrate at all-time highs, growing institutional adoption, and supply tightening continue to underpin long-term support.
Tactical plan: short entries near 111K–113K, targets 100K–101K. Invalidation above 113.5K.
Even in a bull market, gravity never takes a holiday.
Elliotwaveanalysis

Amazon: Break Through ResistanceAmazon shares recently surged decisively above the resistance level at $242.52. This strong rally has pushed the beige wave V significantly higher. For now, we see further upside potential for this move, until the broader wave (V) in blue is complete.

GOLD XAU/USD: Wave ((1)) Near Completion - Wave 2 Zigzag vs Flat GOLD: WAVE ((1)) COMPLETE - WHAT'S NEXT?
Wave ((1)) nearly finished at ~$3,989. Next: Wave ((2)) correction
to the $4,250 area. But which pattern?
━━━━━━━━━━━━━━━━━━━━━━━━━━━━━━━━━━━━
ZIGZAG (60% Probability) Pattern: A-B-C (sharp, V-shaped)
• Wave (A): Sharp 1-2-3-4-5 impulse
• Wave (B): Brief recovery (~30-40% of wave A)
• Wave (C): Sharp impulse (~equal to A or 1.618x A)
━━━━━━━━━━━━━━━━━━━━━━━━━━━━━━━━━━━━
FLAT (40% Probability) Pattern: A-B-C (sideways consolidation)
• Wave (A): Moderate move
• Wave (B): Recovery that reclaims wave A (~80-120% of A)
• Wave (C): Normally sharp 1-2-3-4-5 impulse (~50-120% of A)
If price retraces 100% of wave 1 (above $3,956) Structure INVALID
MY BIAS: ZIGZAG
Wave 1 was powerful → Sharp corrections follow
Support: $3,956 (invalidation level)
Resistance: $4,150 - $4,200 - $4,250
IMPORTANT ELLIOTT WAVE RULES FOR WAVE 2:
━━━━━━━━━━━━━━━━━━━━━━━━━━━━━━━━━━━━━━━━
✓ Wave 2 CANNOT retrace more than 100% of wave 1 (invalidation rule)
✓ Wave 2 CANNOT be a triangle (only B and (iv) can be triangles)
✓ Wave 2 CANNOT be a combination beginning with a zigzag
(combinations only if starting with a flat)
These rules help us eliminate possibilities and confirm structure.

Shib(based on NEo wave)this fox make everybody angry or disappointed.
but the story of this cute fox is in long term it can make up to 1000% profit.
for 1000% profit you need to buy it in the deepest price but I prefer to buy it step by step with demand zones and with post pattern confrimation.

Hellena | Oil (4H): SHORT to support area of 59.00.Colleagues, the situation is complicated, but I still expect the price to renew the local low of 56.40.
It looks like the price is forming a complex compound correction (WXY) and I think that for now it is worth looking at the 59.00 area as the nearest most likely level.
Ideally, I would like to see the completion of wave “C” in the area of 64.80.
Fundamental context
According to the latest IEA report, the global oil market remains under pressure as supply continues to outpace demand. For 2025, production is expected to rise by around 3 million barrels per day, while demand growth is forecast at only 0.7 million barrels. This imbalance increases the risk of oversupply and inventory buildup across key regions.
Manage your capital correctly and competently! Only enter trades based on reliable patterns!

XRPUSD correction completedinitially thought that more upwards correction was false. i thought this was and impulse (Grey box) but it turns out its and abc, hence the impulse moving down

BTCUSD more bearish impulsesabc completed, more bearish downtrend as impulse.
the abc correction to wave 2 is completed since the price have broken down initial of the correction

Microsoft: Wave X Top Confirmed! As primarily anticipated, Microsoft shares recently reached the high of turquoise wave X just below resistance at $562.17 before quickly reversing lower. This decline, part of the same-colored wave Y, is likely to bottom within our magenta long Target Zone between $477.87 and $451.84, where we also expect the low of magenta wave (4). In our view, this range presents attractive opportunities for long positions, as we anticipate a renewed upward move during magenta wave (5) to follow. This rally should push price above the $562.17 resistance and complete the larger blue wave (I). Alternatively, we see a scenario in which the high at $562.17 marked only the end of beige wave alt.III (probability: 36%). In this case, a drop below the $392.97 support would be expected to form the low of wave alt.IV.

triangle wave correctionin H1, already making double abc , the ao divergence indicates it might go further up, possibly making triangle wave ABCDE correction with 3 waves structure as per chart.

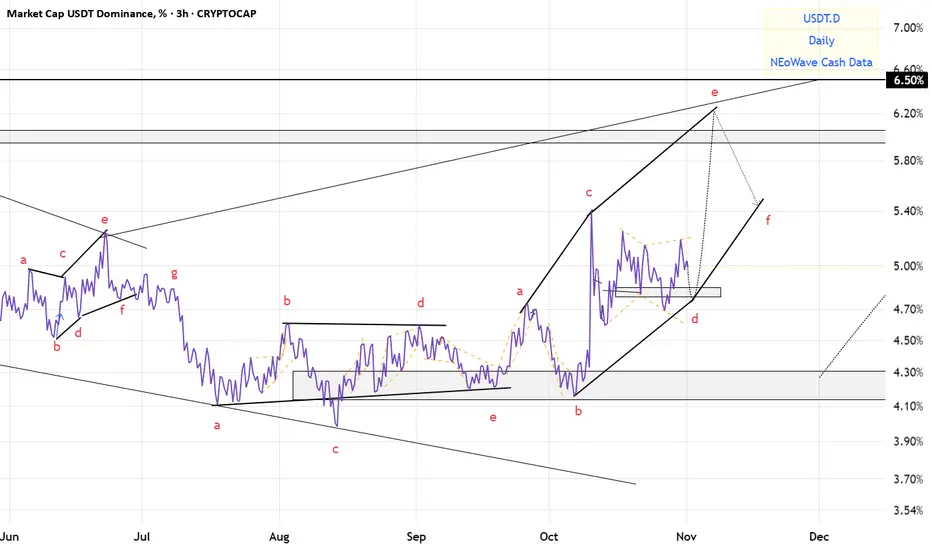
USDT.D(based on NEo wave)after this long trading range I think its time to change my counting and its not a triangle.
crypto market will see lower prices and it will continue for 1 month.
BTC retrace to. wave 2 to move further downsouthwe see that the micro abc wave. have completed (in red)
and then a steady bearish impulse and based on the divergence and the internal count this is wave 1 micro (in red) therefore the upwards movement is basically an abc retracement to micro wave 2.
as per chart

S&P500: Rising?S&P 500 futures edged slightly lower in yesterday’s session but are expected to remain within the upward trajectory of magenta wave (5), which, under our primary scenario, is likely to continue moving higher. This advance would also complete the larger blue wave (III). Afterward, we anticipate a corrective phase in magenta wave (A), which should put renewed pressure on the index. At the same time, we are monitoring our alternative scenario, which suggests that magenta wave alt.(3) has not yet concluded. If prices drop below the support level at 6,371 points, this scenario will come into play. In that case, wave alt.(4) would likely extend further downward, reaching its low within the magenta alternative Target Zone between 6,055 and 5,822 points (probability: 30%).

CORRECTION ON ETHmy take on ETH H1,
possibly a complex correction before turning down to minuette c as impulse. wil monitor tomorrow

Hellena | SPX500 (4H): LONG to resistance area of 7000.Colleagues, I believe that the upward movement is not over yet and at the moment the formation of wave “3” is taking place, but the chart shows a gap that should be closed.
Therefore, I believe that the price can go into correction of the small wave “4” to the area of 6823, but the priority is still the upward movement, as I believe to the resistance area of 7000.
Fundamental context
U.S. business activity strengthened in October: the S&P Global PMI rose to 54.8, indicating expansion in both manufacturing and services sectors.
However, uncertainty persists — business sentiment and export performance have weakened, while the partial government shutdown limits data visibility.
At the same time, the Federal Reserve is expected to continue rate cuts as the economy shows signs of slowing.
Manage your capital correctly and competently! Only enter trades based on reliable patterns!

Honeywell: Upward?The previously defined Target Zone was clearly breached to the upside, so we have now deactivated and grayed out that zone. The stock is currently in a downward move, which we interpret as a corrective pullback within green wave . We expect this move to conclude above the resistance level at $250.20. However, if price continues to fall and drops below support at $168.99, our alternative scenario will be triggered. In that case, green wave alt. would already be complete, and price would be in green wave alt. (probability: 33%).

NVIDIA At New HighsNvidia is making more upside this week, now trading above the 200 level on optimism that the US and China could reach a tariff deal. From an Elliott Wave perspective, the stock still appears to be in wave five, with an extended higher-degree black wave three now approaching its first resistance around the 38.2% projection. If risk-on sentiment continues, the price may even retest the upper side of the Elliott Wave channel near the 230 area. This suggests that Nvidia could be entering an important zone where the higher-degree black wave three might complete, followed later by a deeper fourth-wave retracement before more upside resumes. So, I would stay patient and watch for a possible dip toward the 164–185 area once wave four begins.
Highlights:
Trend: Ongoing uptrend; wave five still in progress
Potential: Reaching 230 resistance before wave four pullback
Support: 164–185 zone
Invalidation: Below 164
Note: Watch for signs of exhaustion near 230; next deep could offer new opportunity

Hellena | EUR/USD (4H): SHORT to the support area 1.15419.The situation is quite interesting. I would not like to recommend selling, but judging by the waves, the price should update the minimum of 1.15419 and complete the wave "C" of higher order near the level of 1.15000.
Then the triangle (ABCDE) will continue to develop. And as much as I don't want to, I will insist that the price will continue the downward movement at least to the support area of 1.15419.
Fundamental context
The dollar continues to be under pressure - markets are increasingly laying expectations of a soon Fed rate cut due to signs of a slowdown in the US economy. At the same time, the euro is receiving moderate support due to stability in the eurozone and investors' interest in alternative assets outside the dollar.
In fact, this may lead to some sideways movement, which will be expressed in the triangle (ABCDE).
Manage your capital correctly and competently! Only enter trades based on reliable patterns!

Adobe: Entering the Fourth Wave — Smart Money Distribution PhaseAdobe’s stock is entering a critical structural phase — the completion of its third global impulse and the start of the fourth corrective wave.
While the long-term uptrend remains intact, the price structure and fundamentals suggest that the most explosive growth period may already be behind us.
🧭 Long-Term Technical Context
Looking back to the early 2000s, Adobe has moved through a textbook Elliott Wave structure.
The first and second waves built the base, while the third wave delivered the explosive rally — from roughly $30 to $600, marking a 20x increase.
Now, the fourth subwave of the third major wave appears to be forming — a phase typically characterized by sideways consolidation and distribution by institutional players.
🔺 Wave 4 Triangle Formation
In many long-term wave structures, the fourth wave forms a triangle (ABCDE pattern) — a contracting structure where price oscillates between defined boundaries.
We can already observe the emerging shape:
Wave A and B are complete
Wave C is in progress
Wave D and E will likely complete the pattern before the final breakout
Once the triangle ends, a final Wave 5 push could occur — potentially extending toward $700, or in an extended scenario, even $2000.
📊 Trading Range and Short-Term Strategy
At this stage, smart money tends to distribute positions gradually.
The price is oscillating within a broad corridor, providing opportunities for range-based trading:
Buy zones: near the triangle lows (Wave A area around $350)
Profit zones: near the triangle highs (Wave B area around $600)
For swing traders, this range offers multiple short-term opportunities before the next major move begins.
💵 Fundamental Context
Despite being in a late-wave structure, Adobe’s fundamentals remain strong.
Share buybacks: The company continues to repurchase its own shares, supporting EPS growth.
EPS trend: Rising steadily year over year.
Revenue growth: Stable, around +10% YoY, with quarterly metrics showing +40% growth since Q1 2024.
Forward P/E: Approximately 28, which, by Peter Lynch’s growth-to-PE logic, still appears reasonably valued.
These metrics suggest that even in a market downturn, Adobe’s downside risk may be more limited compared to weaker tech peers.
🧮 Fundamental Summary
✅ Consistent buybacks supporting EPS
✅ Double-digit annual revenue growth
✅ Attractive valuation relative to growth metrics
✅ Strong defensive profile versus the broader tech sector
There are no visible signs of fundamental weakness — only technical consolidation after years of exponential expansion.
⚠️ Alternative Scenario
If the stock breaks below $270, the current wave structure may need adjustment.
Such a move could imply a larger triangle or a flat correction, but the broader interpretation — that we’re inside a long-term Wave 4 — would remain valid.
📈 Market Outlook
Adobe is transitioning from a high-momentum growth phase into a strategic accumulation and distribution phase.
The stock is unlikely to replicate its earlier explosive rally, but it continues to offer structured trading opportunities inside a stable technical range.
For long-term investors, the risk-reward remains balanced, supported by solid fundamentals.
For traders, the triangle provides a clear framework: buy near lows, take profits near highs, and wait for the fifth wave breakout.
🧩 Summary
Price structure suggests Wave 4 triangle formation
Trading range between $350–$600
Fundamentals remain strong and defensive
Forward P/E at 28 — reasonable given EPS growth
Next major target: Wave 5 breakout toward $700–$2000
Adobe is no longer in its most explosive phase — but it’s far from weak.
This is a mature consolidation period, not a decline story.
For disciplined traders, the triangle may offer some of the cleanest swing setups in the tech sector.

SUI: SlippedSUI recently faced renewed pressure but is expected to recover soon. The magenta wave is likely to extend slightly further toward resistance at $4.57, where we anticipate this wave will peak. Afterward, a short-term correction in wave is likely before wave should drive price sustainably above the $4.57 level. A lower bottom would only become likely if support at $0.55 is breached. In that scenario, an alternative wave alt.B in turquoise would come into play, which we currently estimate has a 37% probability.

LINK: Shows Upward Momentum LINK has recently shown modest upward momentum. Under our primary scenario, we anticipate that turquoise wave 1 will push price above the resistance level at $30.95, followed by a corrective wave 2. However, if price continues to decline and falls below support at $8.25, we will expect a new wave alt.(B) low in magenta to form within our similarly colored alternative Target Zone ranging from $7.04 to $2.12 (probability: 37%).

FinVolution Group (FINV) - A Quiet Giant on the Edge of Breakout⚡ FinVolution Group (FINV) — A Quiet Giant on the Edge of Breakout
While everyone is chasing the inflated Big Tech bubble, a much quieter — and potentially far more explosive — opportunity is forming right now in the fintech and online lending space.
That opportunity is FinVolution Group (FINV) — a Chinese and Southeast Asian fintech player that looks ready to break through its 2021 highs. Once that breakout happens, the move could be massive.
🔸 Fundamentals
FinVolution has quietly turned a corner.
Recent quarters have been consistently profitable — both revenue and EPS are growing.
The most striking part?
The forward P/E ratio is just 0.7 — yes, less than one.
That’s an extraordinary valuation for a profitable fintech with expanding operations across multiple Asian markets.
It’s a risky play, no doubt, but these are exactly the kind of setups that tend to drive portfolio growth over time: low valuation, improving financials, and clear technical breakout potential.
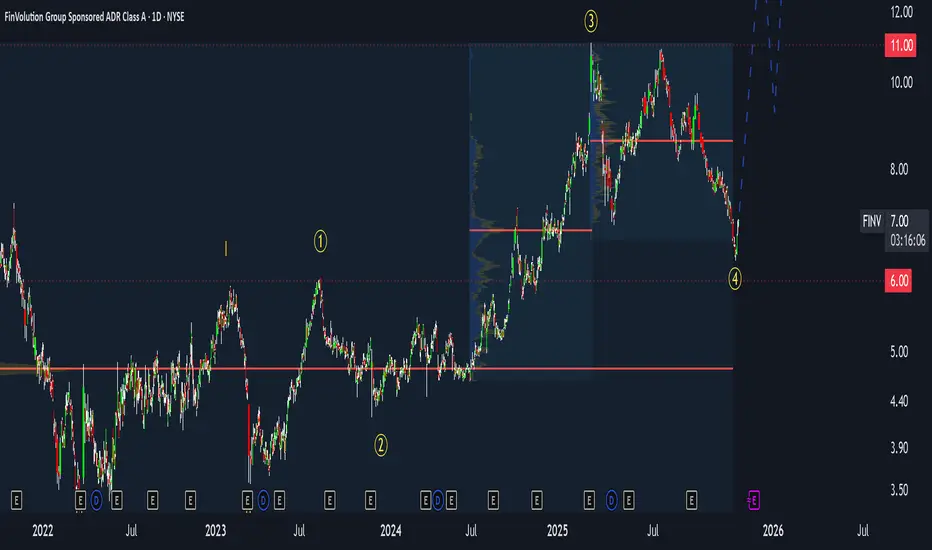
🔸 Technical Picture
From a technical perspective, FINV is at the start of what looks like the third major wave of its long-term structure.
Since 2021, the price has been consolidating sideways — but that phase seems to be ending now.
Key resistance: $11
Current price: around $7
Breakout level: above $11 (with volume confirmation)
First targets: $20 → $30 → $40
If the price breaks below $6, the bullish scenario pauses — it doesn’t collapse, but likely extends the sideways phase.
That sets up a risk of roughly 10–15%, while the potential upside remains multiple times higher.
The risk/reward profile here is exceptionally strong.
🔸 My Strategy
I’m already positioned - entered near $7, with a stop-loss around $6.
Once we approach $11, I plan to take partial profits and watch for a breakout confirmation.
If we get a strong breakout above $11 with solid volume, that’s my next entry trigger.
Then I’ll look to add on pullbacks, applying my call stacking strategy - building exposure gradually as the trend confirms and accelerates.
🚀 Summary
FinVolution (FINV) shows a rare combination:
✅ Profitable growth
✅ Deep undervaluation
✅ Strong breakout setup
It’s one of those asymmetric opportunities — where the downside is limited, but the upside could multiply several times over.
If the $11 breakout confirms, this could easily become one of the most powerful fintech moves of the next few quarters.
⚡ Call to Action
If you like this type of setup - low-risk, high-upside plays - tap 🚀 to support the idea,
and drop a comment with tickers you’d like me to review next.
(Full technical breakdown and strategy details are discussed in my latest videos — available via my profile.)
XAUUSD 1H – EW Long SetupHi fellow traders,
On the 1H XAUUSD chart, I am applying Elliott Wave principles to outline a potential long setup. Price seems to have completed wave 4 and is reacting from the golden box area, suggesting that wave 5 may now start unfolding to the upside.
The invalidation level at 4004.72 represents my expected end of the correction, although the setup remains valid even if price moves slightly lower. My Stop Loss is set at 3940.00, which would confirm structural failure if reached. The Take Profit is positioned at 4437.36, targeting the projected completion of wave 5.
Good luck and trade safe!

Gold Elliott Wave Analysis – Potential Wave (4) Completion ZoneGold (XAU/USD) on the daily chart appears to be completing a classic Elliott Wave 5-wave impulse structure. After a strong rally into the wave (3) high, price is currently retracing toward the projected wave (4) correction zone.
The highlighted support area aligns with key Fibonacci retracement levels:
0.5 retracement: around $3,845
0.618 retracement: around $3,718
This region also coincides with the lower boundary of the ascending channel, adding confluence for potential bullish reversal.
If wave (4) finds support within this zone and maintains structure, a new impulsive rally toward wave (5) could begin — targeting the upper trendline resistance near $4,500–$4,600.
