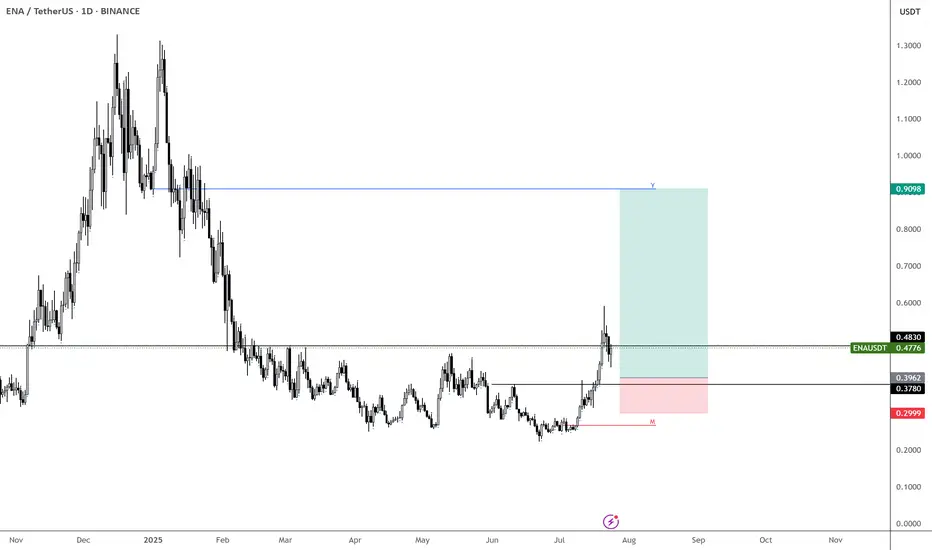
ENAUSDT Analyses-63, October 3, 2026
Welcome to my page! I share daily technical analyses of crypto and other charts here.
BINANCE:ENAUSDT
🔍 Market Structure Analysis:
ENA remains bearish overall on the 1H chart, but price is reacting from the 0.2320 support area and showing a short-term bullish recovery.
🎯 Entry & Exit Signal:
Buy Entry: 0.2343
Stop Loss: 0.2300
Targets: 0.2429 R/R:2 - 0.2500 - 0.2636 - 0.2740 - 0.2940
Key Support & Resistance:
Key Resistance: 0.2420 / 0.2500 / 0.2636 / 0.2740 / 0.2940
Key Support A
Enacrypto
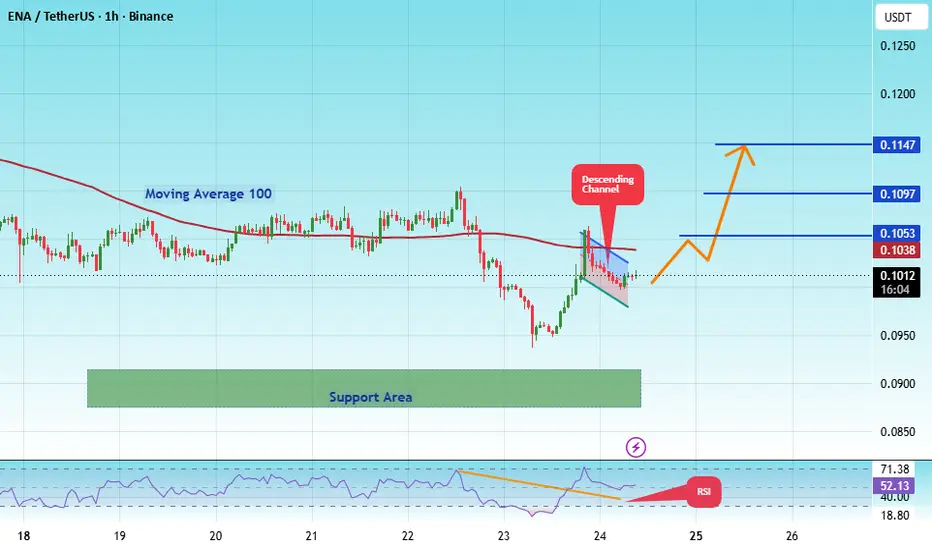
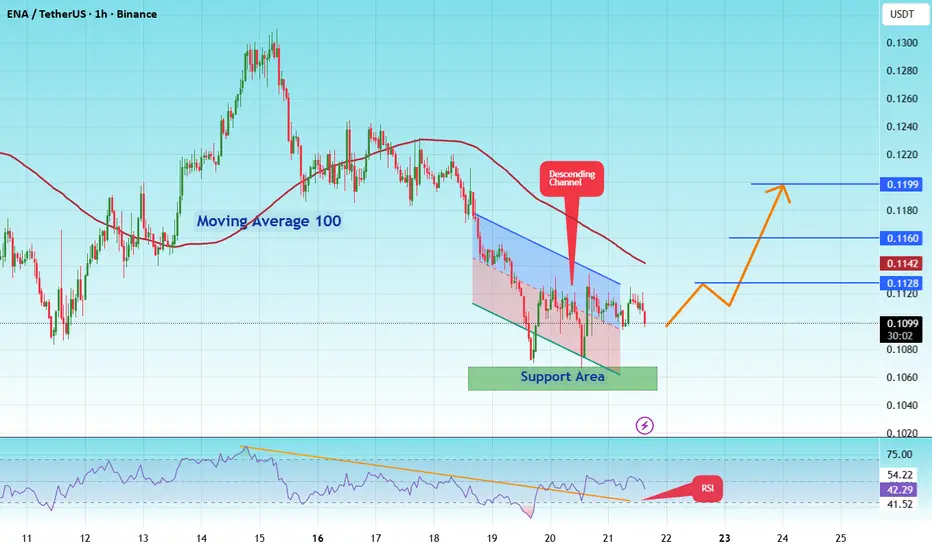
#ENAUSDT Ready for a Breakout? Analysis of a Long Accumulatio#ENA
The price is moving within a descending channel on the 1-hour timeframe and has reached the lower boundary. It is now poised for a bounce and is expected to retest this boundary.
The Relative Strength Index (RSI) indicates a downward trend, which is likely to continue given the overbought conditions.
A key support zone (in green) has been identified at 0.1433. The price has bounced off this zone several times, making it a strong support level.
The price is trending towards the 100-perio
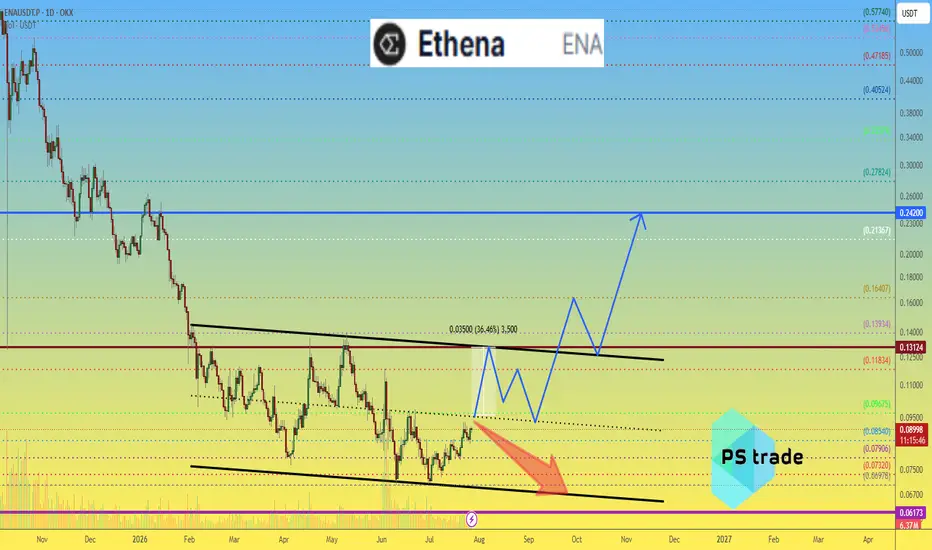
Ethena ENA price analysisFor the past six months, OKX:ENAUSDT has been trading inside a very wide consolidation range of roughly 100%. Put simply, the market has been slowly moving the price back and forth between $0.07 and $0.14.
Then again... what's the rush? 🙂 Even at what many would call the "bottom" of the range, #Ethena still carries a market capitalization of more than $800 million, with over 60% of the total supply already unlocked. It takes time for the market to properly absorb and redistribute that many to
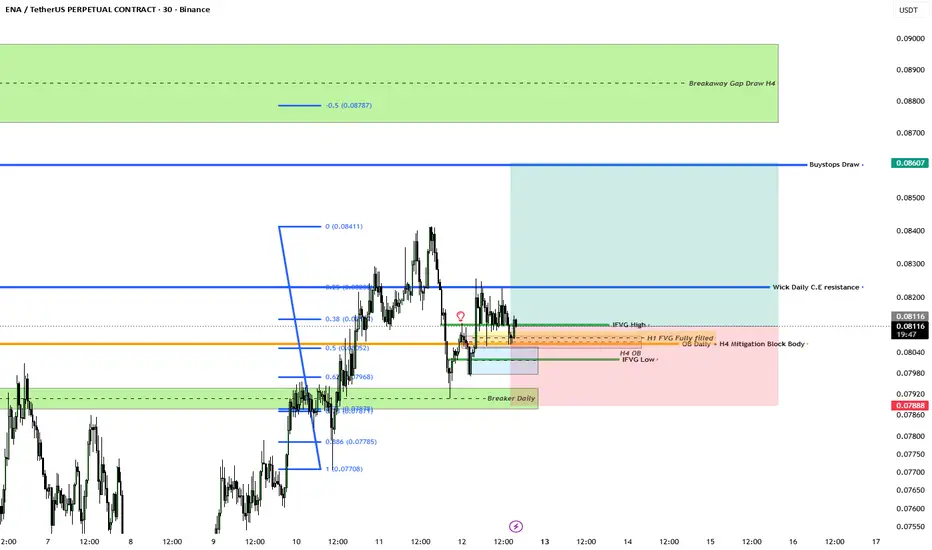
LONG IDEA ENA - ETHENA1. Price has dipped to the OTE and below the 50%
2. Price broke structure after tapping the Breaker Daily
3. Price closing above the IFVG low and high is high probability long signature since we are at discount
4. H4 OB + H1 Fully filled fvg might propel price higher
5. Wick Daily C.E resistance will other wise be inverted to become support later (if the bullish idea w is respected)
6. Buystops draw + H4 Breakway gap are very strong draws
Is the current stablecoin narrative - can it help push
ENAUSDT - Descending Trendline, Breakout or Rejection?ENAUSDT on the 2-Day timeframe remains in a medium-to-long-term downtrend, characterized by a Descending Trendline that has been suppressing price action since the September 2025 peak.
However, price is now approaching the apex of the trendline and showing signs of consolidation around a major support zone. This type of structure often represents an accumulation phase before the next significant move.
As long as the trendline remains unbroken, the overall market structure stays bearish. Nevert
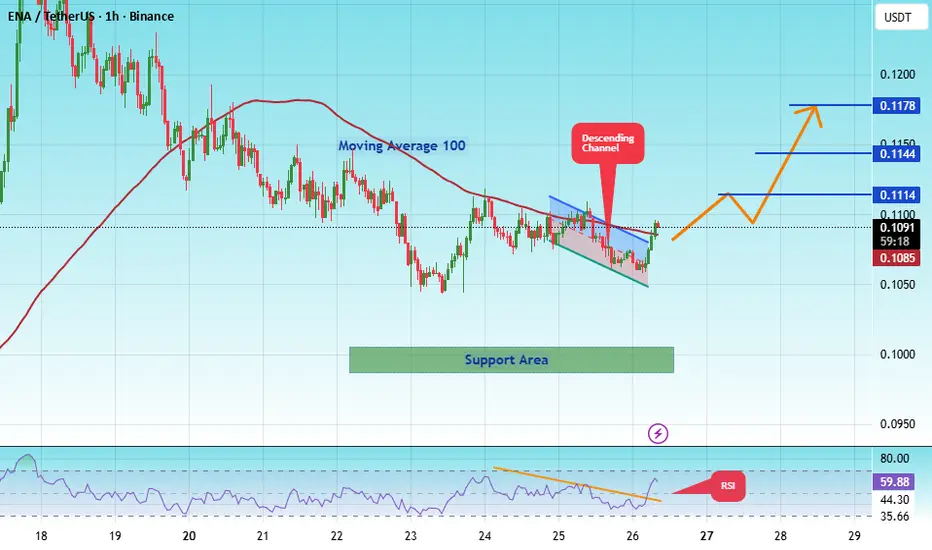
#ENAUSDT Ready for a Breakout? Analysis of a Long Accumulatio#ENA
The price is moving within a descending channel on the 1-hour timeframe and has reached the lower boundary. It is now poised for a bounce and is expected to retest this boundary.
The Relative Strength Index (RSI) indicates a downward trend, which is likely to continue given the overbought conditions.
There is a key support zone in green at 0.0582. The price has bounced off this zone several times, making it a strong support level.
The price is trending towards the 100-period moving aver
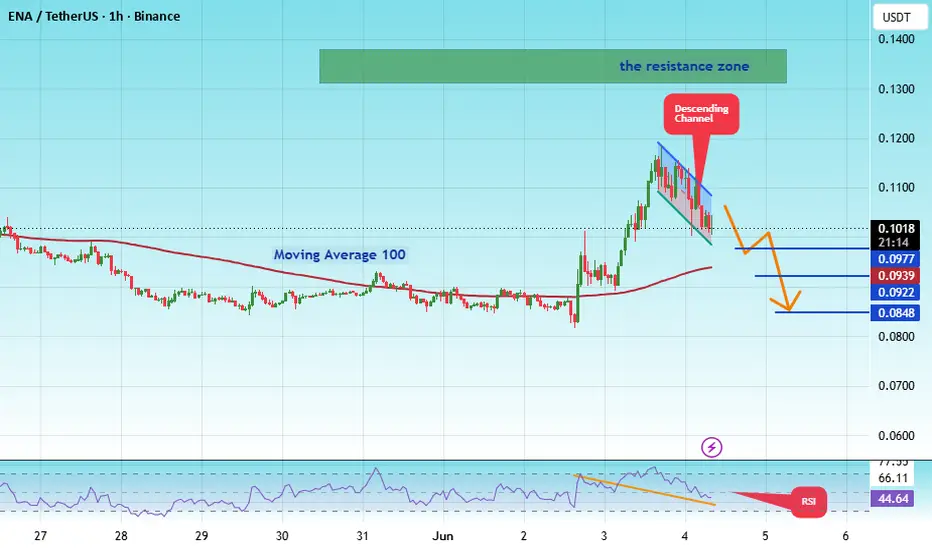
#ENAUSDT may continue its trend after correction#ENA
The price is moving within a descending channel on the 1-hour timeframe and has reached the lower boundary, heading towards a breakout. A retest of this boundary is expected.
The Relative Strength Index (RSI) indicates a downward trend, and this trend is likely to continue due to the overbought condition.
There is a key resistance zone (in green) at 0.1380, which the price has bounced off several times, making it a strong support level.
A consolidation trend is observed above the 100-pe
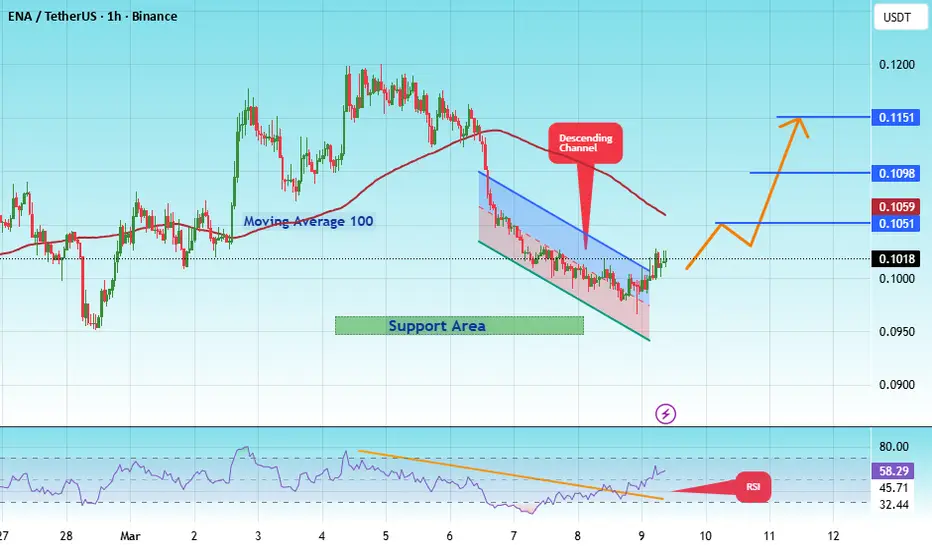
#ENAUSDT Ready for a Breakout? Analysis of a Long Accumulatio#ENA
The price is moving within a descending channel on the 1-hour timeframe and has reached the lower boundary. It is now poised for a bounce and is expected to retest this boundary.
The Relative Strength Index (RSI) indicates a downward trend, which is likely to continue given the overbought conditions.
There is a key support zone (in green) at 0.0880. The price has bounced off this zone several times, making it a strong support level.
The price is trending towards the 100-period moving av
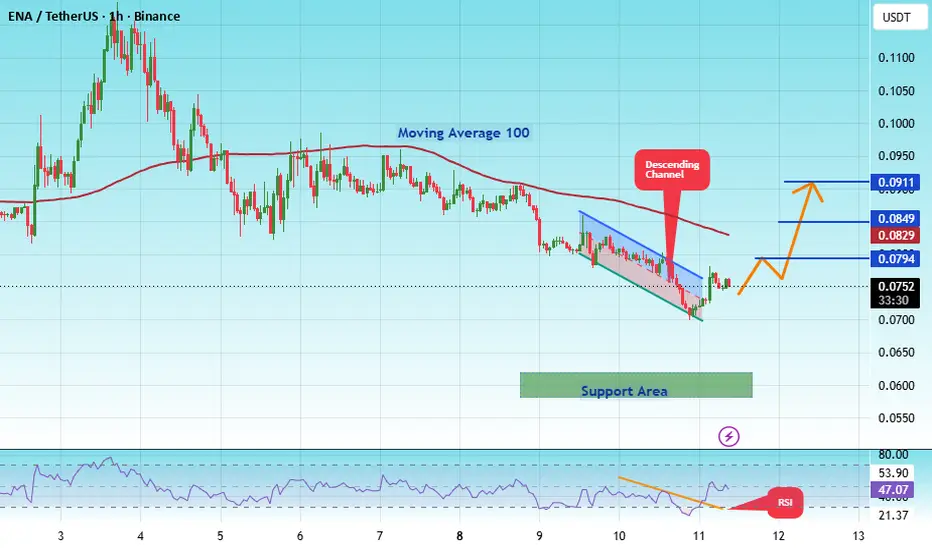
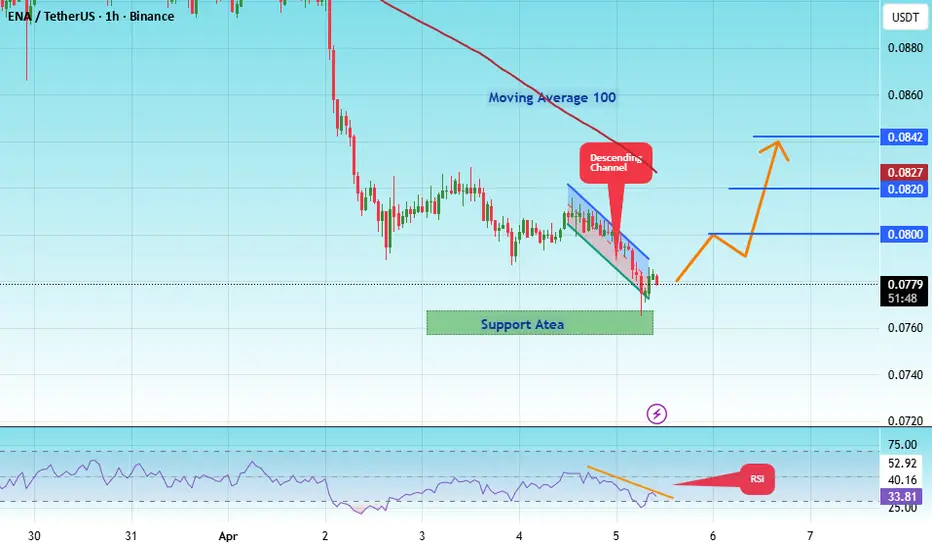
#ENAUSDT Ready for a Breakout? Analysis of a Long Accumulatio#ENA
The price is moving within a descending channel on the 1-hour timeframe and has reached the lower boundary. It is now poised for a bounce and is expected to retest this boundary.
The Relative Strength Index (RSI) indicates a downward trend, which is likely to continue given the overbought conditions.
There is a key support zone (in green) at 0.0775. The price has bounced off this zone several times, making it a strong support level.
The price is trending towards the 100-period moving av
ENA IS ABOUT TO TRAP EVERYONE AGAIN?Yello, are you ready for the next major move on ENA, or will you get caught on the wrong side of this classic Wyckoff setup?
💎#ENAUSDT is clearly developing a structured Wyckoff accumulation pattern, and the recent price action is now approaching a critical decision point that will define the next macro move.
💎We can already identify the key phases of the accumulation. The initial selling climax marked the point where panic selling reached exhaustion, followed by an automatic rally that confir
#ENAUSDT setting up for its next leg higher.#ENA
The price is moving within a descending channel on the 1-hour timeframe and has reached the lower boundary. It is now poised for a bounce and is expected to retest this boundary.
The Relative Strength Index (RSI) indicates a downward trend, which is likely to continue given the overbought conditions.
There is a key support zone (in green) at 0.0987. The price has bounced off this zone several times, making it a strong support level.
The price is trending towards the 100-period moving av
#ENAUSDT setting up for its next leg higher.#ENA
The price is moving within a descending channel on the hourly timeframe. It has reached the lower boundary and is trending towards a bounce. A retest of this boundary is expected.
The Relative Strength Index (RSI) indicates a downward trend, and this trend is likely to continue due to the overbought condition.
There is a key support zone in green at 0.0758. The price has bounced off this zone several times, making it a strong support level.
The price is trending towards the 100-period m
#ENA/USDT setting up for its next leg higher.#ENA
The price is moving within a descending channel on the hourly timeframe. It has reached the lower boundary and is trending towards a bounce. A retest of this boundary is expected.
The Relative Strength Index (RSI) indicates a downward trend, and this trend is likely to continue due to the overbought condition.
A key support zone (in green) was found at 0.0900, and the price has bounced off this zone several times, making it a strong support level.
The price is trending towards the 100-p
#ENA/USDT setting up for its next leg higher.#ENA
The price is moving within a descending channel on the hourly timeframe. It has reached the lower boundary and is trending towards a bounce. A retest of this boundary is expected.
The Relative Strength Index (RSI) indicates a downward trend, and this trend is likely to continue due to the overbought condition.
There is a key support zone in green at 0.0956, and the price has bounced off this zone several times, making it a strong support level.
The price is trending towards the 100-peri
#ENA/USDT setting up for its next leg higher.#ENA
The price is moving within a descending channel on the hourly timeframe. It has reached the lower boundary and is heading towards breaking it. A retest of this boundary is expected.
The Relative Strength Index (RSI) is showing a downward trend, moving in a downtrend and likely to continue due to overbought conditions.
There is a key resistance zone in green at 0.1050. The price has bounced off this zone several times, making it a strong support level.
A consolidation trend is observed a
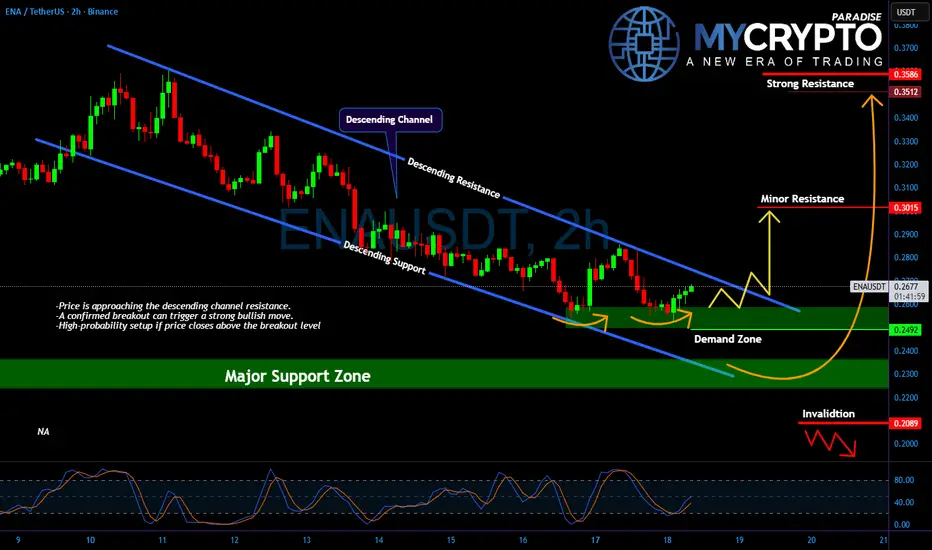
ENA About to Explode? Yello Paradisers, is ENA quietly building up pressure for a major breakout while everyone else is hypnotized by Bitcoin’s sideways snoozefest?
💎While the crypto herd remains laser-focused on BTCUSDT, #ENAUSDT is showing signs of life and potentially setting up a stealth move that could catch most traders completely off guard.
💎Price action has been respecting a clean descending channel, with repeated rejections at the upper resistance and strong bounces off the lower boundary. #ENA has now bou
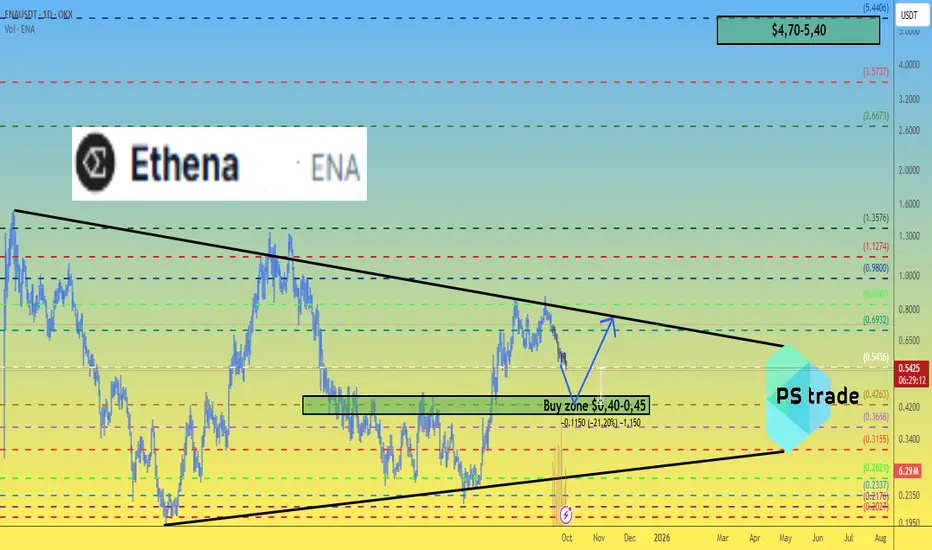
Ethena ENA price analysis🔗 #Ethena ( #ENA ) is part of the #Ethereum ecosystem and looks fundamentally strong.
⏳ The current OKX:ENAUSDT consolidation strongly resembles CRYPTOCAP:ETH phases before major rallies.
🛡️ Key support: $0.40–0.45 — buyers need to hold this level.
📈 If successful, there’s potential for a 10x growth, with market cap rising from $3B to $30B — realistic in today’s market.
📊 Conclusion: this support zone is crucial for ENA’s future trend.
🤔 Do you believe Ethena can repeat Ethereum’s story
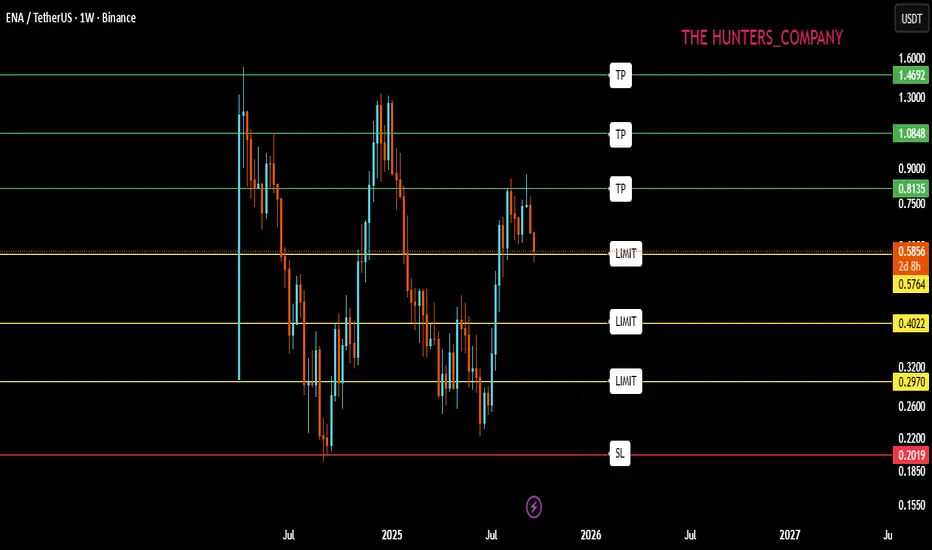
BUY AND HOLDHello friends
Given the potential and good support that this currency has and the power of buyers, now that the price has corrected, you can buy in stages with capital and risk management and move with it to the specified goals.
Note that the holding period is at least 3 months, so be patient and observe capital management.
*Trade safely with us*
ENA Swing Setup + Investment IdeaEna showed some Great Strength, we took it from 0.30 and sold at 0.66 n 0.80. Now wait for the Monthly + Weekly level to reach n show some reaction, and then Buy. for spot traders keep buying from 0.55 , 0.45 , 0.40 and wait for the Uptober Bull Run specially for alts. Will update the trade, if ena doesn't reach to those levels.
#ENA/USDT - BEARISH CORRECTION AWAITED?#ENA
The price is moving within a descending channel on the 1-hour frame, adhering well to it, and is heading for a strong breakout and retest.
We have a bearish trend on the RSI indicator that is about to be broken and retested, which supports the upward breakout.
There is a major support area in green at 6900, which represents a strong support point.
We are heading for consolidation above the 100 moving average.
Entry price: 0.7040
First target: 0.7070
Second target: 0.7150
Third target:
ENA – Sub-40c Would Be a Gift
If we get BINANCE:ENAUSDT below 40c, that would be an incredible opportunity.
Maybe I’m being too greedy—or maybe not. I’ll let the market decide.
Right now, ENA looks like a solid play for the coming weeks, so I’m focused on finding the best possible entry.
MARKETSCOM:ETHEREUM still looks strong overall. Even with a minor retrace, I’m expecting higher—potentially up to $7k.
So it makes sense to position in names like BINANCE:ENAUSDT , BINANCE:EIGENUSDT , BINANCE:AAVEUSDT , and othe