Elliott Wave - Revenge"A man who desires revenge should dig two graves"
Back at September 10th we were optimistic about BTCUSD as it shown some volume , force, fractals and an Elliott counting that indicated a possible bullish reversal with higher lows since June 29.
As trend-based fib-extensions shown on previous TA, BTC price bounced a lot on 0.382 range on the last 3 bullish rally's and we concluded that this would be tested once again near 6780. Well it did tested, but could not break up.
The scenario became grim as the dim light revealed to be a trap of an abyss predator by September 22th. And the trend-based fib-extensions by the reason of 3 marked not a rally to 10k, but a dive into 4k monster belly.
As trend-based fib-extensions shown, 0.382 range have its importance on this bear market. That can also be seen by current POC. Also the reason of 3
from previous legs corroborate an ending diagonal.
Thanks for your attention, please comment.
Ending Diagonal

Bullish Countbased on the above count, the long-term trend remains bullish, either wave (3) or wave (C) rally is under way

BITCOIN Will Fall Now - But NOT So Much As You Think! See here!Dear Friends
We are still following my top trending post from yesterday - I will hopefully now proof to you, that we with our Elliott Waves can continue my forecast.
We will fall down now and hit my blue box - hereafter we will go up below 5,000 USD again for hereafter and say hello to 3,XXX again, which will be the last 11 structure wave correction.
Hopefully we can hereafter start a new uptrend. Let's see!
D4 Love You <3
PS. Please leave a LIKE if you appreciate the content.

Crude looks to have more downside remaining (Elliott Wave)Crude : 1H : Updated : Looks like more downside is remaining in this market. From a short term perspective either Wave 3 is complete or still continuing.
If still continuing then we should see more down move from here as an Ending Diagonal.
If Wave 3 is already complete then we expect sort of Flat formation for Wave 4 as represented by the Red arrows.Strategy : From an Intraday perspective if we see Wave 4 continuation as a Flat then we will look for selling this market for Wave 5 down, however if we see an Ending Diagonal continuation then we will wait for completion of the same to trade longs.

Are we at a top on Coca Cola?Short term have been trading this up as the patterns have been nice for small bullish moves. Now we're at the top of the weekly ascending channel/wedge/expanding diagonal & have had many waves of bearish divergence with no real breakout to the upside for over 6 years. This is the time to start looking for sell setups (one is presenting itself on the 15 min) That setup will be in the comments!
Structurally this can have a big downside. Will it happen? Who knows, if it happens... id like to be in the trade.
What are your opinions!?
Trade responsibly and thanks for looking!

USDJPYWe are at a critical juncture for this pair, and, from an Elliot Wave perspective we can expect a sharp and deep decline.

Ending diagonal on DOW - expecting final wave 5 up!DOW is in an interesting point as it has been in a bull market for some years now and time for a reversal/correction is certainly due - but not without a last push up by the giant index.
As shown in the chart, we've seen a series of 3 wave moves in a consolidation of sorts and this generally indicates that the move is either an ending diagonal or triangle as prescribed using Elliot Wave theory.
With that said, I am expecting a 3 wave move to reach a new high before a sharp reversal.
Watch the space!!!

Do I see an #Ending5thWaveDiagonal for #Bitcoin | $BTC? YESSSS!!Do I see an #Ending5thWaveDiagonal for #Bitcoin | $BTC? YESSSS!!

Eur/Nzd DailyEN looks to have turned a running flat into an ending diagonal. It has turned down on the weekly and the daily.

Possible Ending Diagonal in SPX (Elliott Wave)Hypo 1(Yellow) : If this market goes above 2942 then that would mean that W.v of W.iii) is continuing as an Ending Diagonal.
Hypo 2 (Cyan) : On the other hand if we see a break below the Cyan channel straight from here then that would mean that we are in a W.iv) Flat type of correction.In case of H1, we will look for the Ending Diagonal to complete and then go short, in case of H2 the best strategy would be to wait for the completion of W.iv) and then go long for W.v)

Bullish BreakoutPrice has already broken the (B)-(D) trend line, I think the blue primary wave 5 is likely under way

Eur/Zar Potential Complex "B" waveIf you did not already get the first sell level I posted, or if you are in it... Watch out for an ending diagonal which would measure out perfectly to the 1.236 extension. From there, we may get a head and shoulders or flat type structure which could then turn into a WXY structure for a complex "B" wave. I suggest you watch the short video I posted on my channel. Link below. I do see some nice downside coming but that doesn't mean we can't get something to double top or break the high, but I see the sell as the next move.


NZD/USD updateThere are 3 different ways that I see to label this wave down coming out of the correction. But either way, I don't see it as being in a running flat, but an ending diagonal to retrace. There is a very big demand zone here. I circled the 78% fib because I think that a good place to set a buy limit if it doesn't change its structure and it reaches it. it's breaking the low. This is a fairly large potential swing, possibly even reaching the 7000 level in the longer term. And you can always be patient and wait for price action to confirm...

Bearish CountIf wave {v} took a formation of ending diagonal and has ended at $176.6, a large degree correction will be inevitable.

APPLE BIG CRASHI think an ending diagonal is heading to the end. Overshoot from upper trend channel.. will update with the changes

EURNZD (Bat Pattern and Ending Diagonal) -1h ChartBat Pattern confirmations:
- A-B must touch 0.5, but cannot touch 0.618
- B-C must touch 0.618, but cannot exceed A (FIbo A-B) or just keep an eye on that 0.236
- D completion at 0.886 (Fibo X-A)
- Take profits at 0.382 and 0.618 (Fibo A-D)
- Third TP would be long term back to where it all started
Ending Diagonal confirmations:
- 5 clear points
- 2 clear consolidations
- 0 to 1 same distance as 4 to 5
- Double top at point 5
Daily analysis of EURNZD at related ideas (scroll down)
Good Trading. -1h Chart

USDJPY (Ending Diagonal) - 1h ChartEnding Diagonal
- 5 clear points
- 1 and 4 retesting same level
- 0 to 1 should be same distance as 4 to 5
- after point 5 is reached, bullish movement towards 0.786
We can see some clear consolidations been formed inside this channel, you could sell towards point 5 or play it safe for Ending DIagonal confirmation for bullish movement.
Good Trading. -1h Chart

USDJPY. Long Term Chart. Possible Giant Ending DiagonalThis is the long term chart depicting the possible Ending Diagonal Pattern (green).
What is interesting that small waves c (yellow) of the countertrend waves B (red) already two times are smaller that waves a (yellow).
If this sequence would persist then it's quite possible to have it in the last wave down as projected with the red polyline.
The pair could hit the downside of the pattern at 70 level in wave (5).

GBPJPY Gartley patternConfirmations for Gartley Pattern
- A-B must touch 0.618 but cannot touch 0.786
- B-C must touch 0.236 but cannot exceed A (on this case its at 0.382 unified gartley )
- D completion at 1.272 (Trend Extension) or 0.786 from normal measurement
- First TP at 0.618 (Fibonacci from D-C)
- Second TP at 0.382 (Fibonacci from D-C)
- Third TP would be back to where it all started
Looking at 1000 pips long with this pattern after structures completes D
Good Trading.

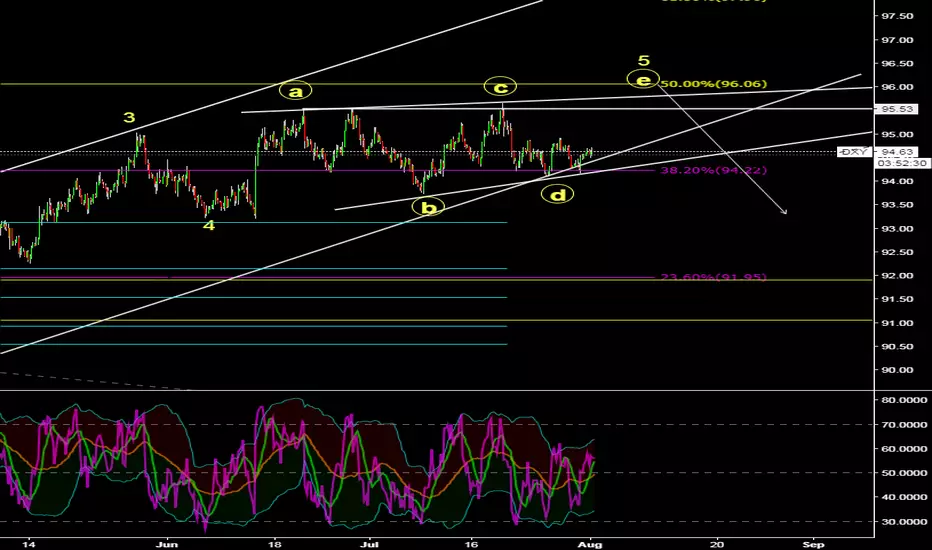
DXY- just a thoughtJust a thought. This is what I would like to see dollar do so I feel very comfortable trading it. However, a flat pattern and a wave 4 triangle (even a running one are still possible pattern wise, the daily is showing some serious divergence. Next major fib level is .9600. An ending diagonal that breaks and reverses always makes me feel more comfortable.
CHF/JPYChf/jpy looks like it may sell down more on daily, but on 1-4hr you can count out a small 5 wave with an ending diagonal. Looking for a 3 wave corrective wave up on 1-4hr.

GPROGO Pro looks to be in an ending diagonal for it's 5th wave of long decline. looks to be retracing some at least. It can correct and continue up, but I would be looking for a 3 wave structure here then one more down. I will post it zoomed out so you can see what I mean. The top trend line can be moved up and this small wave can turn into a larger 3 wave. Whether or not you want to invest long term, check the fundamentals, I am not up to speed, but please look at my zoomed out post in a minute to see what I mean. It will probably at least be correcting down to the 200 ma, but safe entry was from the small ending diagonal.
