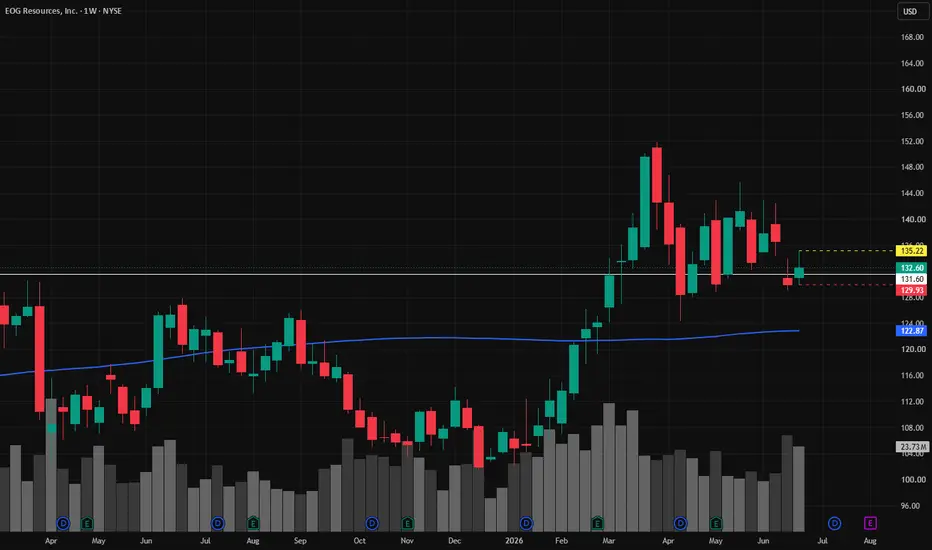
EOG | Continued stock growth- Timeframe: Weekly
- Trade type: Buy stop order
- Price: 135.22
- Take Profit: Open
- Stop Loss: 129.93 (-3.90 %)
Idea: Long on a breakout above last week's high - bullish momentum continuation.
Entry: Buy stop above last week’s high.
Stop-loss: Below the low of the same candle.
If the weekly candle closes below this level, the trade is invalidated.
Take Profit: Trailing stop following the lows of new weekly candles.
EOG
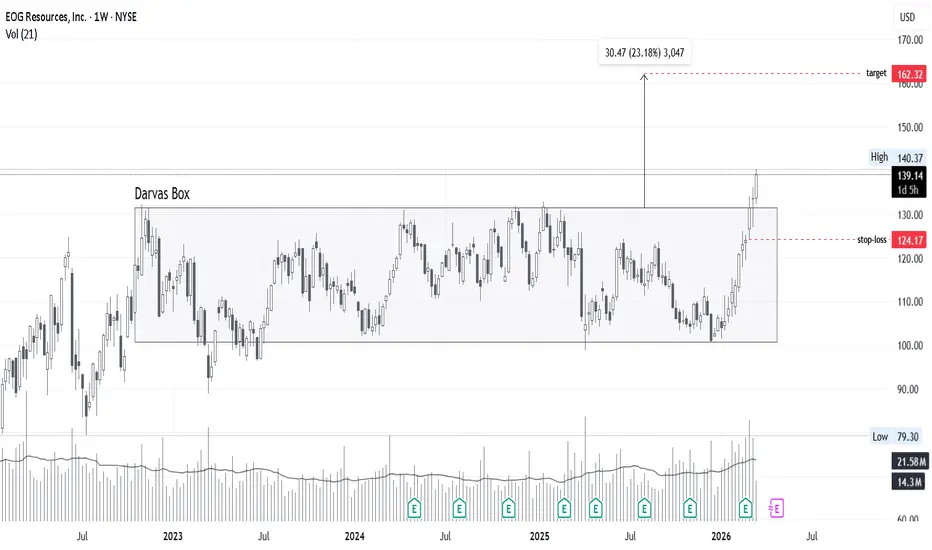
EOG : Darvas Box BreakoutEOG Resources is showing Darvas Box Breakout on a straight rally... we can wait to retest and take the advantage of the breakout.
All data is available in public domain..
CMP : 138
TG : 160
SL : 124
Stock's selection based on 5 Point Analysis:
1: Idea : Darvas Box Breakout.
2: Support : Volume.
3: Technical : 21/55/200-EMA, Super trend up, RS>0 RSI.
4: Fundamental : PE, PAT, Industry & peer PE and sector performance.
5: Timing : Entry Timing on Daily chart.
Disclaimer : It is my pe
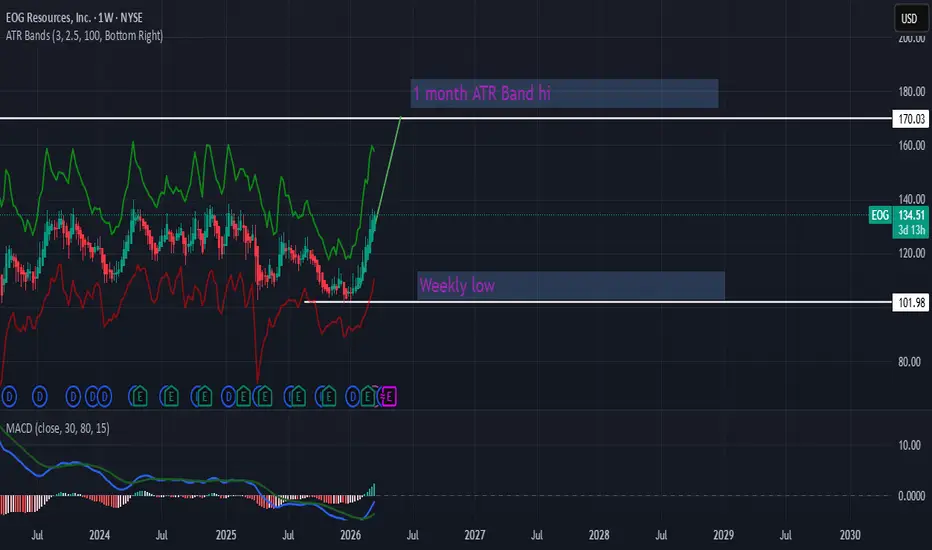
EOG Resources: Energy stratLongterm charts 1W/1D suggests market is transitioning into a trending phase as indicated by candle situation and MACD indicator, bulls momentum need to strengthen for longterm security but the foundation is there.
Shortterm charts 4h/1h/15m indicate bullish energy is sustainable but needs more momentum, positive side is trend time for bears is getting shorter and shorter which allow bulls to strengthen. Market express ability to sustain at minimum effort, may see some pullback but would not w
EOG Potential buy setupReasons for bullish bias:
- Price has made double bottoms
- Entry is at neckline breakout for confirmation
- Entry is also above strong weekly Support turn resistance, if it breaks we will have more points on our side
Entry Level(Buy stop): 117.79
Stop Loss Level: 108.15
Take Profit Level 1: 127.43
Take Profit Level 2: 132.34
OIL: Expected to rebound to $80
The oil price also rose nearly $2 under the stimulus of data, reaching a high near $77. On the 30-minute chart, oil underwent a wave of pullback after consolidating near 76.6, and its current position is the previous consolidation level, which has some resistance but not strong. The short-term strong resistance should be around 77.4.
From a technical standpoint, the current process resembles the formation of a U-shaped bottom, with the MACD indicator in a crossover state. If a death cross oc
EOG Resources Options Ahead of EarningsLooking at the EOG Resources options chain ahead of earnings , I would buy the $125 strike price Calls with
2023-3-17 expiration date for about
$2.60 premium.
If the options turn out to be profitable Before the earnings release, I would sell at least 50%.
Looking forward to read your opinion about it.
EOG Breakout, Target 115Trend Analysis
The main view of this trade idea is on the 2-Hour Chart. The stock EOG displayed 2 bullish instances over the last couple of months. The first occurred during July to September 2021 where the stock made a reverse head and shoulders chart pattern. The completion of this move took EOG back above its long term trend. The 2nd instance materialized when EOG approached the June 2021 resistance at around the 88.25 price level. It appears that the stock has broken above this resistance.
Black Gold is not doneBlack Gold finally broke out from the 3 month cup handle pattern as mentioned last week! Although weekly chart was showing bearish, it was a bullish flag because the lows never broke. This week the momentum continues upward possibly in a big way. Extremely Bullish! Once it breaks 56.75, 59 will be the next target. XOM, SLB, NOV are yummy plays.
EOG Approaching Support, Potential Bounce!EOG is approaching our first support at 83.19 (horizontal swing low support, 61.8% fiboancci extension, 61.8% fiboancci retracement) where a strong bounce might occur above this level pushing price up to our major resistance at 100.05 (horizontal pullback resistance, 100% fibonacci extension, 38.2% fibonacci retracement).
Stochastic (89,5,3) is also approaching support where we might see a corresponding bounce in price.