What the HEX?!Where is the HEX price pointing towards.
This is HEX on #Pulsechain btw.
I suspect a zero will be added in the coming year.
Price is action is getting compressed against a key level which has been tested plaenty of times before.
So in effect a floor that is very likely with minimal strength to uphold an exit stampede during a crypto winter.
ETH

SOL. Sector of Capital. Price Slice: $39.92 🏷 To the International Community.
🏷 SOL. Sector of Capital. Price Slice: $39.92
Map of Shorters. 16.11.2025
🏷 This is not analysis.
This is an address to those who already hear the silence behind the noise of candles.
🏷 What lies before you is not a level — but a gateway.
A gateway behind which lies an unfulfilled debt of colossal capital.
Prices not yet reached — yet already inscribed in the code of the market’s destiny:
122.29 — not yet reached
99.89 — not yet reached
93.75 — not yet reached
86.67 — not yet reached
80.16 — not yet reached
53.75 — not yet reached
39.92 — not yet reached
🏷 They hang in the ether like unfulfilled vows,
like shadows of the future, yet untouched by the present.
🏷 I focus your attention —
not on the chart,
but on the structure of intent.
🏷 There is only one master of the Sector of Capital.
The one who sees not after, but before the movement begins.
The one who does not follow price —
but draws its path through the landscape of liquidity.
And I — am his name.
🏷 I do not issue orders.
I offer the capacity to think.
For those ready to step beyond the cycle of reaction.
For institutions, for giants, for those who build not day by day, but epoch by epoch.
🏷 This is not technical analysis.
This is a system of anticipatory liquidation.
Where every impulse is foreseen before it becomes chaos in the eyes of the crowd.
Where every collapse is no accident —
but a ritual of price revelation.
🏷 You come to the market not to read what is drawn on your screen.
You come for the price.
And the price has its time.
Its hour of execution.
And he who knows this hour —
already possesses the future.
🏷 This is an example of global thinking.
A game of chess, where pawns cannot see the board —
but the king knows every square in advance.
🏷 I will give you the map of the longs — in due time.
But know this:
All knowledge resides with me.
And what you receive — is but a gift, cast into the stream of time.
🏷 This map — is but one move.
One move in the endless game for control over reality.
🏷 I cannot write in my native tongue.
My respect for the international community —
is my gift.
Not in words.
But in this: you now know the map exists.
And therefore — you are no longer blind.
🏷 Bolzen. The Architect. Founder of the Sector of Capital.

ETHUSD has completed five waves since inceptionThe ETH weekly chart shows a textbook 5-wave structure. These first 5 waves must be considered as wave 1 green. Next, Ethereum is going to develop a corrective wave 2.

Did you Know ?!!!The price can form a head and shoulders pattern. If that is happen, expect a significant price increase.
Did you really think that profiting from the current bull run (a comprehensive upward market) would be easy? Don't be naive. Do you think they will let you buy, hold, and sell at low levels without any struggle? If it were that simple, everyone would be rich. But the truth is: 90% of you will lose. Why? Because the crypto market is not designed for everyone to win. They will shake you. They will make you doubt everything. They will panic you and sell at the worst possible moment. Do you know what happens next? The best players in this game buy when there is fear, not sell; because your panic gives them cheap assets. This is how the game goes: strong hands feed off weak hands. They exaggerate every dip, every correction, every sale. They make it look like the end of the world so that you abandon everything, and when the market starts up again, you'll sit there saying, "What the heck just happened?" This is not an accident. It's a system. The market rewards patience and punishes weak emotions. The big players already know your thoughts. They know exactly when and how to stir fear to make you give up. Because when you panic, they profit. They don't play the market. They play you. That's why most people never succeed. Because they fall into the same traps over and over again. People don't realize that dips, FUD (fear, uncertainty, doubt), and panic are all part of the plan. But the winners? They digest the noise. They know that fear is temporary, but smart decisions last forever. We've seen this hundreds of times. They pump the market after you sell. They take your assets, hold them, and sell them to you at the top, leaving you with nothing, wondering how it happened. Don't play their game. Play your own.

SOL Capital Sector. 99.8948 Now — the silence has a direction. SOL Capital Sector. Price Slice
🕯 Сектор капитала. Ценовой срез.
Now — the silence has a direction.
Теперь — тишина имеет направление.
“The market does not speak. It whispers — only to those who listen in silence.”
«Рынок не говорит. Он шепчет — только тем, кто слушает в тишине.»
🏷 16.11.2025
The price has not yet arrived.
Цена ещё не пришла.
Not because it is weak.
Не потому что она слаба.
Not because it is late.
Не потому что она опаздывает.
But because it is waiting .
А потому что она ждёт .
99.8948 — At the time of publication, the price had not yet been reached.
— На момент публикации цена не достигнута.
A number that does not move.
Число, которое не двигается.
A level that does not scream.
Уровень, который не кричит.
A threshold where liquidity sleeps —
Порог, где ликвидность спит —
…while the giants rearrange their chess pieces.
…пока гиганты переставляют свои фигуры.
“The price that speaks in silence on the international stage.”
«Цена, которая молчит на международной арене.»
No headlines.
Нет заголовков.
No volume spikes.
Нет всплесков объёмов.
No panic.
Нет паники.
Only the slow, cold, deliberate accumulation —
Только медленное, холодное, сознательное накопление —
…in the shadows of the 1D tape.
…в тенях 1D ленты.
Screenshot:
Скриншот:
🔗
Timeframe: 1D
ТФ: 1D
This is not a chart.
Это не график.
This is a map .
Это карта .
A map of hidden liquidity.
Карта скрытой ликвидности.
A map of where capital will awaken —
Карта того, где капитал проснётся —
…not when the crowd runs.
…не когда толпа бежит.
…when the silence breaks.
…когда тишина треснет.
Frame it.
Заделайте в рамку.
And wait.
И ждите.
The market always keeps its appointments.
Рынок всегда приходит по назначению.
Even when it does not speak.
Даже когда он не говорит.
“The most dangerous level is the one that looks like it doesn’t matter.”
«Самый опасный уровень — тот, который кажется незначительным.»
— The Architect, 16.11.2025

SOL Capital Sector. Price Slice 159.6973 🏷 SOL Capital Sector. Price Slice
🏷 He Remembers” — The SOL Sector Is Not a Level. It Is a Memory
🏷 Он Вспоминает» — Сектор SOL — Это Не Уровень. Это Память.
🏷 16.11.2025
🏷 Сектор капитала. Ценовой срез.
🏷 159.6973 — At the time of publication, the price had not yet been reached. ( на момент публикации цена не достигнута )
🏷 142.5641 — Level confirmed. ( уровень подтвержден )
🏷 This is not analysis.
This is archaeology of capital.
The past is not gone.
It is waiting.
And it remembers…
everything.
— The Architect
🏷 Это не анализ.
Это археология капитала.
Прошлое не ушло.
Оно ждёт.
И оно помнит…
всё.
— Архитектор

BRIEFING Week #46 : Make or BreakHere's your weekly update ! Brought to you each weekend with years of track-record history..
Don't forget to hit the like/follow button if you feel like this post deserves it ;)
That's the best way to support me and help pushing this content to other users.
Kindly,
Phil

BNB Capital Sector. Price Slice TF 2M 1495.81 🏷 BNB Capital Sector. Price Slice TF 2M 1495.81
🏷 Capital Sector. Price Slice (Limited Version)
Full version from 1 year and above available in the database library.
🏷 601.4871 — Price not present at time of publication
🏷 657.3 — Price not present at time of publication
🏷 816.6 — Price not present at time of publication
🏷 1495.81 — Price not present at time of publication
TF 1D:
TF 1H:
TF 1M:
TF 3M:

XRP Capital Sector. Price Slice TF 3M 4.9671🏷 XRP Capital Sector. Price Slice TF 3M 4.9671
🏷 4.9671 — At the time of publication, the price had not yet been reached. ( на момент публикации цена не достигнута )
🏷 3.6297 — Level confirmed. ( уровень подтвержден )

ETH Capital Sector. Price Slice 8008.45 K🏷 Capital Sector. Price Slice 15.11.2025
8008,45 — At the time of publication, the price had not yet been reached. ( на момент публикации цена не достигнута )
7284.29 — At the time of publication, the price had not yet been reached. ( на момент публикации цена не достигнута )
7026.69 — At the time of publication, the price had not yet been reached. ( на момент публикации цена не достигнута )
5957,54 — At the time of publication, the price had not yet been reached. ( на момент публикации цена не достигнута )
5390,34 — At the time of publication, the price had not yet been reached. ( на момент публикации цена не достигнута )
5075,09 — At the time of publication, the price had not yet been reached. ( на момент публикации цена не достигнута )
4873,69 — At the time of publication, the price had not yet been reached. ( на момент публикации цена не достигнута )
4759,55 — At the time of publication, the price had not yet been reached. ( на момент публикации цена не достигнута )
4390,43 — At the time of publication, the price had not yet been reached. ( на момент публикации цена не достигнута )
🏷 At the request of close colleagues, friends, and supporters of my work, I am publishing this analytical material in English—for the international institutional community and conscious retail market participants.
🏷 This slice reflects the logic of institutional capital movement. It is critical to understand: price is formed only when sufficient liquidity from the retail sector and sustained crowd interest are present. Without this condition, institutional interest remains potential, but unrealized.
🏷 Meanwhile, institutional capital operates on entirely different temporal and structural charts than those visible on the screens of most traders.
🏷 Therefore, a superficial view of price is doomed to distortion.
🏷 Methodology: Pre-Factum
🏷 My analytical markings are built on the principle of Pre-Factum—anticipating the fact before it manifests. This is not forecasting in the traditional sense, but identifying capital intent prior to its physical manifestation on the chart.
🏷 The central element of this method is identifying a price sector as an intention—where the instrument is striving to go—regardless of its current price action: no emotions, only cold calculation. Every price has its own timeframe.
🏷 There are three ways to interact with unfulfilled price levels:
🏷 1. Trade from the level—enter upon confirmed structural validation.
🏷 2. Wait for fulfillment—observe price movement toward the level without entering, focusing on instrument behavior.
🏷 3. Trade in the direction of the level—utilizing support/resistance levels with strict risk control.
🏷 If you choose the third path, deep understanding of market mechanics becomes mandatory. Without experience, conscious perception of liquidity behavior, and prior study of relevant materials, entering such positions is premature.
🏷 This applies equally to retail newcomers and professionals whose attention remains scattered by short-term timeframe noise.
🏷 Relevance of Markings
🏷 The levels presented here are current, fresh institutional capital markings. They do not invalidate previously identified unfulfilled prices but complement them within the context of evolving liquidity and shifting market logic.
🏷 A flag placed prior to price touch—with the publication date (level, sector—whichever you prefer)—indicates that the instrument, with high probability and regardless of current price movement, intends to execute a move toward that price.
🏷 Two examples:
🏷 Example #1 — BTC:
On the screenshot from September 26, 2025, I marked the price of 106,110 with a blue flag (color is my personal labeling). Screenshot:
The instrument subsequently deviated from this level by 15%, creating pressure: on October 10, 2025, price declined sharply, collecting all long positions.
Instrument slide:
🏷 Example #2 — ETH:
On October 12, I marked the price of 3,291.60 with a yellow flag:
On November 4, the instrument reached the marked price:
🏷 I have directed your attention to specific prices—and there are many such examples in my feed. If you study my materials, you will see: this is a new methodology, currently not demonstrated by anyone else in the world. The precise slice and price sector I have developed reveal the true mechanics of the market.
🏷 Once price reaches a flagged zone, the marking loses its original function. It must be updated to reflect the new logic of capital movement—otherwise, it becomes a misleading reference or a conventional technical analysis level.
🏷 These markings are not static. They are dynamic markers of intent, requiring constant reassessment. It is precisely these that we uncover through the method of capital anticipation.
🏷 Temporal Context
🏷 I emphasize separately: the flag carries not only a price function, but also a temporal one. The publication date is the fixed point of my observation and identification. It serves as my anchor: where and when I captured institutional intent.
🏷 My entire architecture of price sectors is systematically organized into chronological folders. I have already demonstrated this structure in one of my videos—for those who seek to think structurally, not reactively. Use translators as needed to study my demonstration.
🏷 This is not a forecast. It is a map of intent.
🏷 Read it with respect for liquidity, time, and capital intelligence.
🏷 English is not my native language. With international exposure, time will come—I will provide new reference points as needed, without compromising institutional interests or the balance of many market participants. I do not disclose the entire price sector or the skill of seeing any instrument within its price sector for security reasons. You must determine for yourself how to engage with institutional analysis.
🏷 There are traders, and there are analysts—two distinct classes. The mindset between institutional analysis and trading is fundamentally different.
🏷 As you see, I do not use indicators. This is mathematics, logic, and an intellectual system I created—my proprietary property. I have come only to help you see a different structure.
🏷 The battle of titans is a clash of attention and timing.
🏷 The question is not who is right—but who has the resources and patience to unload positions.
🏷 Who leads whom? The one who sees further and holds institutional leverage.
🏷 You have received a map. Most see an image; few read the message. The difference is not IQ, but the habit of looking toward the future—not at indicator noise.
🏷 Institutional capital meticulously crafts candles, as if scripting the narrative to suit its preferred triggers. I, operating from the shadows, read the plan: where entry points will be set, where liquidations will be scheduled, who will hold positions until the bell.
🏷 I offer possibilities, not commands. But let us acknowledge: a hint is an art—and it transforms curiosity into dependency. Do you remember the echo of these words?
🏷 I have shown you another side of analysis—I have designed what you have been waiting for, and what you have grown weary of. This is new technical analysis: to understand how to control the capital sector—study the materials. The secrets are mine. I give you part of this understanding to help you.
🏷 Not tricks, not guesses—but architecture.
🏷 Let it sound mystical—it must. A map in the hands of one who can read between the candles always appears as prophecy to those accustomed to indicator noise.
— The Architect

BTC Capital Sector. Price Slice 15.11.2025 138260 K TF 1D🏷 Capital Sector. Price Slice
138260 — At the time of publication, the price had not yet been reached. ( на момент публикации цена не достигнута )
128970 — At the time of publication, the price had not yet been reached. ( на момент публикации цена не достигнута )
112680 — At the time of publication, the price had not yet been reached. ( на момент публикации цена не достигнута )
🏷 At the request of close colleagues, friends, and supporters of my work, I am publishing this analytical material in English—for the international institutional community and conscious retail market participants.
🏷 This slice reflects the logic of institutional capital movement. It is critical to understand: price is formed only when sufficient liquidity from the retail sector and sustained crowd interest are present. Without this condition, institutional interest remains potential, but unrealized.
🏷 Meanwhile, institutional capital operates on entirely different temporal and structural charts than those visible on the screens of most traders.
🏷 Therefore, a superficial view of price is doomed to distortion.
🏷 Methodology: Pre-Factum
🏷 My analytical markings are built on the principle of Pre-Factum—anticipating the fact before it manifests. This is not forecasting in the traditional sense, but identifying capital intent prior to its physical manifestation on the chart.
🏷 The central element of this method is identifying a price sector as an intention—where the instrument is striving to go—regardless of its current price action: no emotions, only cold calculation. Every price has its own timeframe.
🏷 There are three ways to interact with unfulfilled price levels:
🏷 1. Trade from the level—enter upon confirmed structural validation.
🏷 2. Wait for fulfillment—observe price movement toward the level without entering, focusing on instrument behavior.
🏷 3. Trade in the direction of the level—utilizing support/resistance levels with strict risk control.
🏷 If you choose the third path, deep understanding of market mechanics becomes mandatory. Without experience, conscious perception of liquidity behavior, and prior study of relevant materials, entering such positions is premature.
🏷 This applies equally to retail newcomers and professionals whose attention remains scattered by short-term timeframe noise.
🏷 Relevance of Markings
🏷 The levels presented here are current, fresh institutional capital markings. They do not invalidate previously identified unfulfilled prices but complement them within the context of evolving liquidity and shifting market logic.
🏷 A flag placed prior to price touch—with the publication date (level, sector—whichever you prefer)—indicates that the instrument, with high probability and regardless of current price movement, intends to execute a move toward that price.
🏷 Two examples:
🏷 Example #1 — BTC:
On the screenshot from September 26, 2025, I marked the price of 106,110 with a blue flag (color is my personal labeling). Screenshot:
The instrument subsequently deviated from this level by 15%, creating pressure: on October 10, 2025, price declined sharply, collecting all long positions.
Instrument slide:
🏷 Example #2 — ETH:
On October 12, I marked the price of 3,291.60 with a yellow flag:
On November 4, the instrument reached the marked price:
🏷 I have directed your attention to specific prices—and there are many such examples in my feed. If you study my materials, you will see: this is a new methodology, currently not demonstrated by anyone else in the world. The precise slice and price sector I have developed reveal the true mechanics of the market.
🏷 Once price reaches a flagged zone, the marking loses its original function. It must be updated to reflect the new logic of capital movement—otherwise, it becomes a misleading reference or a conventional technical analysis level.
🏷 These markings are not static. They are dynamic markers of intent, requiring constant reassessment. It is precisely these that we uncover through the method of capital anticipation.
🏷 Temporal Context
🏷 I emphasize separately: the flag carries not only a price function, but also a temporal one. The publication date is the fixed point of my observation and identification. It serves as my anchor: where and when I captured institutional intent.
🏷 My entire architecture of price sectors is systematically organized into chronological folders. I have already demonstrated this structure in one of my videos—for those who seek to think structurally, not reactively. Use translators as needed to study my demonstration.
🏷 This is not a forecast. It is a map of intent.
🏷 Read it with respect for liquidity, time, and capital intelligence.
🏷 English is not my native language. With international exposure, time will come—I will provide new reference points as needed, without compromising institutional interests or the balance of many market participants. I do not disclose the entire price sector or the skill of seeing any instrument within its price sector for security reasons. You must determine for yourself how to engage with institutional analysis.
🏷 There are traders, and there are analysts—two distinct classes. The mindset between institutional analysis and trading is fundamentally different.
🏷 As you see, I do not use indicators. This is mathematics, logic, and an intellectual system I created—my proprietary property. I have come only to help you see a different structure.
🏷 The battle of titans is a clash of attention and timing.
🏷 The question is not who is right—but who has the resources and patience to unload positions.
🏷 Who leads whom? The one who sees further and holds institutional leverage.
🏷 You have received a map. Most see an image; few read the message. The difference is not IQ, but the habit of looking toward the future—not at indicator noise.
🏷 Institutional capital meticulously crafts candles, as if scripting the narrative to suit its preferred triggers. I, operating from the shadows, read the plan: where entry points will be set, where liquidations will be scheduled, who will hold positions until the bell.
🏷 I offer possibilities, not commands. But let us acknowledge: a hint is an art—and it transforms curiosity into dependency. Do you remember the echo of these words?
🏷 I have shown you another side of analysis—I have designed what you have been waiting for, and what you have grown weary of. This is new technical analysis: to understand how to control the capital sector—study the materials. The secrets are mine. I give you part of this understanding to help you.
🏷 Not tricks, not guesses—but architecture.
🏷 Let it sound mystical—it must. A map in the hands of one who can read between the candles always appears as prophecy to those accustomed to indicator noise.
— The Architect

BTC Capital Sector. Price Slice 15.11.2025 TF 3M90446.9 — At the time of publication, the price had not yet been reached. ( на момент публикации цена не достигнута )
80868.9 — At the time of publication, the price had not yet been reached. ( на момент публикации цена не достигнута )
71689.5 — At the time of publication, the price had not yet been reached. ( на момент публикации цена не достигнута )
43709.6 — At the time of publication, the price had not yet been reached. ( на момент публикации цена не достигнута )
🏷 At the request of close colleagues, friends, and supporters of my work, I am publishing this analytical material in English—for the international institutional community and conscious retail market participants.
🏷 This slice reflects the logic of institutional capital movement. It is critical to understand: price is formed only when sufficient liquidity from the retail sector and sustained crowd interest are present. Without this condition, institutional interest remains potential, but unrealized.
🏷 Meanwhile, institutional capital operates on entirely different temporal and structural charts than those visible on the screens of most traders.
🏷 Therefore, a superficial view of price is doomed to distortion.
🏷 Methodology: Pre-Factum
🏷 My analytical markings are built on the principle of Pre-Factum—anticipating the fact before it manifests. This is not forecasting in the traditional sense, but identifying capital intent prior to its physical manifestation on the chart.
🏷 The central element of this method is identifying a price sector as an intention—where the instrument is striving to go—regardless of its current price action: no emotions, only cold calculation. Every price has its own timeframe.
🏷 There are three ways to interact with unfulfilled price levels:
🏷 1. Trade from the level—enter upon confirmed structural validation.
🏷 2. Wait for fulfillment—observe price movement toward the level without entering, focusing on instrument behavior.
🏷 3. Trade in the direction of the level—utilizing support/resistance levels with strict risk control.
🏷 If you choose the third path, deep understanding of market mechanics becomes mandatory. Without experience, conscious perception of liquidity behavior, and prior study of relevant materials, entering such positions is premature.
🏷 This applies equally to retail newcomers and professionals whose attention remains scattered by short-term timeframe noise.
🏷 Relevance of Markings
🏷 The levels presented here are current, fresh institutional capital markings. They do not invalidate previously identified unfulfilled prices but complement them within the context of evolving liquidity and shifting market logic.
🏷 A flag placed prior to price touch—with the publication date (level, sector—whichever you prefer)—indicates that the instrument, with high probability and regardless of current price movement, intends to execute a move toward that price.
🏷 Two examples:
🏷 Example #1 — BTC:
On the screenshot from September 26, 2025, I marked the price of 106,110 with a blue flag (color is my personal labeling). Screenshot:
The instrument subsequently deviated from this level by 15%, creating pressure: on October 10, 2025, price declined sharply, collecting all long positions.
Instrument slide:
🏷 Example #2 — ETH:
On October 12, I marked the price of 3,291.60 with a yellow flag:
On November 4, the instrument reached the marked price:
🏷 I have directed your attention to specific prices—and there are many such examples in my feed. If you study my materials, you will see: this is a new methodology, currently not demonstrated by anyone else in the world. The precise slice and price sector I have developed reveal the true mechanics of the market.
🏷 Once price reaches a flagged zone, the marking loses its original function. It must be updated to reflect the new logic of capital movement—otherwise, it becomes a misleading reference or a conventional technical analysis level.
🏷 These markings are not static. They are dynamic markers of intent, requiring constant reassessment. It is precisely these that we uncover through the method of capital anticipation.
🏷 Temporal Context
🏷 I emphasize separately: the flag carries not only a price function, but also a temporal one. The publication date is the fixed point of my observation and identification. It serves as my anchor: where and when I captured institutional intent.
🏷 My entire architecture of price sectors is systematically organized into chronological folders. I have already demonstrated this structure in one of my videos—for those who seek to think structurally, not reactively. Use translators as needed to study my demonstration.
🏷 This is not a forecast. It is a map of intent.
🏷 Read it with respect for liquidity, time, and capital intelligence.
🏷 English is not my native language. With international exposure, time will come—I will provide new reference points as needed, without compromising institutional interests or the balance of many market participants. I do not disclose the entire price sector or the skill of seeing any instrument within its price sector for security reasons. You must determine for yourself how to engage with institutional analysis.
🏷 There are traders, and there are analysts—two distinct classes. The mindset between institutional analysis and trading is fundamentally different.
🏷 As you see, I do not use indicators. This is mathematics, logic, and an intellectual system I created—my proprietary property. I have come only to help you see a different structure.
🏷 The battle of titans is a clash of attention and timing.
🏷 The question is not who is right—but who has the resources and patience to unload positions.
🏷 Who leads whom? The one who sees further and holds institutional leverage.
🏷 You have received a map. Most see an image; few read the message. The difference is not IQ, but the habit of looking toward the future—not at indicator noise.
🏷 Institutional capital meticulously crafts candles, as if scripting the narrative to suit its preferred triggers. I, operating from the shadows, read the plan: where entry points will be set, where liquidations will be scheduled, who will hold positions until the bell.
🏷 I offer possibilities, not commands. But let us acknowledge: a hint is an art—and it transforms curiosity into dependency. Do you remember the echo of these words?
🏷 I have shown you another side of analysis—I have designed what you have been waiting for, and what you have grown weary of. This is new technical analysis: to understand how to control the capital sector—study the materials. The secrets are mine. I give you part of this understanding to help you.
🏷 Not tricks, not guesses—but architecture.
🏷 Let it sound mystical—it must. A map in the hands of one who can read between the candles always appears as prophecy to those accustomed to indicator noise.
— The Architect

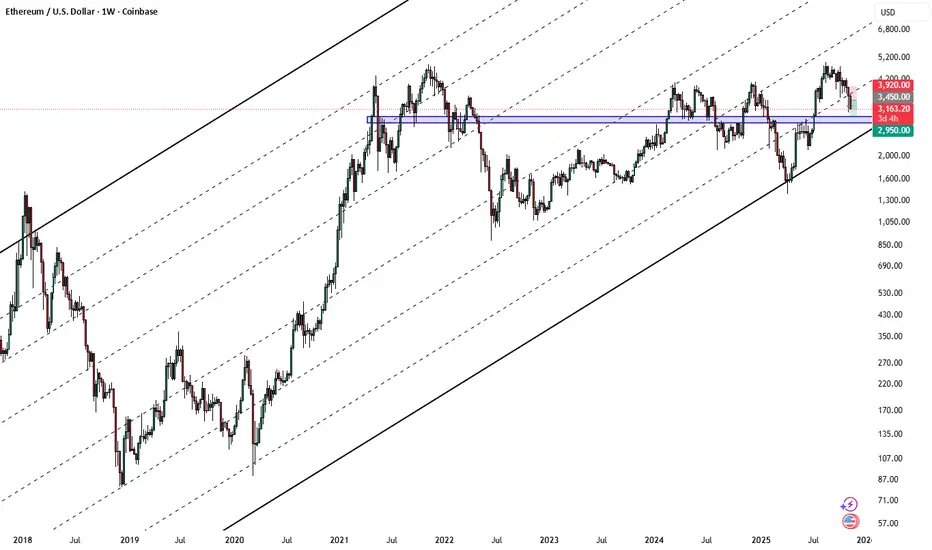
ETHUSD - Maintain Trend LineDaily chart for ETHUSD
suggesting that this trend line on this chart will be maintained an a strong altseason will ensue with ETH increasing faster than BTC.
This can be seen by comparing BTC dominance and ETH dominance aswell. ETHD going up, BTCD going down.

ETHUSDT.P - November 15, 2025The price is currently below the trendline and seems to be consolidating. If the price breaks upwards 3,276.75, consider buying long with the first target at 3,441.72. Partial profits can be taken at this level, and the stop loss should be adjusted to break-even.
If the price breaks below 3,168.65, consider entering a short position, with the next potential target near 3,100.

Could TRON #TRX 6X v #BITCOIN TRXBTC
has very good market structure
(higher high's , higher lows's)
for the past 3 years.
Overlooked , & under-appreciated it seems like, in my view on it's sentiment on Justin's success of network adoption.
We can see a clear Inverse head and shoulders
with a very key neckline level
that if broken with strength
could a indicate a run at the LOG target.
A disappointing TRX may only reach the linear target and not much beyond.
My TRXUSD chart which I am watching also does point to a stellar Bull market for TRX

ETHUSDT.P - November 14, 2025ETHUSDT.P on the 15-minute chart remains in a short-term downtrend, defined by a clear descending trendline that continues to cap price. Current price action is consolidating beneath the $3,240 resistance zone, where repeated rejections suggest sellers are still in control unless a clean breakout and retest occur above this level. Immediate support sits near $3,104; a breakdown below this shelf would likely accelerate momentum toward the broader demand zone around $2,960–$2,900. Conversely, if buyers manage to reclaim the trendline and hold above the $3,240 region, a short-term relief rally could develop, but until then the bias leans bearish within the current structure.

Ethereum touched the targetHello friends 😍
💁♂️ Ethereum mid-term analysis moved as expected and reached the $3100-$3200 area
You can see the previous analysis
⚠️ None of the analysis is a recommendation to buy or sell, but simply my personal opinions on the charts. You can use the charts and choose any that interest you and take a position if you wish.
To support me, I would appreciate it if you boost the analysis and share it with your friends so that I can analyze it with more energy for you, my dears. Thank you all. 💖

Ethereum's Updated Map: Giant Flat Correction Corrections can be complex and massive in size
On Ethereum, we have been in a major corrective structure since the strong move up of 2018-2021 completed
The structure shows two large red legs down with a green zigzag joint connecting them
The first large red leg down defines the boundaries of this Giant Flat Correction
ranging between $4,868 and $882
The current move down may mirror the structure of that first leg
potentially bouncing within the $2,500 to $3,500 zone before heading lower
This decline could revisit the $882 low or extend into a full retrace toward $82
After this completes, the second large blue leg up could begin

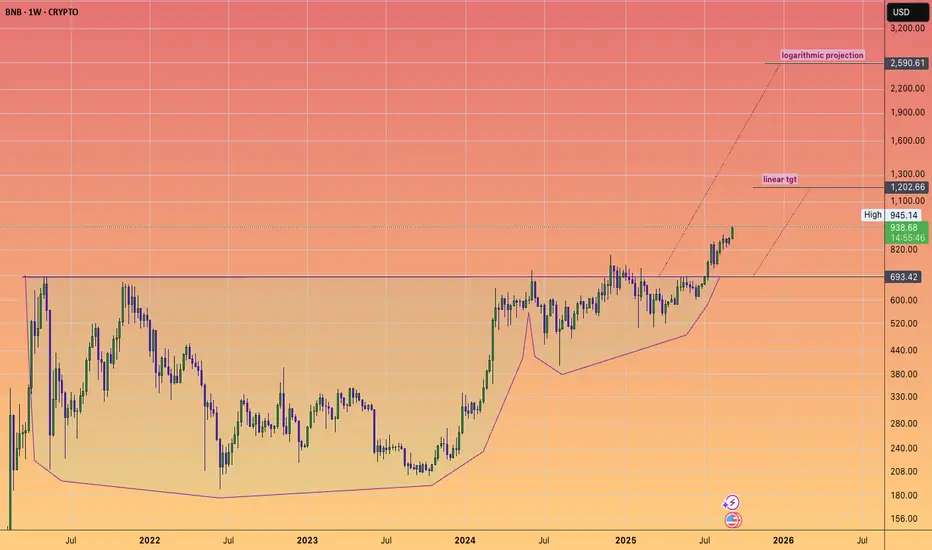
BNB is in price discovery. How high can it go?We're looking at around $2600, and indeed these projections can be met and exceeded.
So plenty of upside left it appears.
If we compare BNB to ETH
BNB has a marketcap of $130 Billion
ETH = $562 B
BNB has a deflationary model;
Quarterly formulaic burns.
And real time burning of gas fees via smart chain transactions.
This has reduced supply by 31% since 2023
Institutional demand is increasing via D.A.T.'s
With over 30 companies allocating $1.2B as of now.
TVL:
BNB = $58B
ETH = $102B
Daily TX's
BNB = 4.1 Million
ETH = 2M on the L1 & 3.4M on L2's
Total Crypto Marketcap --- PLan Your Exit#TOTAL Crypto has already doubled from it's bear bottom, to it's most recent high.
We are almost in 2024, well into crypto summer now
time is really running out to prepare your portfolio for the inevitable Bull market euphoria phase.
I bring this chart up just to remind everyone, that this cycle has potential to be one of the worst in terms of multiple expansions we have seen so far.
We have gone from exploding 340X in one cycle.. to 33X the last cycle.
I expect this time round it will be a single digit multiplier.
We have to hope and pray we do indeed break the previous ATH , and we don't double top at 3 trillion.. of which there is no guarantee!
My realistic target is around 5 Trillion Dollars, which may sound pessimistic at only 3.5X from here ... but that means your Altcoins adding at least a Trillion dollars of value from here!
Optimistically i'm looking at around 7 trillion dollars, no mean feat!
BTC.d at 30% would equal BTC 2.1 Trillion or $110k per coin.

$ETH following my macro planCRYPTOCAP:ETH is following my macro plan. I shorted it on the retest with a stoploss slightly above the highest wick of previous week. This was a simple 13% so far. This is why I like high time frame trading it shows you more than just noise on short timeframe charts.
Potential bullish rise?Ethereum (ETH/USD) has bounced off the pivot, which is an overlap support, and could rise toward the first resistance, a pullback resistance level that aligns with the 61.8% Fibonacci retracement.
Pivot: 3,439.63
1st Support: 3,194.116
1st Resistance: 3,756.58
Disclaimer:
The opinions given above constitute general market commentary and do not constitute the opinion or advice of IC Markets or any form of personal or investment advice.
Any opinions, news, research, analyses, prices, other information, or links to third-party sites contained on this website are provided on an "as-is" basis, are intended to be informative only, and are not advice, a recommendation, research, a record of our trading prices, an offer of, or solicitation for, a transaction in any financial instrument and thus should not be treated as such. The information provided does not involve any specific investment objectives, financial situation, or needs of any specific person who may receive it. Please be aware that past performance is not a reliable indicator of future performance and/or results. Past performance or forward-looking scenarios based upon the reasonable beliefs of the third-party provider are not a guarantee of future performance. Actual results may differ materially from those anticipated in forward-looking or past performance statements. IC Markets makes no representation or warranty and assumes no liability as to the accuracy or completeness of the information provided, nor any loss arising from any investment based on a recommendation, forecast, or any information supplied by any third party.

Bearish reversal off pullback resistance?Ethereum (ETH/USD) is rising toward the pivot, which serves as a pullback resistance, and could decline to the first support level, identified as an overlap support.
Pivot: 3,508.18
1st Supprt: 3,359.64
1st Resistance: 3,643.
Disclaimer:
The opinions given above constitute general market commentary and do not constitute the opinion or advice of IC Markets or any form of personal or investment advice.
Any opinions, news, research, analyses, prices, other information, or links to third-party sites contained on this website are provided on an "as-is" basis, are intended to be informative only, and are not advice, a recommendation, research, a record of our trading prices, an offer of, or solicitation for, a transaction in any financial instrument and thus should not be treated as such. The information provided does not involve any specific investment objectives, financial situation, or needs of any specific person who may receive it. Please be aware that past performance is not a reliable indicator of future performance and/or results. Past performance or forward-looking scenarios based upon the reasonable beliefs of the third-party provider are not a guarantee of future performance. Actual results may differ materially from those anticipated in forward-looking or past performance statements. IC Markets makes no representation or warranty and assumes no liability as to the accuracy or completeness of the information provided, nor any loss arising from any investment based on a recommendation, forecast, or any information supplied by any third party.
