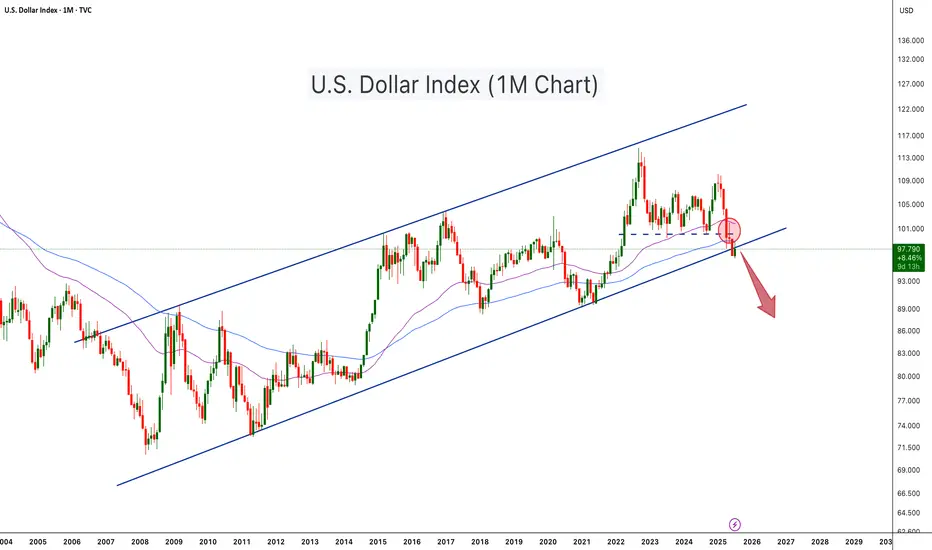
U.S. Dollar Index Loses Key Support – Crypto Bull Run Loading?The U.S. Dollar Index (DXY) has just broken below a long-term ascending channel, which has held since 2008. After losing the key horizontal support (~100 level), DXY retested and rejected from it (red circle), confirming a potential trend reversal. The move is technically significant and hints at further downside, possibly toward the 88–90 zone or lower.
This breakdown aligns with classic macro cycles, where a weaker dollar often fuels bullish momentum in risk assets, especially crypto. Historically:
-DXY downtrends in 2017 and 2020–2021 coincided with major Bitcoin and altcoin bull runs.
-DXY strength during 2018 and 2022 contributed to crypto bear markets.
With DXY now below both horizontal and diagonal support, Bitcoin and the broader crypto market may be entering the next expansion phase, especially if the dollar continues its downward trajectory
-DXY has broken below a 17 year rising channel – a macro bearish signal.
-Rejection from former support turned resistance confirms breakdown.
-A falling DXY historically corresponds with Bitcoin rallies and altseason expansions.
-Declining dollar strength could be the fuel that propels Bitcoin past $140K and Ethereum above $6K.
-A dollar bear trend may fuel total crypto market cap breakout beyond $4T+.
As DXY weakens, liquidity tends to rotate into risk-on assets like crypto. This setup mirrors pre-bull run environments seen in 2017 and 2020. A structural breakdown in the dollar could act as a catalyst for Bitcoin’s next major leg up.
Cheers
Hexa
ETHUSDT
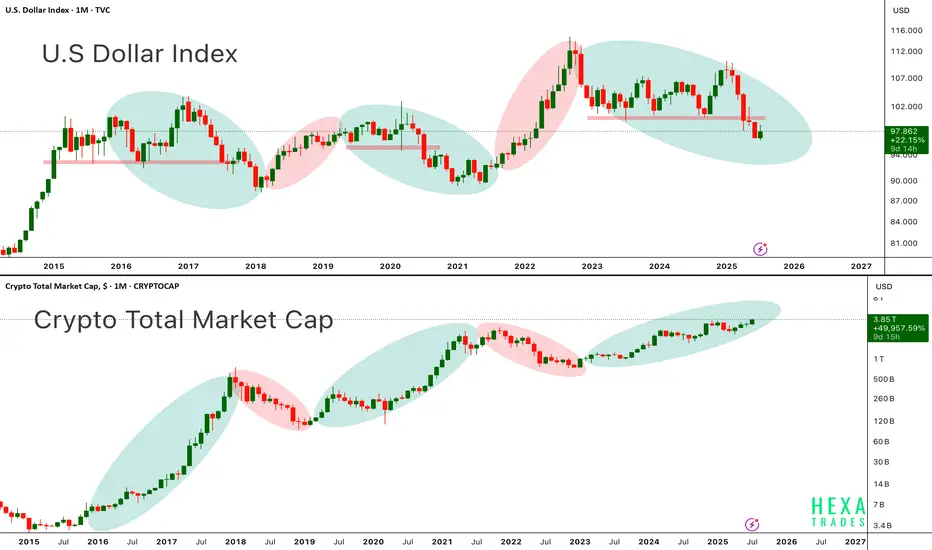
DXY vs. CryptoAbove chart highlights the long standing inverse correlation between the U.S. Dollar Index and the Crypto Total Market Cap a relationship that has guided the macro trend for Bitcoin and altcoins since 2015.
in the first chart, When the dollar weakens (green ovals), crypto tends to rally. When the dollar strengthens (red ovals), crypto markets usually experience corrections or prolonged bear markets.
In the second chart, each period of dollar weakness aligns almost perfectly with explosive crypto upside seen in 2017, 2020–2021, and now potentially again in late 2024 through 2025. Conversely, periods of DXY strength (2018, 2022) coincide with crypto market downturns.
Currently, DXY is entering a downward phase, while the crypto total market cap is pushing higher, now above $3.8 trillion suggesting that a new leg in the crypto bull cycle may be underway. Bitcoin and Ethereum have historically performed best when DXY trends lower, as liquidity shifts into risk-on assets.
Key Points:
-DXY and crypto market cap show a strong inverse macro relationship.
-DXY in a clear downtrend from 2024 highs supportive of further crypto upside.
-Crypto Total Market Cap approaching all-time highs suggesting broad market strength.
-Potential for BTC > $150K and ETH > $6K+ if this macro divergence continues.
-This setup resembles early 2020, right before the massive crypto bull run.
If the dollar continues to weaken structurally, crypto markets led by Bitcoin and Ethereum could see accelerated momentum, pushing into parabolic territory by late 2025.
Cheers
Hexa🧘♀️
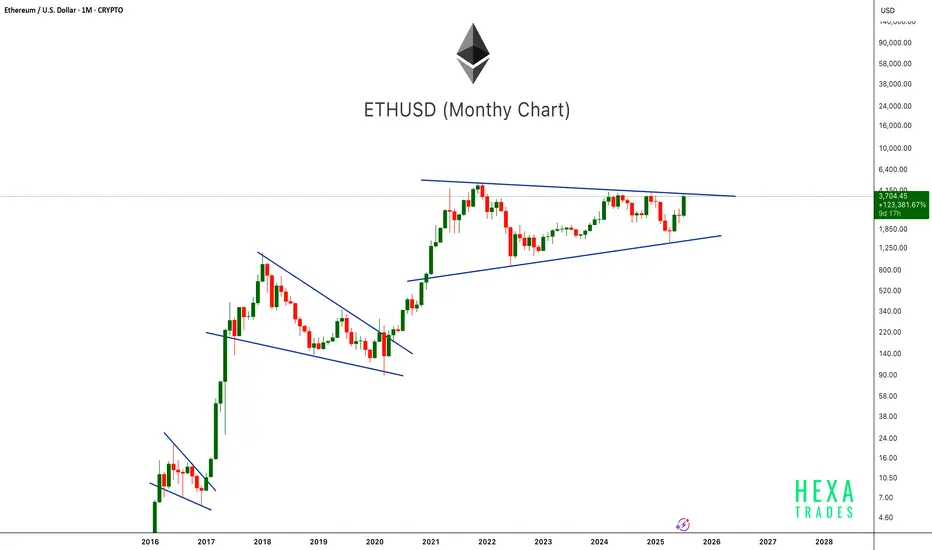
ETH Ready to Pop!ETHUSD is once again testing the upper boundary of a long-term symmetrical triangle on the monthly chart. This pattern has been forming since the 2021 peak, showing consistently higher lows and lower highs. Previous breakouts from similar consolidation patterns (2017 and 2020) led to massive rallies. With the current monthly candle showing strong bullish momentum, a confirmed breakout above this structure could mark the beginning of Ethereum's next major bull run. Keep an eye on the breakout level for confirmation.
Cheers
Hexa
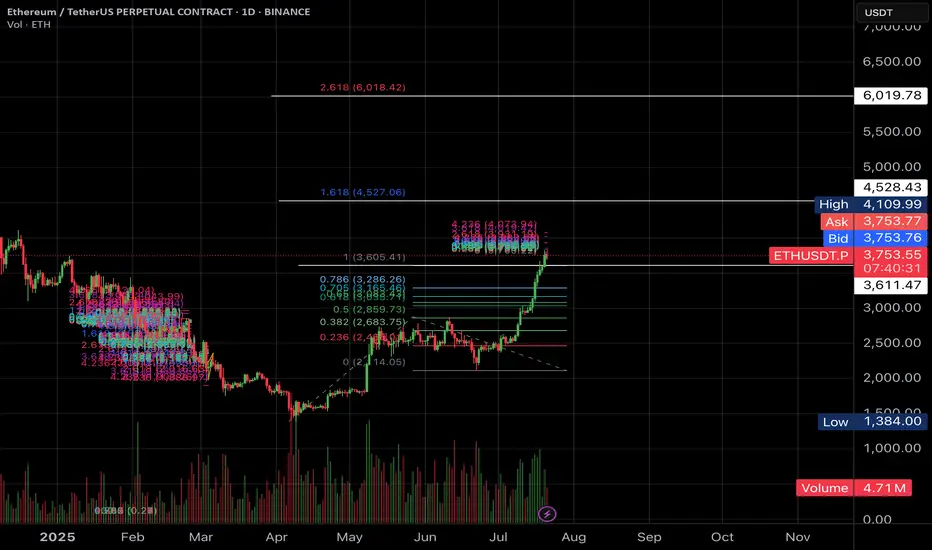
$6000 worth ETH?Hi Padawans,
ETH is showing strong bullish momentum, currently trading around $3,766. If it breaks above the resistance near $4,500–$4,900, the 2.618 Fibonacci extension points to a potential target around $6,000.
Best Regards,
CryptoObi
Bullish ETH Setup: $7,000, $10,000, and $13,000 TargetsHello✌
Let’s analyze Ethereum’s upcoming price potential 📈.
BINANCE:ETHUSDT , I expect a long-term upward bullish trend.
There are three main targets in this analysis: $7000, $10,000, and a final target of $13,000, which could be reached within 2 to 6 years.
The price may form parallel channels at times, which are clearly shown on the chart.
✨We put love into every post!
Your support inspires us 💛 Drop a comment we’d love to hear from you! Thanks , Mad Whale🐋
🐋Many of the points and levels shown on the chart are based on personal experience, feeling, and over 7 years of research and daily study of crypto charts.
Some of the lines, channels, and price zones are drawn to make the chart easier to understand and to help imagine possible future price movements.
I’ve also included one very big drop in price even bigger than the others because in the crypto market, it’s common for prices to suddenly fall hard and push out small investors and traders with positions.
The targets on the chart are not guaranteed; they might be reached, or they might not.📚
📜Please make sure to do your own research before investing, and review the disclaimer provided at the end of each post.

Altseason Loading?BTC Dominance chart has once again respected the long-term descending trendline resistance, showing a sharp monthly rejection. Historically, similar rejections have marked the beginning of ALT seasons, where capital flows out of Bitcoin into altcoins, boosting their performance significantly.
Chart Highlights:
-Major triangle pattern since 2017
-Clear rejections from the upper trendline coincide with previous ALT seasons (2018, 2021)
-Current rejection resembles those past cycles
-A move down in dominance could fuel strong altcoin rallies
If BTC dominance continues to decline, we could be entering another powerful altcoin season in the coming months.
Cheers
Hexa🧘♀️
CRYPTOCAP:BTC.D BINANCE:BTCUSDT

ETH Weekly Recap & Game Plan 20/07/2025📈 ETH Weekly Recap & Game Plan
🧠 Fundamentals & Sentiment
Market Context:
ETH continues its bullish momentum, driven by institutional demand and a supportive U.S. policy environment.
We captured strong profits by sticking to the plan (see chart below).
🔍 Technical Analysis
✅ Price has run into HTF liquidity at $3,750
📊 Daily RSI has entered the overbought zone, signaling potential short-term exhaustion.
We may see a brief retracement or LTF liquidity grabs, which could be enough to fuel a further push higher — potentially to $4,087.
🧭 Game Plan
I’m watching two key downside liquidity levels:
$3,534 (black line)
$3,464
A sweep of either could provide the liquidity needed for continuation toward $4,087.
⚠️ I’ll wait for LTF confirmation before entering a position.
📌 Follow for Weekly Recaps & Game Plans
If you find this analysis helpful, follow me for weekly ETH updates, smart money insights, and trade setups based on structure + liquidity.

LITCOIN BUY OR SELL !!!Hello friends🙌
🔊According to the price drop, you can see that the price has been below the specified resistance for a while and when it was able to break the resistance, it shows us the power of the buyers. Now, when we return to the previous resistance, which has now become a support, you can see that the buyers are providing good support and the price is expected to move to the specified targets.
Note that the most important rule in trading is capital and risk management So make sure to follow it.
🔥Follow us for more signals🔥
*Trade safely with us*

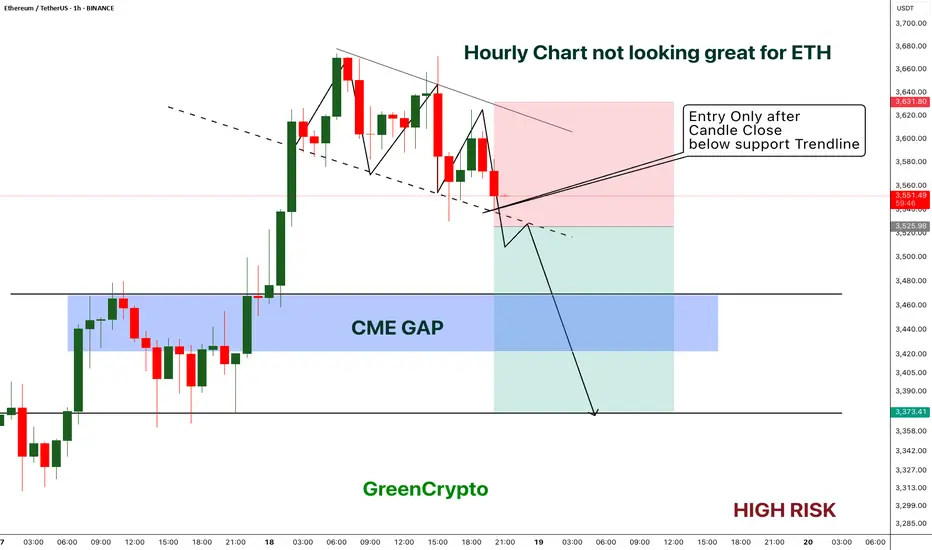
ETH - Short Trade with HIGH RISK- ETH got reject from resistance multiple times on 1H timeframe and now the price is playing near the support.
- I'm expecting overall market to cooldown this weekend, this could push the ETH to break the support
- ETH has CME gap around 3422 - 3467 range, im expecting this CME gap to be filled soon.
Entry Price: Below 3525
Stop Loss: 3631
TP1: 3471.15
TP2: 3381.76
Move SL to breakeven on TP1 hit.
Don't forget to keep stoploss.
Cheers
GreenCrypto
ETH Healthy Retest Before Next Rally!Ethereum continues to trade within a strong uptrend on the 1-hour chart, respecting the 100 EMA consistently throughout the rally. After a strong impulse move, the price is now consolidating near the recent highs.
ETH price could retest the 0.382 Fibonacci level and the 100 EMA before continuing upward. A successful retest would signal strength and could lead to a bullish continuation toward the $3900 - $4000 range.
Similar historical retests of the 100 EMA led to strong rallies, and we could see a repeat of that pattern if support holds.
Cheers
Hexa
BITSTAMP:ETHUSD CRYPTOCAP:ETH

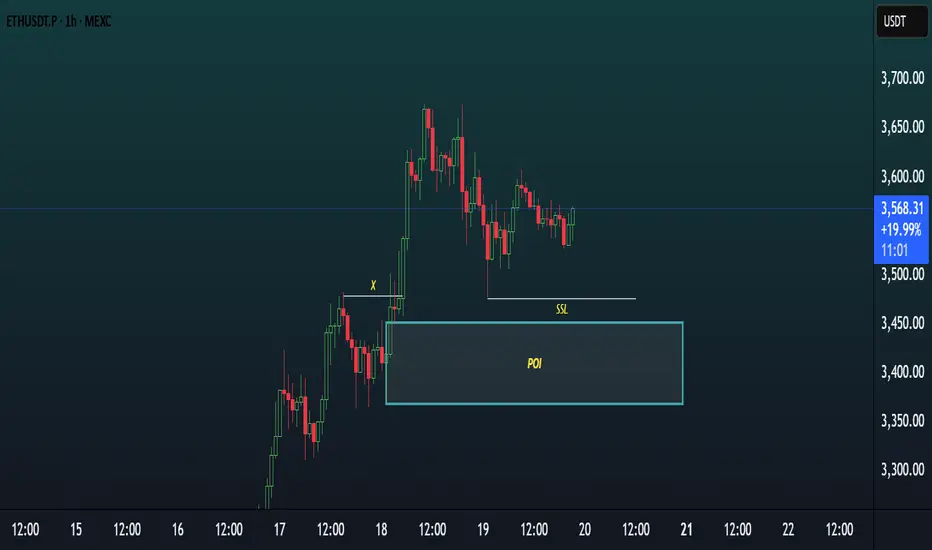
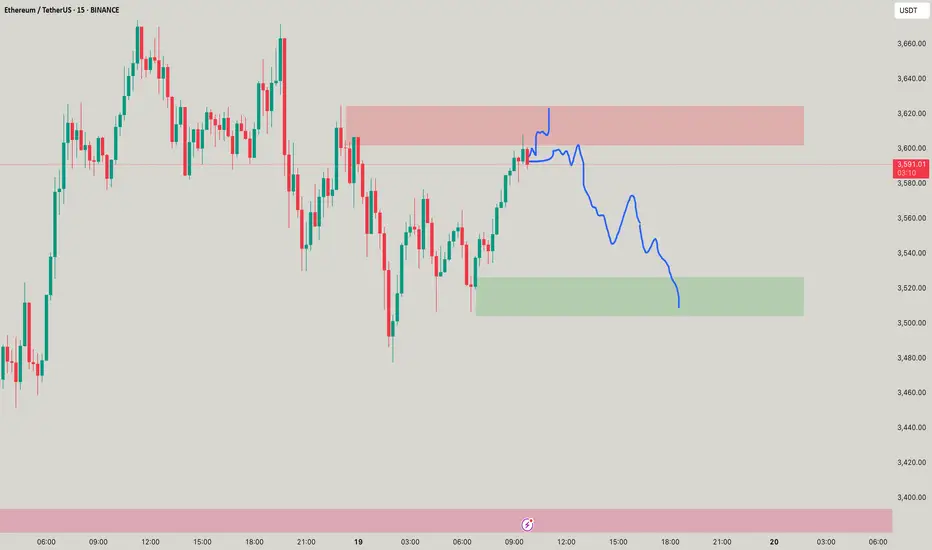
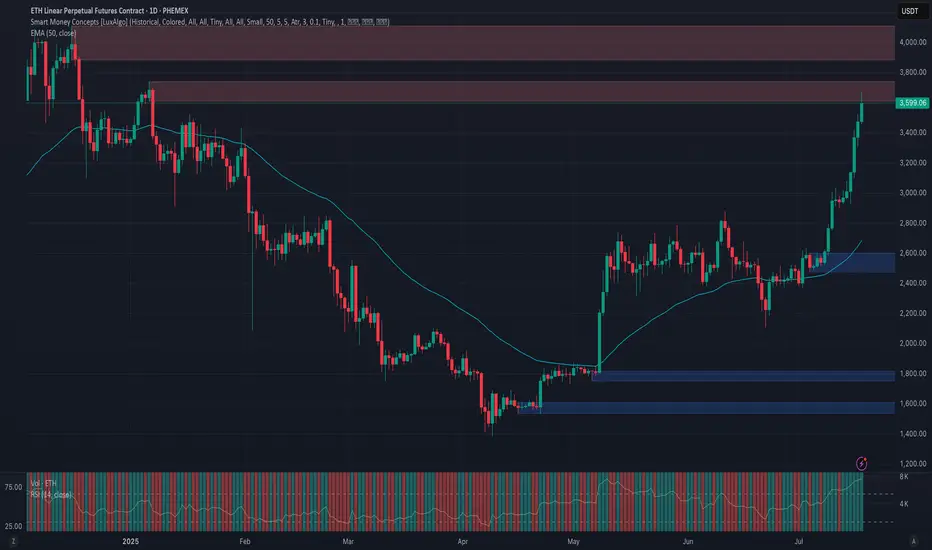
Chart Analysis (ETHUSDT, 1H)This chart showcases a Smart Money Concepts (SMC) style analysis on the 1-hour timeframe of ETHUSDT.P, focusing on a potential bullish setup.
Key Elements:
POI (Point of Interest)
A demand zone is clearly marked around the $3,400–$3,460 area, highlighted as a potential reversal zone where price may react bullishly.
SSL (Sell-Side Liquidity)
Sell-side liquidity has been swept below a recent low, indicating a possible liquidity grab before a reversal.
X (Previous Break of Structure)
Point “X” marks a significant BOS (Break of Structure) indicating bullish intent in prior price action.
Current Price Action
Price recently tapped into the POI, swept SSL, and is now consolidating slightly above the zone — suggesting accumulation or preparation for a bullish move.
Bias:
Bullish — Expecting a possible reversal or continuation to the upside after liquidity sweep and POI mitigation.
LINK START...Hello friends🙌
📈As you can see, the upward trend has started, and the power is in the hands of buyers, and here we have an opportunity to enter a buy trade with risk and capital management to move with the specified goals.
🔥Follow us for more signals🔥
*Trade safely with us*

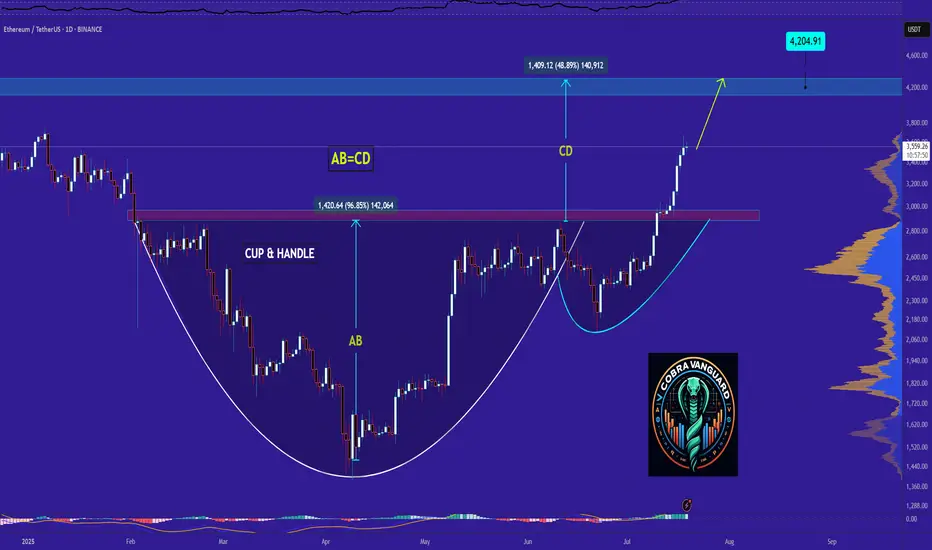
Ethereum - Time to buy again!Exactly, based on previous analyses, the price is rapidly approaching $4,000. But we need to be cautious because whenever it hits round numbers, something big usually happens!!!
previous analysis
Best regards CobraVanguard.💚
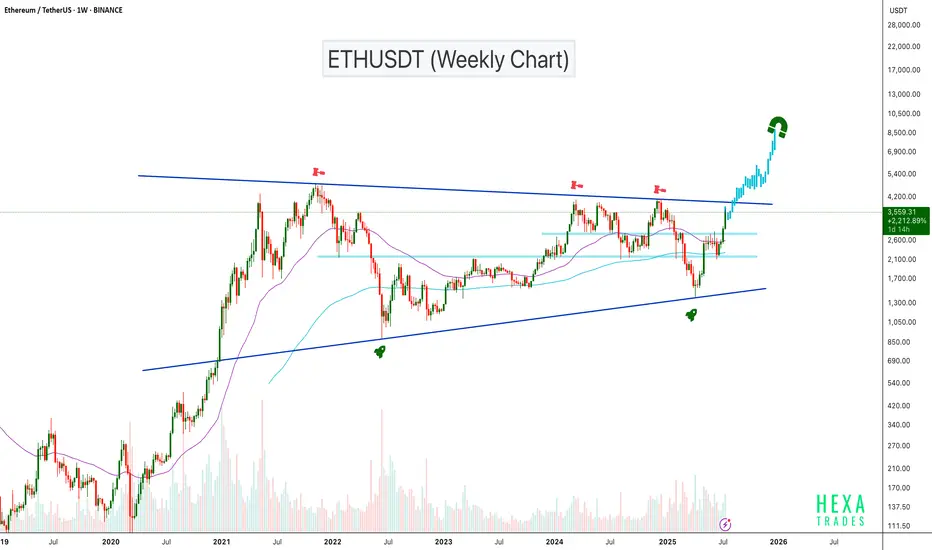
ETHUSDT Gearing Up for Explosive MoveBINANCE:ETHUSDT has been trading inside an ascending triangle pattern for the past 1,600 days. The price is now moving toward the triangle's resistance zone with strong volume support. A confirmed breakout above this resistance could trigger a powerful bullish move, with potential targets in the $6,000–$8,000 range.
Cheers
Hexa🧘♀️
BITSTAMP:ETHUSD
Altseason Starts Here? ETH Hits Critical Resistance!Ethereum has finally reached the upper resistance zone — and this could be the decisive moment for Altseason.
This level has historically acted as a major turning point for ETH. If it breaks and holds above this zone, we could see capital start flowing aggressively into altcoins.
🧠 Why it matters:
ETH reaching resistance usually signals a rotation phase from BTC to ETH.
If ETH breaks above, altcoins tend to follow with explosive momentum.
If it gets rejected, we may see a short-term cool-off.
This is the zone where narratives shift. Eyes on the breakout — or the rejection.

You need smol Scalps for ETH!ETH SMOL scalps but u know it takes your liquidity on top blowing ur accounf! Keep mindful where the trade goes! good short oppurtunity!
Ethereum · No Reason To Stop · Will Continue RisingEthereum will continue rising. Remember Ether is number two and it is awesome, to start, and it follows Bitcoin like darkness follows the light. There is no reason for Ether to move down. There is no necessity for ETH to stop its major advance, in fact, it has been lagging behind and it needs to catch up. Bitcoin is waiting and will continue waiting but it won't wait forever so Ethereum must wake up and is waking up. We are going up.
Ethereum has grown 165% since its 7-April low. This is more than XRP and its capital is twice as much. Boom! The best part? Ethereum will continue growing straight up for weeks and months. It needs to be trading at a new all-time high as soon as possible just so that the market can feel at ease and know, once again, that Crypto is here to stay.
What has been suppressed can't stay suppressed forever. Crypto went through a fight but challenges only made us that much stronger. We are now happy and grateful for everything that we went through because we know that we can take anything the world throws at us.
The chart. Green, green, green straight up. Two months of consolidation. That's the key. ETHUSDT went sideways for almost two months and this reveals what comes next. The advance outside the consolidation range has been happening for 8 days. 60 days of sideways can support at least an entire month of growth. When the entire month is consumed, we can expect a retrace, nothing more, followed by additional growth.
In short, Ethereum will continue rising. If you see a shakeout, know that growth will always resume in a matter of days. If you see a drop, know that this is a bear-trap, the bulls now own the game. If you are in doubt, come read my articles and I will publish something that you will understand and agree is right, so you can continue holding until you can reach the big prize.
The time to sell will come, but it isn't now. Right now is the time to hold strong. Not only Ethereum, but Cardano, XRP, BTC, Dogecoin, Solana and the rest of the altcoins. This is only the start.
I expect Ether will continue rising. $8,000 now looks like such an easy target...
Very good indeed. If you enjoy the content, follow me.
Namaste.

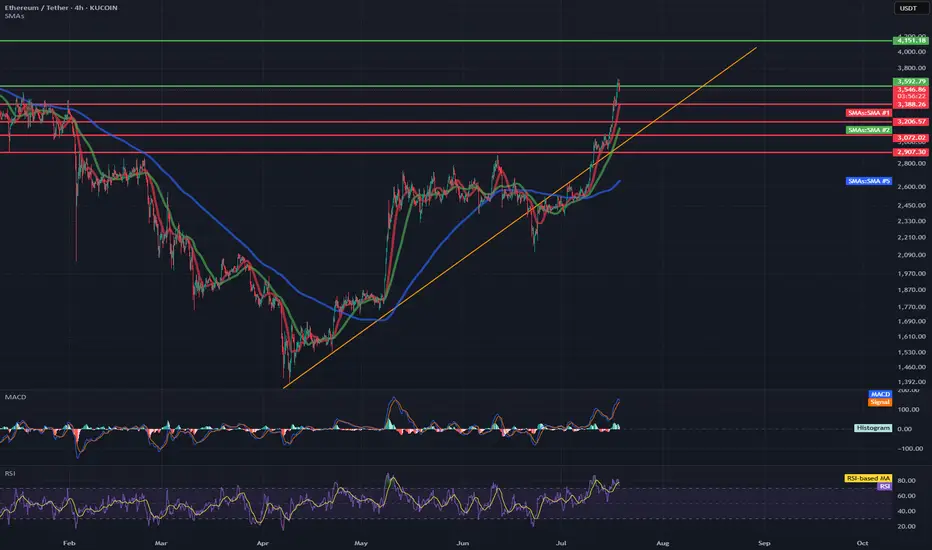
ETH/USDT 4H Chart✅ Market Trend and Structure:
Uptrend: The highlighted orange trend line shows continuous growth since mid-April. The price is trading above the 50- and 200-period moving averages (EMA and SMA), confirming bullish sentiment.
Current price: around 3556 USDT – very close to local highs.
Resistance break in the 3200–3300 USDT area, which now acts as support.
📈 Technical Levels:
Resistance (red horizontal lines):
3600–3650 USDT – local resistance resulting from market reaction.
3888 USDT – next historical resistance level.
4133 USDT – established long-term target (green dashed line at the top).
Support:
3300 USDT – strong support after a previous breakout.
3080 USDT – previous high, now the next support level.
3070 / 2900 USDT – key technical support levels in the event of a larger correction.
📊 Indicators:
MACD:
The MACD is in a strongly bullish zone, but:
The histogram is flattening.
A bearish crossover pattern is possible in the following candles – a signal of weakening momentum.
RSI:
RSI ~74 – is in the overbought zone, which often heralds a correction or at least consolidation.
A value above 70 confirms the bullish trend but may suggest that momentum is overheated.
📌 Conclusions and Scenarios:
🔼 Upside Scenario (trend continuation):
If the price remains above 3300–3350 USDT, it could move towards 3888, and then 4133 USDT.
A break above 3650 USDT on heavy volume will be a strong continuation signal.
🔽 Corrective scenario (short-term pullback):
The RSI and MACD suggest a possible correction.
Potential pullback to:
3300 USDT (retest of previous resistance as support).
SMA 200 (~2600 USDT) with a deeper downward move.
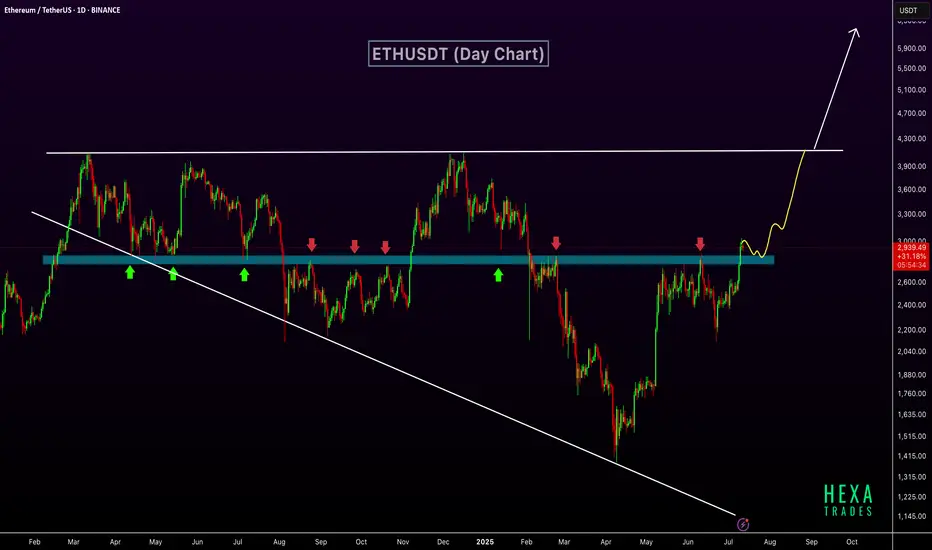
ETH Breaks Key Resistance – $6K Possible if Wedge BreaksETHUSDT has broken out above a key horizontal resistance zone that has historically acted as a strong support and resistance level. This zone, marked in blue, has seen multiple rejections and bounces over the past year, confirming its significance.
The recent breakout above this zone indicates a shift in market structure and suggests growing bullish momentum. The price action shows a clean move above resistance, with potential for a retest before continuing higher. The market is also forming a long-term broadening wedge pattern. The next target lies near the upper resistance of the wedge, around $4,000. If the price breaks above this broadening wedge, it could open the path toward the $6,000 level.
Regards
Hexa
ETH ~ It Gives you a chance ~ $4000 soon!ETH will soon go to $4000 bidding Lower TF for actual buys and shorts to stay till there, will post the buy moves soon!

ETHUSD - ANOTHER GROWING WEEK
ETHUSD - ANOTHER GROWING WEEK✅
ETHUSD has been growing all these days together with a bitcoin. All the news, listed in my previous post for the BTCUSD are also valuable here. Really nice fundamental support, people are purchasing the asset.
But what's with technicals? 📊
Compared to the bitcoin, ETHUSD hasn't reached ATH. According to a daily chart (pic 1), the price has been moving sideways since 2021 and a strong resistance is waiting ahead at 4,000.00. However, for now we are good. I bet that during upcoming days the asset will reach this level and rebound from it. Will it break the resistance? I think it is too early to make any conclusions.

Phemex Analysis #98: ETH Price Explodes— Is $5,000 Finally Next?Ethereum ( PHEMEX:ETHUSDT.P ) has recently shown impressive strength, surging past significant resistance levels and stirring excitement in the crypto market. After an extended consolidation, ETH decisively broke through the crucial $3,300 resistance level, rallying more than 15% in just three days, and is now trading confidently around $3,500.
This renewed bullish momentum has traders and investors eagerly speculating: Could this be the start of Ethereum's next major run? Or should caution prevail amid ongoing market uncertainty? To help navigate this critical period, let's explore several key trading scenarios.
Possible Scenarios
1. Bullish Continuation – Targeting New Highs
Ethereum’s recent breakout above the $3,300 resistance signals strong bullish sentiment. If buying volume continues increasing, ETH could swiftly move towards higher resistance levels at $3,800 and potentially challenge the psychological milestone of $4,100.
Pro Tips:
Profit Targets: Consider locking in partial profits as ETH approaches strong resistance zones around $3,800 and $4,100.
Risk Management: Place tight stop-loss orders on recent lows, approximately around $2,902 to minimize downside risks.
2. Short-term Retracement – Healthy Pullback
Given ETH’s rapid surge, a short-term pullback to retest the recently broken resistance zone at $3,300 to $3,000 (now acting as strong support zone) is plausible. A successful retest would strengthen the bullish case, signaling healthy consolidation before further upward momentum.
Pro Tips:
Buying the Dip: If ETH holds above $3,000 with declining volume, consider cautiously adding to your positions or initiating new longs.
Volume Confirmation: Closely watch trading volume; lower volume during pullbacks typically indicates a healthy retracement rather than a bearish reversal.
3. Bearish Reversal – Breaking Below Critical Support
If Ethereum’s price experiences heavy selling pressure and breaks below the key support at $3,000, bearish sentiment could escalate, potentially driving ETH towards lower support levels near $2,470 and possibly even $2,110.
Pro Tips:
Short Positions: Experienced traders might consider initiating short positions if ETH decisively breaks below the crucial $3,000 support zone on increasing selling volume.
Long-term Accumulation: Long-term investors may strategically accumulate ETH near stronger support areas at $2,470 and $2,110, after clear signs of price stabilization.
Conclusion
Ethereum (ETH) currently offers attractive opportunities, propelled by recent bullish momentum yet balanced by market uncertainties. Traders must closely observe key resistance at $4,000, critical support around $3,000, and carefully analyze trading volumes for confirmation of market direction. By maintaining disciplined risk management and strategically capitalizing on outlined scenarios, investors can effectively navigate ETH’s price action in the weeks ahead.
🔥 Tips:
Armed Your Trading Arsenal with advanced tools like multiple watchlists, basket orders, and real-time strategy adjustments at Phemex. Our USDT-based scaled orders give you precise control over your risk, while iceberg orders provide stealthy execution.
Disclaimer: This is NOT financial or investment advice. Please conduct your own research (DYOR). Phemex is not responsible, directly or indirectly, for any damage or loss incurred or claimed to be caused by or in association with the use of or reliance on any content, goods, or services mentioned in this article.
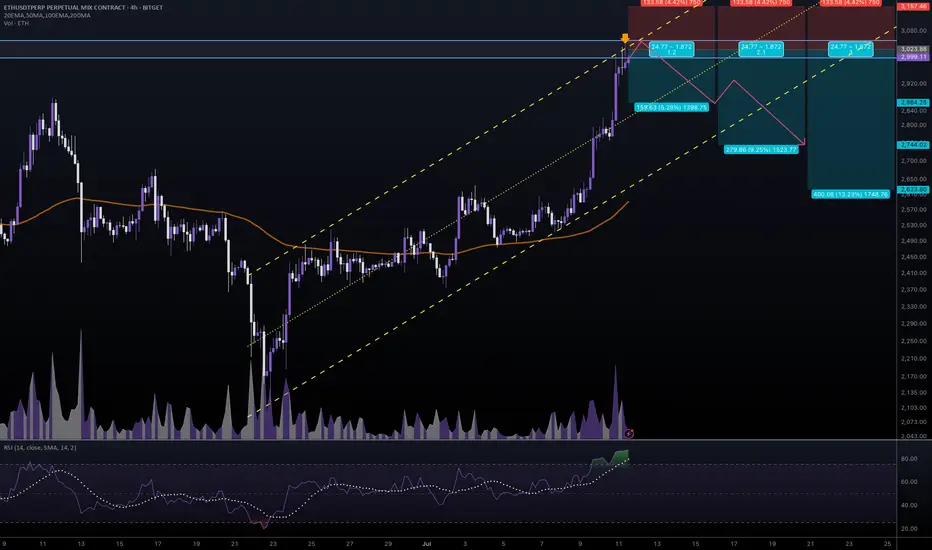
#ETHUSDT #4h (Bitget Futures) Ascending channel on resistanceEthereum printed a gravestone doji followed by a shooting star, RSI is overbought, local top seems in.
⚡️⚡️ #ETH/USDT ⚡️⚡️
Exchanges: Bitget Futures
Signal Type: Regular (Short)
Leverage: Isolated (9.0X)
Amount: 5.0%
Entry Zone:
2996.99 - 3050.49
Take-Profit Targets:
1) 2864.25
2) 2744.02
3) 2623.80
Stop Targets:
1) 3157.46
Published By: @Zblaba
CRYPTOCAP:ETH BITGET:ETHUSDT.P #4h #Ethereum #PoS ethereum.org
Risk/Reward= 1:1.2 | 1:2.1 | 1:3.0
Expected Profit= +47.5% | +83.3% | +119.0%
Possible Loss= -39.8%
Estimated Gaintime= 1-2 weeks