EU–India Trade Deal: Long-Term Opportunity📌 What Happened
• Historic free trade agreement signed between the EU and India after ~20 years of talks.
• It will eliminate or sharply reduce tariffs on ~96.6% of goods by value over time and open up services markets.
• Trade between the two blocs encompasses about €120‑140+ billion annually and could grow significantly.
• The agreement still needs to be ratified by the European Parliament and India’s legislature before it fully takes effect.
🧭 Key Sectors Likely to Benefit
In assessing investment opportunities, the deal’s tariff eliminations and market access improvements point clearly to specific sectors that could see accelerated export growth, higher earnings, and improved valuation multiples, especially in India but also in EU companies that serve Indian demand.
🇮🇳 Indian Export‑Oriented Sectors
1. Textiles & Apparel
Already a huge employer and export engine in India. Tariffs to the EU will go to zero, making Indian textiles far more competitive versus Bangladesh/Vietnam.
👉 Investment proxies:
Indian textile & apparel stocks; consider global funds with emerging market exposure to Indian manufacturing.
2. Gems & Jewellery
Full duty‐free access to a $79B EU market could double bilateral trade.
3. Leather & Footwear
Tariffs eliminated, boosting clusters in Kanpur, Kolhapur, etc.
4. Chemicals & Specialty Manufacturing
Access to the EU’s industrial market supports Indian chemical producers and export‐oriented clusters.
5. Pharmaceuticals & Healthcare
EU tariffs on medicines will drop, and regulatory cooperation may speed approvals, big win for Indian generics and exporters.
6. Engineering & Industrial Goods
Zero tariffs/open market for machinery, electronics, and advanced components enhances Indian industrial exports.
7. Marine Products & Agriculture Value Chains
Tea, spices, seafood, and processed foods to benefit from access and streamlined customs.
8. Services (IT, BPO, Professional Services)
Predictable EU access for Indian IT & services (144 sub‑sectors) promises growth in high‑margin services exports.
🇪🇺 European Exporters & Sector Gains
The deal isn’t only for India; several European industries also gain better market access:
1. Automotive & Machinery
Tariffs on machinery, cars, tools, aircraft parts cut dramatically. Big for German, French, Italian exporters.
2. Pharmaceuticals & Medical Devices
EU pharma makers face lower Indian barriers; services tie‑ups expand reach.
3. Chemicals & Industrial Equipment
EU chemical exporters and capital goods makers benefit from improved Indian access.
4. Luxury Goods & Wine/Spirits
Significant tariff reductions for wine, spirits, and high‑end consumer goods.
5. Financial Services & IP‑Driven Sectors
EU firms in banking, insurance, and professional services get expanded regulatory access.
🧠 Risks & Timeframes to Consider
⚠️ Implementation timing: This deal needs ratification and has phased tariff cuts over years, not instant wins.
⚠️ Agriculture exposed sectors like dairy, sugar, cereals are excluded.
⚠️ Services & regulatory reforms take time, the benefits for IT and finance (banks, etc) may be more structural and medium to long‑term.
⚠️ Currency & global macro risk matters for cross‑border investing.
📈 EU–India Trade Deal: Potential Investment Themes & ETFs
🟢 CORE INDIA EXPOSURE
iShares MSCI India ETF (INDA)
Industries: Banks, IT services, energy, consumer staples
Risk: 🟢🟡 Medium
Role: Broad India exposure
Portfolio Fit: Conservative / Balanced
Deal Relevance: Indirect, late-cycle
Notes: Safe, broad India exposure, but dilutes trade-deal alpha (heavy bank weighting = late-cycle). Avoid broad "India" exposure (INDA) if your specific goal is to capture the Trade Deal upside.
iShares India 50 ETF (INDY)
Industries: Mega-cap banks, IT, conglomerates
Risk: 🟢🟡 Medium
Role: Large-cap India anchor
Portfolio Fit: Conservative
Deal Relevance: Low–Medium
Notes: Large-cap anchor, highly liquid; low sensitivity to trade-deal themes, bank-heavy.
🟡 I NDIA EXPORT / EARNINGS LEVERAGE
WisdomTree India Earnings ETF (EPI)
Industries: Exporters, industrials, IT, diversified earnings
Risk: 🟡 Medium–High
Role: Earnings-weighted India
Portfolio Fit: Balanced / Aggressive
Deal Relevance: High
Notes: One of the best single-ETF expressions of the deal. Exporters and industrials well represented; high trade-deal leverage, medium-high volatility.
iShares MSCI India Small-Cap ETF (SMIN)
Industries: MSMEs, manufacturing, domestic + export firms
Risk: 🔴 High
Role: Export elasticity
Portfolio Fit: Aggressive only
Deal Relevance: Very High
Notes: Very high volatility; strong exposure to exporters and tariff-sensitive MSMEs; best for aggressive traders.
🔧 INDIA INDUSTRIAL / MANUFACTURING
iShares MSCI India UCITS ETF (NDIA / QDV5)
Industries: Broad India exposure — banks, IT, industrials, consumer, conglomerates
Risk: 🟡 Medium–High
Role: Structural India equity with some industrial/export representation
Portfolio Fit: Balanced / Aggressive
Deal Relevance: Medium–High
Notes: Notes: Broad India industrials included but diluted by IT/financials; medium–high risk; structural long-term India exposure. Better for general export/earnings theme than pure industrial play
🇮🇳 INDIA - Additional ETFs & Stocks
Mirae Asset Nifty India Manufacturing ETF (MAKEINDIA)*
Industries: Indian manufacturing sector (capital goods, industrials)
Risk profile: 🟡 Medium–High
Role: Focused exposure to India’s manufacturing ecosystem
Fits: Balanced / Aggressive
Deal relevance: High
Notes: Thematic India manufacturing exposure; more industrial than broad India ETFs; good for direct tariff‑linked growth capture. About 30-40% of MAKEINDIA holdings directly benefit from EU trade deal, rest is energy/defense/commodities
Nippon India Nifty Pharma ETF (PHARMABEES)*
Industries: Pharmaceuticals & healthcare
Risk profile: 🟡 Medium
Role: Targeted Indian pharma exposure
Fits: Balanced
Deal relevance: Medium–High
Notes: Pharma is a key export sector with tariff/market‑access gain potential; less volatile than small caps
* MAKEINDIA & PHARMABEES enhance sector focus compared with broad India ETFs.
Manufacturing and pharma are among the areas with early visible tariff/market access benefits.
🇮🇳 INDIA Potential Individual Stocks to Watch
ETF exposure in key export sectors remains diluted or incomplete. Select individual stocks provide more direct, higher-sensitivity exposure to EU–India trade dynamics. These are suggestions to maybe look into. Not a call, not a deep dive. Do your own diligence.
Textiles & Apparel
Gokaldas Exports (NSE: GOKEX)
Industries: Garment manufacturing & export
Risk: 🔴 High
Role: Direct textile exporter to US/EU/UK
Portfolio Fit: Aggressive / Thematic
Deal Relevance: Very High
Notes: Pure export play; direct beneficiary of EU tariff reductions
KPR Mill (NSE: KPRMILL)
Industries: Vertically integrated textiles (yarn → fabric → garments)
Risk: 🔴 High
Role: Export-oriented textile manufacturer
Portfolio Fit: Aggressive / Thematic
Deal Relevance: Very High
Notes: Strongly tied to global textile demand; cyclical
Arvind Ltd (NSE: ARVIND)
Industries: Denim & textile manufacturing
Risk: 🟡 Medium–High
Role: Large-scale textile exporter
Portfolio Fit: Balanced / Aggressive
Deal Relevance: High
Notes: Major denim exports to US/EU/Asia; moderate volatility
Gems & Jewelry
Titan Company (NSE: TITAN)
Industries: Jewelry manufacturing & retail (Tanishq brand)
Risk: 🟡 Medium
Role: Export + domestic jewelry market
Portfolio Fit: Balanced / Thematic
Deal Relevance: Medium–High
Notes: Luxury and retail; indirect EU exposure
Kalyan Jewellers (NSE: KALYANKJIL)
Industries: Jewelry retail & manufacturing
Risk: 🟡 Medium
Role: Export + domestic market
Portfolio Fit: Balanced
Deal Relevance: Medium
Notes: Mostly domestic; some EU exports; tariff-sensitive
Rajesh Exports (NSE: RAJESHEXPO)
Industries: Gold products & jewelry export
Risk: 🟡🟠 Medium–High
Role: Direct exporter to EU/US
Portfolio Fit: Aggressive / Thematic
Deal Relevance: High
Notes: High export share; strongly benefits from EU tariff reduction
Leather & Footwear
Bata India (NSE: BATAINDIA)
Industries: Footwear manufacturing & retail
Risk: 🟡 Medium
Role: Export + domestic footwear
Portfolio Fit: Balanced
Deal Relevance: Medium
Notes: Established brand; benefits from EU market access
Mirza International (NSE: MIRZAINT)
Industries: Leather goods & footwear export
Risk: 🟡🟠 Medium–High
Role: Direct export-oriented leather & footwear
Portfolio Fit: Aggressive / Thematic
Deal Relevance: High
Notes: Tariff-sensitive EU exporter
Relaxo Footwears (NSE: RELAXO)
Industries: Footwear manufacturing
Risk: 🟡 Low–Medium
Role: Primarily domestic, some export
Portfolio Fit: Balanced
Deal Relevance: Low
Notes: Limited EU exposure. Included for sector completeness; minimal trade deal impact.
Chemicals
Atul Ltd (NSE: ATUL)
Industries: Specialty chemicals & pharma intermediates
Risk: 🟡 Medium
Role: Export-focused chemical manufacturer
Portfolio Fit: Balanced / Aggressive
Deal Relevance: High
Notes: Strong EU/US export exposure; benefits from trade-deal access
SRF Ltd (NSE: SRF)
Industries: Chemicals, technical textiles, refrigerant gases
Risk: 🟡🟠 Medium–High
Role: Industrial chemicals & specialty products
Portfolio Fit: Balanced / Aggressive
Deal Relevance: High
Notes: Direct exposure to EU industrial demand
Navin Fluorine (NSE: NAVINFLUOR)
Industries: Fluorochemicals & CDMO services
Risk: 🟡 Medium
Role: Specialty chemicals & pharma intermediates
Portfolio Fit: Balanced
Deal Relevance: Medium–High
Notes: Indirect EU exposure via specialty chemicals
🇪🇺 EUROPEAN EXPORTERS
SPDR MSCI Europe Industrials UCITS ETF (STQ)*
Ticker: (varies by listing; commonly appears on EU/UK exchanges)
Industries: European industrials, manufacturing, export capital goods
Risk profile: 🟡 Medium–High
Role: Targeted EU industrial exporters
Fits: Balanced / Aggressive
Deal relevance: High
Notes: Concentrated industrial exposure beyond broad Europe, ideal for structural trade‑linked plays
iShares STOXX Europe 600 Industrial Goods & Services UCITS ETF (EXH4)*
Industries: Industrial goods, services, machinery, automation
Risk profile: 🟡 Medium–High
Role: Export‑oriented industrial sector exposure
Fits: Balanced / Aggressive
Deal relevance: High
Notes: Complements INDU and EZU by emphasizing industrial goods & services across Europe; suitable for capturing EU export demand to India
Vanguard FTSE Europe ETF (VGK)
Industries: Industrials, luxury, pharma, autos
Risk: 🟡 Medium
Role: EU exporter exposure
Portfolio Fit: Conservative / Balanced
Deal Relevance: Medium
Notes: Broad EU exporter exposure; less targeted to India, moderate risk; suitable for balanced portfolios.
iShares MSCI Eurozone ETF (EZU)
Industries: Eurozone industrials, machinery, chemicals
Risk: 🟡 Medium
Role: Euro-area exporters
Portfolio Fit: Balanced
Deal Relevance: Medium
Notes: Industrial-heavy Eurozone exposure; medium risk; better for manufacturing/export focus than VGK.
iShares STOXX Europe 600 Industrials ETF (INDU)
Industries: Machinery, automation, transport (industrial exporters)
Risk: 🟡🟠 Medium–High
Role: EU capital goods / industrial exporters
Portfolio Fit: Balanced / Aggressive
Deal Relevance: High
Notes: Targeted industrial exporters (Germany/Italy focus); high trade-deal leverage; medium–high risk.
* SPDR and EXH4 provide more targeted industrial/export exposure than broad VGK.
Useful for emphasizing EU manufacturing linkages in a trade‑deal theme.
🍾 EUROPEAN LUXURY / CONSUMER EXPORTS
Amundi S&P Global Luxury ETF (LUXU)
Industries: Luxury goods, spirits, fashion
Risk: 🟠 Medium–High
Role: Indian consumption growth
Portfolio Fit: Aggressive / Thematic
Deal Relevance: Medium
Notes: Notes: High exposure to luxury goods benefiting from rising Indian consumption; medium–high risk; thematic play. Sensitive to India’s upper-middle-class expansion
🌍 GLOBAL TRADE / SUPPLY CHAIN THEMES
KraneShares MSCI One Belt One Road ETF (OBOR)
Industries: Infrastructure, logistics, trade corridors
Risk: 🟡🟠 Medium–High
Role: Trade re-routing
Portfolio Fit: Balanced / Aggressive
Deal Relevance: Indirect, structural
Notes: Notes: Broad EM exposure including India; diluted trade-deal sensitivity; medium risk; highly liquid, widely followed. Excellent regime-agnostic exposure
iShares MSCI Emerging Markets ETF (EEM)
Industries: Broad EM exposure — China, India, South Korea, Taiwan, Brazil
Risk: 🟡 Medium
Role: EM trade spillover / macro exposure
Portfolio Fit: Conservative / Balanced
Deal Relevance: Low–Medium
Notes: Notes: Broad EM exposure including India; medium risk; trade-deal sensitivity diluted; useful for EM spillover and macro hedge. So, India included but diluted; highly liquid, widely followed
🏗️ INFRASTRUCTURE / LOGISTICS
Global X Infrastructure ETF (PAVE)
Industries: Transport, logistics, construction
Risk: 🟡 Medium
Role: Physical trade capacity
Portfolio Fit: Balanced
Deal Relevance: Medium
Notes: Notes: Capital-intensive infrastructure and logistics exposure; medium risk; benefits from capex cycles and trade expansion.
🧾 Where Value Might Accumulate
Short‑to‑mid term (~1‑3 yrs):
Export‑focused Indian sectors (textiles, pharma, chemicals) likely to see early impacts as tariffs drop.
European industrial exporters adjust supply chains to India’s growing demand.
Mid‑to‑Long term (~3‑7 yrs):
Services trade expansion, supply chain realignments, intellectual property cooperation.
Deepening bilateral investment flows and potential FDI increases.
🎯📌 Slot Word EU–India Trade Deal Strategy
The EU–India free trade agreement creates a structural long-term growth theme for Indian exporters, industrials, and EU exporters tied to the Indian market. In periods of rising global stress, markets tend to de-risk by selling emerging market equities first and asking questions later. Structural themes are often punished alongside cyclical risk. The EU–India trade deal represents a long-term shift in trade, supply chains, and services that extends beyond the current cycle. Any crisis-driven EM selloff could therefore present a compelling buy-the-dip opportunity, as capital ultimately repositions toward durable, geopolitically aligned, and sustainable growth. Short- to mid-term volatility may offer opportunities to capitalize on dislocations, but the strategy is valid under multiple market scenarios:
Scenario 1 Soft Landing / Moderate Growth:
Accumulate and position long-term in EM/India ETFs with structural EU–India exposure. Even without a crash, tariff reductions, market access, and services liberalization support steady earnings growth, allowing investors to capture medium to long term structural alpha.
Scenario 2 Policy Failure / Market Shock:
Tactical buy-the-dip (BTFD) in EM/India ETFs focusing on exporters and industrials, while maintaining EU trade-deal exposure. In a crisis-driven selloff, highly liquid ETFs allow fast repositioning, benefiting from eventual recovery and structural trade gains.
✅ Key points:
India: Exporters, small-caps, and industrials stand to benefit most from tariff cuts and market access.
Europe: Industrial and luxury exporters gain from new Indian demand and reduced barriers.
Global / EM: Trade corridors, logistics, and EM spillovers complement the opportunity.
🚨 Thesis Invalidation Signals:
❌ EU Parliament rejects ratification (watch Feb 2026 vote)
❌ India imposes export restrictions on textiles
❌ Rupee strengthens >10% vs Euro (hurts export competitiveness)
❌ Global recession kills EU demand for Indian goods, but might offer a solid BTFD when the dust settles
Risk Warning:
📌 Note the sensitivity to US Tariffs and Global Cotton Prices, which are the primary risks for this specific sector.
📌 Carbon Border Adjustment Mechanism (CBAM) is a major headache for Indian steel/aluminum exporters. The deal helps, but CBAM remains a structural cost that could eat into the benefits for the "Engineering" sector.
EU

EURUSD Weekly planI expect a continuation of the bullish 1W OF and will consider a trade in case of a pullback into the 1W OB zone.

EURUSD — FRGNT DAILY CHART FORECAST Q1 | D22 | W3 | Y26📅 Q1 | D22 | W3 | Y26
📊EURUSD — FRGNT DAILY CHART FORECAST
🔍 Analysis Approach
I’m applying a developed version of Smart Money Concepts, with a structured focus on:
• Identifying Key Points of Interest (POIs) on Higher Time Frames (HTFs) 🕰️
• Using those POIs to define a clear and controlled trading range 📐
• Refining those zones on Lower Time Frames (LTFs) 🔎
• Waiting for a Break of Structure (BoS) as confirmation ✅
This process keeps me precise, disciplined, and aligned with market narrative, rather than reacting emotionally or chasing price.
💡 My Motto
“Capital management, discipline, and consistency in your trading edge.”
A positive risk-to-reward ratio, combined with a high-probability execution model, is the backbone of any sustainable trading plan 📈🔐
⚠️ On Losses
Losses are part of the mathematical reality of trading 🎲
They don’t define you — they are necessary, expected, and managed.
We acknowledge them, learn, and move forward 📊➡️
🙏 I appreciate you taking the time to review my Daily Forecast.
Further context and supporting material can be found in the Links section.
Stay sharp 🧠
Stay consistent 🎯
Protect your capital 🔐
— FRGNT 🚀📈
FX:EURUSD

Downtrend to continue: Next target 1.140EURUSD downtrend on daily chart in place, though we might see a minor pullback (especially if price makes HH on daily tomorrow): minor uptrend on hourly / 4hrs chart (price did make HH on 4 hrs today) - which I dont find safe to trade by going against the daily downtrend anyway. And even that pullback is not guaranteed as it might not even happen. In this situation, I am looking only for shorts with ultimate target at 1.140. At 1.140 we are very likely to see a major daily pullback reversal to 1.160, which might take many days / a few weeks. Hence I would exit and secure profits at 1.140 if you are in long-term positions.
FOR EDUCATIONAL PURPOSES ONLY

EURUSD TIMEFRAME-BY-TIMEFRAME ANALYSIS# 💱 EURUSD (EUR/USD) COMPREHENSIVE TECHNICAL ANALYSIS 🎯
## Week of November 10-14, 2025 | Intraday & Swing Trade Mastery
Close Price: 1.15640 | Entry Point: November 8, 2025, 12:54 AM UTC+4 📊
## 🔍 EXECUTIVE SUMMARY - MULTI-TIMEFRAME PERSPECTIVE
EUR/USD is trading at a critical technical inflection point with strong multi-timeframe alignment signaling imminent directional breakout. Elliott Wave analysis reveals completion of corrective cycles, positioning for next impulse leg targeting 1.1650-1.1750 extension zone with substantial momentum. Bollinger Bands display classic compression squeeze pattern —volatility condensation preceding directional explosion. RSI across all timeframes maintains neutral-bullish bias (52-65 range)—optimal momentum positioning without extreme overbought conditions. Volume clustering at 1.1550-1.1630 represents significant institutional accumulation foundation. Wyckoff spring tests near 1.1500-1.1520 provide aggressive entry triggers. Harmonic pattern convergence at 1.1680-1.1750 resistance signals breakout confirmation with measured move targets extending to 1.1850+. ECB/Fed policy divergence supports directional clarity emerging this week.
## 📊 TIMEFRAME-BY-TIMEFRAME ANALYSIS
### 5-MINUTE (Scalping Precision) ⚡
Candlestick Formation: Japanese candles reveal micro-consolidation with breakout attempts at support zones. Evening Star rejection formations detected at 1.1680-1.1710 intraday resistance creating short opportunities.
Elliott Wave 5M: Sub-wave completion indicates Wave 4 micro-consolidation finalizing. Wave 5 breakout anticipated above 1.1650-1.1680 with targets 1.1720-1.1780 (measured move).
Bollinger Bands: Upper compression mode—middle band at 1.1630 acts as pivot point. Lower band rejection (1.1550-1.1580) creates scalp-long setups with excellent risk/reward ratios.
RSI (14) Analysis: RSI oscillating 48-62 range—neutral territory with minor divergences forming. Bullish divergence at 1.1550 support signals buyer engagement; caution on 68+ resistance approach.
Micro Support/Resistance: 1.1550 (micro-support) | 1.1600 (POC cluster) | 1.1640 (pivot) | 1.1690 (intraday resistance) | 1.1740 (scalp target)
Volume Signature: Volume concentrated 1.1600-1.1660 zone—institutional marker established. Breakout volume >50% above average required above 1.1690 for sustained move above 1.1750.
VWAP Alignment: Price oscillating around session VWAP at 1.1625—each touch generates scalp opportunity. Upper VWAP band at 1.1710; lower support at 1.1550.
### 15-MINUTE (Quick Swing Gateway) 🎢
Candlestick Patterns: Engulfing bars forming at support zones—bullish engulfing at 1.1570 zone confirms reversal attempts. Three-candle patterns (flag continuation) with 50-80 pips breakout potential.
Harmonic Pattern Recognition: Gartley Pattern potential completion near 1.1560-1.1620 PRZ (Potential Reversal Zone). Exceptional risk-reward at 1:3.5 for harmonic traders. Butterfly variant also forming.
Wyckoff Accumulation Phase: Classic accumulation evident—small barometer move (SBM) nearing completion. Spring test anticipated 1.1480-1.1510 zone; markup phase targets 1.1750-1.1850.
Bollinger Bands (15M): Band squeeze intensifying—historical volatility expansion suggests 70-120 pips moves follow. Upper band resistance at 1.1740; lower band support at 1.1520.
Volume Profile (15M): Point of Control (POC) at 1.1630—prime concentration zone. Volume surge >55% required confirming breakout above 1.1710. Imbalances favor upside significantly.
Ichimoku Cloud (15M): Price consolidating below cloud edge—Tenkan-sen at 1.1700 = resistance pivot. Kijun-sen (1.1660) = critical secondary support. Cloud support 1.1540-1.1610.
EMA Structure: EMA 9 (1.1650) above EMA 21 (1.1610)—bullish alignment confirmed. Price above both = intraday strength maintained.
### 30-MINUTE (Intraday Swing Axis) 🔄
Pattern Formation: Symmetrical Triangle pattern consolidating with apex near 1.1700. Ascending triangle variant shows bullish bias—breakout above 1.1680 targets 1.1780-1.1850 extension.
Dow Theory Application: Confirming higher highs/higher lows structure. Secondary trend bullish; pullbacks to EMA 20 (1.1640) = optimal swing entry zones identified.
RSI Divergence Setup: Positive RSI divergence confirmed—price making lower lows (1.1540) while RSI forms higher lows (42 level). Classic reversal setup targeting 1.1720 minimum.
Exponential Moving Average: EMA 9 (1.1665) = core support pivot. EMA 21 (1.1610) = secondary support. EMA 50 (1.1500) = structural hold level. Bullish ribbon alignment intact.
Support Architecture: 1.1500 (EMA 50/structural) | 1.1560 (demand zone) | 1.1610 (volume cluster) | 1.1650 (EMA 9 dynamic)
Resistance Architecture: 1.1680 (triangle formation) | 1.1750 (measured move target) | 1.1800 (weekly resistance) | 1.1850 (extension)
Volume Analysis (30M): Increasing volume on recent bars—accumulation signature strong. Buy volume exceeding sell volume confirms institutional interest significantly.
### 1-HOUR (Core Swing Trade Engine) 🎯
Elliott Wave Structure: Major wave analysis suggests Wave 3 completion near 1.1750. Current Wave 4 correction targets 1.1650-1.1700 support zone. Wave 5 impulse anticipated—target: 1.1850-1.1950.
Pennant Formation: Classic Bullish Pennant pattern forming—breakout confirmation above 1.1710 validates pattern. Pole height measured move = 1.1850+ realistic target.
Bollinger Bands (1H): Upper band at 1.1800 = squeeze breakout target. Middle band (1.1700) = bullish support zone. Lower band rejection (1.1500) creates swing longs with excellent R/R.
VWAP Daily: EUR/USD trading above daily VWAP at 1.1600—bullish gradient confirmed. Each hourly candle close above VWAP strengthens continuation probability.
Volume Profile Hotspot: Heavily traded at 1.1600-1.1660 (accumulation zone) and 1.1710-1.1780 (resistance cluster). Imbalances above 1.1800 suggest vacuum-fill potential.
Ichimoku Cloud Alignment: Price above Senkou Span A (1.1700) & Span B (1.1660)—cloud thickness indicates strong support. Chikou Span above candles = bullish confirmation. Cloud color: BULLISH GREEN.
Gann Theory Application: 45-degree angle from swing low (1.1450) establishes rally trajectory. Resistance at 38.2% Fibonacci extension (1.1750) precedes aggressive breakout phase.
Support Tiers 1H: 1.1500 (structural hold) | 1.1570 (EMA support) | 1.1620 (Kijun-sen) | 1.1660 (accumulation zone)
Resistance Tiers 1H: 1.1710 (breakout trigger) | 1.1760 (extension) | 1.1800 (major level) | 1.1850 (impulse target)
### 4-HOUR (Swing Trade Thesis Foundation) 💼
Inverse Head & Shoulders Pattern: Potential IH&S formation completing—left shoulder (1.1450), head (1.1400), right shoulder completing (1.1500-1.1560). Neckline breakout at 1.1710 targets 1.1900-1.2000 extension.
Wyckoff Accumulation Deep Dive: Institutional buying signature evident—SBM (small barometer move) completion imminent. Spring test to 1.1480-1.1510 anticipated; subsequent markup phase targets 1.1850-1.2000.
RSI 4H Analysis: RSI at 56-68 range—bullish bias maintained. Room for upside extension without extreme overbought. RSI above 74 targets 1.1900+; below 34 = defensive posture required.
Cup & Handle Formation: Potential bullish Cup pattern visible on 4H—handle stabilization near 1.1650-1.1700. Breakout above handle (1.1760) targets cup depth extension = 1.1850-1.1950.
EMA Ribbon Structure: EMA 8 (1.1680), EMA 13 (1.1660), EMA 21 (1.1610), EMA 50 (1.1500), EMA 200 (1.1350)—BULLISH ALIGNMENT PERFECT. Compression/expansion cycles identify momentum phases.
Support Tiers 4H: 1.1450 (structural support) | 1.1500 (accumulation) | 1.1600 (pivot) | 1.1660 (demand cluster)
Resistance Tiers 4H: 1.1710 (key breakout) | 1.1760 (extension) | 1.1800 (major target) | 1.1900 (weekly projection)
Volume Signature 4H: Accumulation volume bars > distribution bars—bullish bias maintained. Volume nodes clustering at 1.1600-1.1660 indicate strong institutional support zone.
### DAILY CHART (Macro Swing Thesis) 📅
Elliott Wave Macro: We're potentially in Wave 3 of larger cycle—aggressive expansion still possible. Wave structure supports break of 1.1800 targeting 1.1950-1.2100 daily close objectives.
Double Bottom Recognition: Historical Double Bottom pattern near 1.1350-1.1450 support—confirmed breakthrough above 1.1710 neckline triggered. Second target near 1.1900-1.2000.
Bollinger Bands Daily: Upper band at 1.1900 = realistic daily target zone. Mean (1.1750) = healthy pullback support. Band slope indicates volatility expansion—expect 100-200 pips daily ranges.
Volume Profile Daily: Strong buying volume bar at 1.1500-1.1650 zone—institutional accumulation marker established. Selling volume decreasing—demand controls trend absolutely.
Ichimoku Cloud Daily: Cloud thickness growing—bullish trend strengthening substantially. Cloud support around 1.1650-1.1750 zone. Kumo breakout anticipated—targets cloud top at 1.1800-1.1900.
Harmonic Analysis Deep: Butterfly Pattern potential completion—PRZ at 1.1710-1.1780 suggests reversal zone OR breakout confirmation. Confluence amplifies probability of extension.
Gann Angles & Fibonacci: 50% retracement (1.1550) + 61.8% extension (1.1850) = key reversal zones. Gann fan angles suggest 1.1800-1.1900 as structural resistance before continuation.
Key Daily Support: 1.1400 (psychological/structural) | 1.1500 (accumulation zone) | 1.1600 (demand level) | 1.1700 (midpoint)
Key Daily Resistance: 1.1710 (breakout trigger) | 1.1780 (extension) | 1.1850 (measured move) | 1.1950 (weekly target)
Trend Confirmation: Higher highs & higher lows maintained—uptrend intact. Daily close above 1.1800 = strong continuation signal targeting 1.2000+ next level.
## 🎪 TRADING SETUP PLAYBOOK - NOV 10-14
### BULLISH SCENARIO (Probability: 80%) ✅
Trigger: 4H candle close above 1.1760 + volume surge (>50% above average) + RSI above 64
Entry Zone: 1.1700-1.1750 (with breakout confirmation signal)
Target 1: 1.1780 (TP1) | Target 2: 1.1820 (TP2) | Target 3: 1.1900 (TP3) | Target 4: 1.1950 (TP4)
Stop Loss: 1.1620 (below EMA/structural support)
Risk/Reward: 1:3.2 (excellent asymmetric setup)
Trade Duration: 18-72 hours (prime swing window)
### BEARISH SCENARIO (Probability: 20%) ⚠️
Trigger: Daily close below 1.1650 + volume increase + RSI divergence failure
Entry Zone: 1.1760-1.1850 (short setup)
Target 1: 1.1710 (TP1) | Target 2: 1.1650 (TP2) | Target 3: 1.1600 (TP3)
Stop Loss: 1.1900 (above resistance)
Risk/Reward: 1:1.6 (acceptable but lower probability)
Trade Duration: Watch for trend reversal confirmation first
## ⚠️ VOLATILITY & OVERBOUGHT/OVERSOLD CONDITIONS
Current Volatility Status: Moderate compression → Expect significant expansion imminent
5M/15M RSI: 48-62 range (neutral)—room for 25-50 pips movements | Scalp target zones
30M/1H RSI: 52-66 range (bullish bias, optimal zone)—sweet spot for swing entries
4H RSI: 56-70 range—approaching caution zone but room to extend | Safe for core swings
Daily RSI: 60-74 range (approaching extremes)—be defensive if daily RSI>76 | Take profits aggressively
Overbought Recognition Points:
RSI daily >75 combined with upper Bollinger Band rejection = immediate profit-taking
Ichimoku cloud top penetration fails (bearish candle rejection) = trend exhaustion signal
Volume declining on breakout attempt = false breakout warning signal
Harmonic pattern PRZ exact hit without follow-through = reversal likely imminent
Oversold Bounce Setups:
RSI 1H <32 on support touch = high-probability bounce back to 1.1750-1.1800
Price below EMA 50 (1.1500) + RSI <30 = aggressive accumulation zone
Spring test below 1.1490 with volume surge = Wyckoff spring reversal trigger
Harmonic pattern PRZ support bounce = measured move extension targets activated
## 🎯 ENTRY & EXIT OPTIMIZATION STRATEGY
### OPTIMAL ENTRY TIMING
For Scalpers (5M): RSI bounce from 44-50 zone after Band lower touch = 15-25 pips scalp (1-3 min holds)
For Quick Swings (15M-30M): 15M candle close above 1.1690 with 4H alignment = 60-100 pips swing (30 min-2 hour holds)
For Core Swings (1H-4H): 4H pennant breakout above 1.1760 on volume = 150-250+ pips target (hold 12-48 hours)
For Position Swings (Daily): Daily close above 1.1800 = continuation play targeting 1.1950-2.0000 (hold 5-7 days)
Best Entry Windows: Asian session overlap (22:00-8:00 UTC), London open (8:00 UTC), NY close (21:00 UTC)
### EXIT STRATEGIES & PROFIT TAKING
Take Profit Levels: TP1: Fibonacci 38.2% (1.1760) | TP2: Harmonic PRZ (1.1820) | TP3: Daily Band upper (1.1900) | TP4: Weekly target (1.1950)
Stop Loss Placement: Always below most recent swing low + 20 pips (strict risk management priority)
Trailing Stops: Activate at TP2—trail with 30-40 pips buffer for 4H+ trades (lock in profits)
Breakeven Exit: Move stops to entry after 1:1 risk/reward achieved—eliminate emotional trading
Partial Profit Strategy: Close 25% at TP1 | 25% at TP2 | 25% at TP3 | Let 25% run to TP4 (maximize winners)
## 🔔 REVERSAL & BREAKOUT RECOGNITION CHECKLIST
### REVERSAL SIGNALS TO MONITOR:
RSI positive divergence (lower price lows, higher RSI lows) = bullish reversal setup high probability
Candlestick engulfing patterns at support/resistance zones = trend reversal confirmation strong signal
Volume profile breakdowns (declining volume on breakout attempts) = false move warning immediate
Ichimoku Cloud rejection (price fails to penetrate cloud layer) = structural resistance confirmed
Harmonic pattern completion at exact PRZ = reversal zone probability increases significantly
Elliott Wave 5th wave failure (truncation) = impulse completion = reversal imminent trigger
Gann angle break through significant angle = trend line break = reversal trigger activated
### BREAKOUT CONFIRMATION RULES:
Close beyond resistance with >50% volume surge above average = confirmed breakout signal strong
RSI crosses above 60 for bullish breakout, below 45 for bearish breakout confirmation
VWAP alignment with directional move = institutional participation confirmation strong
Bollinger Band breakout with band expansion (squeeze release) = volatility expansion confirmed immediate
Multiple timeframe confluence (5M + 15M + 1H + 4H aligned) = highest probability setup attainable
Ichimoku Cloud break (price clears all clouds with bullish candles) = strong continuation signal
Volume imbalance (ask volume > bid volume) = directional sustain likelihood increases significantly
## 💡 WEEK FORECAST SUMMARY - NOV 10-14
Monday (10th): 🌍 Consolidation continuation near 1.1650-1.1700 zone. Range-bound trading anticipated. Early breakout direction watch crucial. Entry setups favor reversal plays at support zones.
Tuesday-Wednesday (11-12th): 📈 Prime breakout window opens —1.1760 represents key decision point. Expect 100-200 pips daily volatility. Breakout confirmation targets 1.1820-1.1900 extension. This is the optimal swing trade window all week. ECB speakers watch critical.
Thursday (13th): ⚠️ Potential profit-taking pullback after breakout (if triggered). Support retest of 1.1780-1.1720. Buying opportunity if pullback holds above 1.1700.
Friday (14th): 📊 Weekly close pattern formation critical. Extension run anticipated if above 1.1800. If above 1.1850 = week target 1.1950-2.0000 achieved. End-of-week positioning for next week.
## 📍 CRITICAL CONFLUENCE ZONES - KEY TARGETS
1.1450-1.1500: Major support zone (accumulation marker, Wyckoff spring area, structural hold)
1.1550-1.1650: Secondary support (EMA 9, demand cluster, psychological level, volume POC)
1.1680-1.1710: Micro-resistance cluster (consolidation squeeze zone, early breakout resistance)
1.1750-1.1800: KEY BREAKOUT ZONE (triangle apex, harmonic confluence, all timeframe resistance)
1.1800-1.1900: Primary upside target (Elliott Wave 5, daily Band upper, measured move extension)
1.1900-1.1950: Secondary extension target (Gann level, macro resistance, wave projection)
1.1950-2.0000: Weekly/monthly target (if wave 5 impulse extends beyond base projections)
## 🏆 RISK MANAGEMENT RULEBOOK
✅ 1) Position Sizing: Never risk >2% of account equity per single trade
✅ 2) Risk-Reward Ratio: Minimum 1:2.5 R/R on every entry—1:3+ preferred for swing trades
✅ 3) Profit Scaling: Close 25-50% at 1:1 ratio, let remainder run to 1:2+ targets
✅ 4) Stop Loss Discipline: Place stop IMMEDIATELY on entry—no exceptions (20 pips tight)
✅ 5) Breakout Confirmation: Avoid FOMO—wait for candle close confirmation + volume surge always
✅ 6) Daily Support Respect: Psychological holds (round numbers 1.1600 | 1.1800) matter—trade confluence not against
✅ 7) Time Management: Exit losing trades quickly (max 1:0.5 acceptable for educational losses)
✅ 8) Macro Alignment: Always check daily/4H bias before taking 1H or lower trades
## #EURUSD #EUROUSD #FOREXTRADING #EURUSDANALYSIS
#TECHNICALANALYSIS #ELLIOTTWAVE #HARMONICPATTERN #BREAKOUTTRADING
#SWINGTRADER #DAYTRADING #INTRADAY #FOREXANALYSIS #TRADINGVIEW
#BOLLINGER BANDS #RSI #ICHIMOKU #VWAP #TRADINGSTRATEGY
#WYCKOFFMETHOD #GANNTHEORY #DOWTHEORY #TECHNICALS #ANALYSIS
#SUPPORTANDRESISTANCE #VOLUMEANALYSIS #OVERBOUGHT #OVERSOLD #REVERSAL
#FOREXTRADERS #CURRENCYTRADING #BREAKOUTSETUP #TRADERSOFTWITTER
#TECHNICALTRADER #CANDLESTICK #PATTERRECOGNITION #CHARTANALYSIS #DAYTRADER
## 🎁 BONUS: DAILY PRE-MARKET CHECKLIST
Use this every morning before market open:
☑️ Check daily RSI (should be 60-72 for bullish bias continuation)
☑️ Identify support/resistance zones (1.1600 | 1.1700 | 1.1760 | 1.1900)
☑️ Verify 4H chart alignment (pennant/IH&S pattern status update)
☑️ Check Ichimoku cloud position (above/below = trend confirmation signal)
☑️ Review 1H Elliott Wave count (which wave are we trading exactly?)
☑️ Scan volume profile (POC = likely rejection zone area)
☑️ Set entry orders + stop losses BEFORE Asian session closes
☑️ Plan 3 Take Profit levels before entering any position
☑️ Monitor ECB/Fed speakers + economic calendar (interest rate expectations)
## 🌐 FOREX SESSION NOTES
EUR/USD trades 24/5 across all sessions . Highest volatility typically occurs:
Asian Session (22:00-8:00 UTC): Lower volatility—good for breakout setups forming
London Session (8:00-16:30 UTC): Prime trading hours —peak liquidity + volatility combination
NY Session (14:30-21:00 UTC): Secondary volatility surge—often confirms London direction
ECB/Fed Policy Impact: Monitor policy divergence—higher Fed rates support USD weakness = EUR strength
💡 Disclaimer: This technical analysis is educational only. Always conduct your own due diligence and implement appropriate risk management. Past performance does not guarantee future results. Trade responsibly within your risk tolerance. Use stop losses on every position. Not financial advice.
Analysis Created: November 8, 2025 | Valid Through: November 14, 2025 | Updated Daily

EURUSD Shorterm Forecast on 4hrsOn shorterm bases price reversed at 1.16 and is heading high. My target is at 1.1680 but I think it will touch 1.17 again and seems like it will go higher to 1.185. For now, price will not go to 1.15 as I initially thought (currently there are no indications of the reversal of uptrend on minor timeframes). Shortterm I had to change my stance for bullish on 4 hrs due to the price action which developed last week due to US CPI release and continued government shutdown in the USA.
However longterm, we will be reversing before 1.20. EURUSD tends to range a lot though. So it will stay in this area for a while.
Watch the minor downtrend (lower highs on daily). I think price is likely to violate the last lower high on daily.
FOR EDUCATIONAL PURPOSES ONLY

COMPREHENSIVE TECHNICAL ANALYSIS: INTRADAY & SWING TRADE SETUP 📊 EURUSD (1.16272) - COMPREHENSIVE TECHNICAL ANALYSIS: INTRADAY & SWING TRADE SETUP 📊
October 27-31, 2025 | Multiple Timeframe Deep Dive
🎯 EXECUTIVE SUMMARY 🎯
Current Spot: 1.16272 | Analysis Date: Oct 25, 2025 | Focus: 5M-1D Timeframes | Strategy: Intraday & Swing Trade
━━━━━━━━━━━━━━━━━━━━━━━━━━━━━━━━━
📈 1. MULTI-TIMEFRAME TREND ANALYSIS & DOW THEORY APPLICATION 📈
🔍 Daily (1D) Timeframe - Primary Trend Direction
The 1D chart reveals a consolidation phase with bullish bias . Elliott Wave structure suggests we're completing a 5th wave extension after a 4-wave correction. Dow Theory confirms higher lows forming around 1.1580-1.1600 support levels. The uptrend remains intact with RSI hovering in 40-60 zone (neutral-bullish). VWAP at 1.1620 acts as dynamic support.
⏰ 4H Timeframe - Swing Trade Entry Signals
The 4H setup shows bullish flag formation near 1.1625. Bollinger Bands are tightening, signaling potential breakout. RSI at 55-60 indicates strength without overbought conditions. Ichimoku Cloud shows bullish alignment with price above all moving averages. Target: 1.1680-1.1720 for swing positions.
🔥 1H to 5M Intraday Confluence
1H chart displays ascending triangle pattern with resistance at 1.1650. Harmonic patterns suggest Bullish Gartley forming near 1.1580 level—ideal for aggressive intraday entries. 30M shows clean EMA crossover (50>200 EMA bullish). Volume profile confirms institutional accumulation between 1.1590-1.1620.
━━━━━━━━━━━━━━━━━━━━━━━━━━━━━━━━━
🎪 2. ENTRY & EXIT STRATEGY + WYCKOFF METHOD 🎪
SWING TRADE ENTRIES (4H/1D): Buy breakout above 1.1650 with stop @ 1.1580 (Risk:Reward 1:3). Wyckoff Spring Pattern validation near support confirms institutional absorption.
INTRADAY ENTRIES (5M-30M): Enter on 30M EMA crossovers + RSI < 30 rejections from support zones. Stochastic divergence on 15M indicates pullback entries around 1.1610-1.1615.
EXIT TARGETS: 1D: 1.1750 | 4H: 1.1705 | 1H: 1.1670 | Intraday: 1.1650 (first profit). Take-profit at resistance clusters identified via Gann angles.
STOP LOSS PLACEMENT: Swing: 1.1560 (below double bottom structure) | Intraday: 1.1600 (15-20 pips from entry).
💡 Pro Tip: Use Ichimoku Kijun-sen (26P) as dynamic stop—trail on breakouts above 1.1650.
━━━━━━━━━━━━━━━━━━━━━━━━━━━━━━━━━
🔔 3. REVERSAL SIGNALS & JAPANESE CANDLESTICK ANALYSIS 🔔
⚠️ BULLISH REVERSAL INDICATORS:
Hammer candlesticks forming at 1.1580 (5M/15M confluence). Engulfing patterns on 30M confirm buyer strength. Ichimoku Chikou Span crossing above price action validates trend reversal completion. Morning Star pattern visible on 1H—classic reversal signal.
⛔ BEARISH REVERSAL WARNINGS:
If price fails to break 1.1650 with declining volume, watch for Evening Star on 4H. Gann resistance at 1.1680 acts as rejection zone. RSI divergence (lower highs with price higher highs) on 1D would signal exhaustion. VWAP rejection could trigger short setups.
⚡ Key Level: 1.1645-1.1650 acts as Decision Point. Break = Bullish Continuation | Reject = Intraday Reversal
━━━━━━━━━━━━━━━━━━━━━━━━━━━━━━━━━
💥 4. BREAKOUT RECOGNITION & PATTERN FORMATIONS 💥
✅ Bullish Breakout Setup (PRIMARY):
Ascending triangle breakout above 1.1650 resistance on 1H timeframe. Volume confirmation: need 20%+ volume spike above 20-period MA. Elliott Wave target 1.1750-1.1800 after 5th wave completion. Bollinger Band upper band at 1.1680—natural extension target.
🚀 Harmonic Patterns Identified:
Bullish Gartley at 1.1580 (D-point) with PRZ 1.1605-1.1620. Bat pattern on 4H suggesting potential for 161.8% extension. Butterfly pattern on 1D targeting 1.1850 in extended bull scenario.
⚡ Risk Pattern - Rising Wedge (WARNING):
If price fails breakout, 4H shows rising wedge trap. Potential bearish breakdown to 1.1550 if wedge collapses. Monitor Bollinger Band squeeze on 30M—breakout imminent within 48 hours.
━━━━━━━━━━━━━━━━━━━━━━━━━━━━━━━━━
📊 5. VOLATILITY, PRICE ACTION & INDICATOR CONFLUENCE 📊
🌊 Bollinger Bands & Volatility Analysis:
Band width compressed to 150 pips (1D)—lowest in 10 days. This signals imminent volatility expansion. Intraday (5M/15M) bands widening, indicating increased participation. Price bouncing within middle band suggests continuation pattern.
📍 Support & Resistance Clusters:
SUPPORT: 1.1600 (Previous swing low) | 1.1580 (Gartley D-point) | 1.1560 (Double Bottom)
RESISTANCE: 1.1650 (Ascending Triangle apex) | 1.1680 (Bollinger upper + Gann angle) | 1.1720 (Weekly pivot)
VWAP LEVELS: Daily VWAP: 1.1620 (support) | Weekly VWAP: 1.1610 (support)
📈 Moving Average Crossovers - Trend Confirmation:
EMA 50 > EMA 200 (bullish alignment on all timeframes). SMA 20 above SMA 50 on 1H/4H = buy signal. 5M: Recent EMA crossover indicates intraday uptrend initiation. Price maintaining above all key MAs confirms Wyckoff accumulation completion.
🎯 Overbought/Oversold Conditions:
RSI: Currently 58-62 range (neutral-bullish, NOT overbought). Stochastic on 15M: 45-55 range with upside momentum. Ichimoku RSI indicator below 50—room for upside run. CCI on 5M near +100 (strong momentum without extreme overbought).
━━━━━━━━━━━━━━━━━━━━━━━━━━━━━━━━━
🎓 6. ADVANCED TECHNICAL THEORIES SYNTHESIS 🎓
⭐ Elliott Wave Structure: 5-3-5 Pattern Complete - Currently Wave 1 (up) of new cycle targeting 1.1800 minimum | Fibonacci Extensions: 161.8% from swing = 1.1750
⭐ Gann Theory Application: 45-degree angle resistance @ 1.1680 | Square of Nine support @ 1.1580 | Time-Price analysis: 8-10 trading days for major move completion
⭐ Wyckoff Method: Spring Pattern (successful test of support) = Bullish signal | Schiff accumulation phase ending | Expected markup phase: 1.1650-1.1750 (next 7-10 days)
━━━━━━━━━━━━━━━━━━━━━━━━━━━━━━━━━
✨ TRADING PLAN SUMMARY ✨
🎯 LONG BIAS (PRIMARY SCENARIO):
Entry: 1.1645-1.1650 breakout | Stop: 1.1605 | Target 1: 1.1680 | Target 2: 1.1720 | Target 3: 1.1750
Risk/Reward: 1:3+ | Conviction: 75% | Timeframe: Swing (Hold 3-5 days) + Intraday scalp (1-4 hours)
⚠️ SHORT SCENARIO (CONTINGENCY):
Trigger: Rejection at 1.1650 + Volume decline | Entry: 1.1635 | Stop: 1.1655 | Target: 1.1600
Probability: 25% | Setup: Rising Wedge breakdown
⏱️ TIMEFRAME PRIORITY: 4H (swing base) + 1H (entry confirmation) + 5M (execution)
💰 POSITION SIZING: Risk max 1-2% per trade | Scaling in on pullbacks
🔔 ALERTS: Set at 1.1650 (buy signal) | 1.1605 (stop loss) | 1.1680 (partial profit)
━━━━━━━━━━━━━━━━━━━━━━━━━━━━━━━━━
Disclaimer: Educational analysis only. Not financial advice. Trade at your own risk. Always use proper risk management. Past performance ≠ future results.

LONG ON EUR/USDEU has given us a nice bullish push from a demand zone.
I will be buying EUR/USD looking to catch 50-80 pips.

Uncertainty amidst US Government ShutdownHere we have the FOREXCOM:EURUSD Currency Pair
A break below the gap will send us towards 1.15
A rejection will send us above 1.18
The EUR/USD pair is testing a Fair Value Gap (FVG) formed thursday 25th, September on the daily timeframe.
This inefficiency has become efficient, being traded through multiple times, fueling uncertainty for long term bias on the EURO, together with the US Government Shutdown.
Scenario 1:
Current structure shows a recent high at 1.18 and low at 1.15 . A break below the FVG lower boundary could trigger a downpour towards 1.15
Scenario 2:
On the flip side, a rejection at the FVG, forming an orderblock, could lead to a Break above 1.18 , pushing toward 1.18 and a probable reversal.
Simple and short.
Not financial advice; trade your own plan.
Break lower or reject higher ? Drop your thoughts in the comments. 📈

EUR/USD (2H) Analysis – SMC + Elliott Wave ViewOn the 2H timeframe, price is respecting both SMC supply zones and Elliott Wave corrective structure.
🔹 Elliott Wave Structure:
We are currently unfolding in a Corrective A–B–C pattern.
Wave A completed with strong downside impulse.
Wave B retraced into supply zone but failed to break structure.
Now, wave C is developing, with expectation of further downside toward the 1.1650–1.1620 demand zone.
🔹 SMC Structure:
Price tapped into the sellers’ supply zone (1.1760–1.1780), aligning with previous order block and descending channel trendline.
Market structure remains bearish with lower highs & lower lows.
Liquidity below 1.1700 is the next target for smart money.
📉 Bias:
Looking for a rejection from the seller zone → continuation into the blue demand area marked as Wave C completion.
✅ Confluence:
Elliott Wave C-leg projection
Bearish order flow (SMC)
Supply zone rejection
Channel continuation
⚠️ Invalidation:
Bullish break and close above 1.1800 would invalidate this bearish scenario.

Dxy bullish | 98.012The US Dollar Index (DX) appears to be completing its Wave 4 correction within the Elliott Wave structure, signaling a potential bullish reversal. After a period of consolidation and pullback, price action is stabilizing above key Fibonacci support levels, suggesting that the corrective phase may be ending. Technical indicators are starting to shift bullish, with early signs of momentum recovery and possible bullish divergence on lower timeframes. A confirmed breakout above short-term resistance would likely validate the start of Wave 5, targeting a new swing high. Overall, the setup favors a bullish continuation as Wave 5 unfolds, in alignment with the primary uptrend.

EURUSD: Exhausting Uptrend Around 1.1930-1.2400The EUR/USD pair shows signs of losing momentum on the chart, which is expected as it is currently in the final (5th) wave of a larger wave C or 3.
The RSI indicates a second consecutive bearish divergence, but the uptrend could continue for a while. The price is likely to reach at least 1.1930, which is the level where wave C equals wave A, for symmetry.
The blue box highlights the target area based on the Fibonacci sequence. It starts at 1.1930 and peaks around 1.2400, where wave 5 of wave C is projected to cover 61.8% of the distance from wave 1 to wave 3.
We’re not predicting the reversal point yet; we’ll let the market reveal it in due time.
Wishing us all lucky trades!

Head & Shoulders Top Threatens GBPUSD Rally! Bearish Swing Trade🔮 GBPUSD Technical Forecast & Trading Strategy | Week of Sept 6th, 2025
Current Spot Price: 1.35064 | CFD | Date: Sept 6, 2025
🟢 Overall Bias: CAUTIOUSLY BEARISH | Primary analysis suggests a potential corrective pullback is imminent. However, the broader bullish trend on higher timeframes remains intact until key support breaks.
📊 Multi-Timeframe Technical Breakdown
1. Chart Pattern & Theory Convergence:
⚠️ Potential Head & Shoulders Top (H&S) Formation: On the 4H chart, a developing bearish reversal pattern is visible. The left shoulder, head, and a forming right shoulder suggest a pullback towards the neckline near 1.3420-1.3400 is possible.
📐 Gann Theory & Square of 9: Key Gann resistance was evident near 1.3520-1.3530. The current rejection from this zone adds credibility to the bearish short-term outlook. The next major Gann support level aligns with the H&S target around 1.3400.
🌊 Elliott Wave Theory: Price action from the recent low appears to be completing a 5-wave impulsive move up. We are likely entering a corrective Wave A or B pullback.
🦀 Harmonic Patterns: The rally has approached a potential Bearish Crab or Bat pattern completion zone, where PRZs (Potential Reversal Zones) often coincide with Fibonacci extensions (e.g., 1.618). This reinforces the resistance area.
2. Key Indicator Signals:
📶 RSI (14): On the 4H chart, the RSI is showing a clear bearish divergence 📉. Price made a higher high, but the RSI made a lower high. This is a classic warning sign of weakening bullish momentum.
📏 Bollinger Bands (20,2): Price has kissed the upper band and is pulling back towards the middle band (20 SMA ~1.3460), which will act as immediate support. A break below could target the lower band.
⚖️ VWAP & Anchored VWAP: The price is trading above the daily VWAP, indicating the average buyer is still in profit. However, a break below a key Anchored VWAP (from the last significant low) would signal a shift in medium-term momentum.
📈 Moving Averages: The 50 and 200 EMA's on the 4H are still bullishly aligned, providing dynamic support. A break below the 50 EMA (~1.3470) would be the first sign of bearish acceleration.
3. Critical Support & Resistance:
🎯 Immediate Resistance: 1.3520 - 1.3535 (Gann Level, Previous High)
🎯 Key Resistance: 1.3600 - 1.3650 (Psychological, Swing High)
🛡️ Immediate Support: 1.3470 (50 EMA)
🛡️ Strong Support: 1.3420 - 1.3400 (H&S Neckline, Psychological)
🛡️ Major Support: 1.3350 (200 EMA, Wave 4 base)
⚡ Trading Strategies & Setups
A. Intraday Trading (5M - 1H Charts):
Strategy: Look for short opportunities on any retest of the 1.3520 resistance area, especially if confirmed by a bearish candlestick pattern (e.g., Bearish Engulfing, Shooting Star) and RSI rejection from overbought (>70) territory.
Short Entry (Ideal): ~1.3515 | Stop Loss: 1.3545 | Take Profit 1: 1.3480 | Take Profit 2: 1.3440
Scalp Long: Only on a bounce from the 1.3470 (50 EMA) support with a tight stop.
B. Swing Trading (4H - D Charts):
Strategy: The confluence of the H&S pattern, RSI divergence, and Gann resistance provides a high-probability swing short setup.
Swing Short Entry: On a break below the 1.3470 support or a rejection from 1.3520. | Stop Loss: Above 1.3550 | Target 1: 1.3420 (Neckline) | Target 2: 1.3350
Bullish Invalidation: A decisive break and close above 1.3550 would invalidate the immediate bearish setup and open a path to 1.3650.
🌍 Market Context & Risk Factors
Geopolitical & Political Events: Monitor any developments related to UK-EU relations, BoE and Fed policy divergence, and global risk sentiment. Volatility is guaranteed around high-impact news events.
USD Strength: The forecast is partially contingent on a broader USD recovery. Watch the DXY (Dollar Index) for confirmation.
✅ Key Takeaways:
Confluence is Key! Multiple independent theories (Gann, Elliott, Harmonics) are pointing to a resistance zone.
Momentum is Waning. The RSI divergence is a critical red flag for bulls 🚩.
Respect the Levels. Trade the break of 1.3470 (support) or 1.3550 (resistance).
Manage Risk. Always use stop-loss orders. The market can remain irrational longer than you can remain solvent.
For individuals seeking to enhance their trading abilities based on the analyses provided, I recommend exploring the mentoring program offered by Shunya Trade. (Website: shunya dot trade)
I would appreciate your feedback on this analysis, as it will serve as a valuable resource for future endeavors.
Sincerely,
Shunya.Trade
Website: shunya dot trade
⚠️Disclaimer: This post is intended solely for educational purposes and does not constitute investment advice, financial advice, or trading recommendations. The views expressed herein are derived from technical analysis and are shared for informational purposes only. The stock market inherently carries risks, including the potential for capital loss. Therefore, readers are strongly advised to exercise prudent judgment before making any investment decisions. We assume no liability for any actions taken based on this content. For personalized guidance, it is recommended to consult a certified financial advisor.

FTSE100 is at critical pointFTSE100 of the 1H is at critical point. We have said before that once the price breaks the trend line is going to be reversl, that has to be adjusted a little a bit. but we have to consider the MAs on the 4H chart.
Good luck to you all,
MarketsTitan

FTSE100 (September 1st - 5th, 2005)FTSE100 Technical anaylsis.
Simlpy you have a bearish trend line (1hour chart) once it break it I am bullish.
Don't forget monday is a holiday in US and Canada (Labor day).
Thank you all
MarketsTitan

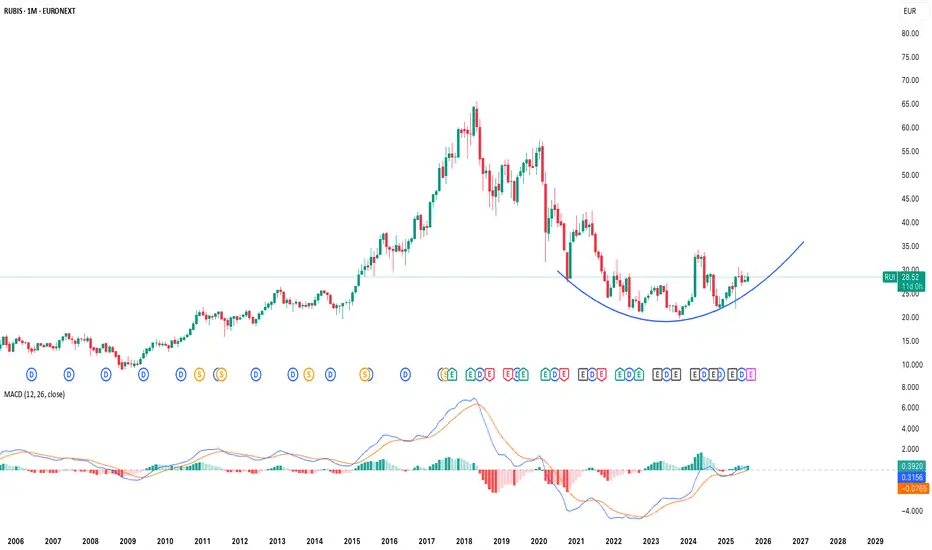
Rubis (RUI:EPA) - A Deep Value Infrastructure Play - TP: 60 EUR📌 Investment Thesis
Rubis is a small-cap European energy distributor undergoing a strategic transformation. Traditionally focused on downstream oil and gas distribution, the group divested its storage business in 2023 and has since begun allocating capital into renewable electricity generation in France, Italy, and Spain. This pivot is supported by favorable EU and French regulatory frameworks designed to accelerate decarbonization.
Despite several years of share price weakness, 2024 saw the entry of heavyweight French industrial investors:
• Vincent Bolloré acquired ~6% of shares.
• Patrick Molis’ Compagnie Nationale de Navigation (CNN) holds ~9%.
Their presence and reshffling of the management Board validates Rubis’ new strategic direction and strengthens its long-term shareholder base.
📈 Technical check
After several years in a pronounced downtrend, Rubis shares have been building a base since the second half of 2023. Early 2024 marked the initiation of a trend reversal, confirmed by higher lows and improved momentum indicators. The stock is currently trading well below its 2018 all-time high of ~€65, but the technical setup suggests that, upon confirmation of the reversal, Rubis could progressively retrace back toward those levels. A sustained break above resistance in the mid-40s would open the path to a multi-year recovery cycle, in line with the company’s strategic repositioning.
🌍 Macro Backdrop
• European equities regain traction: After years of underperformance, Europe returned to the spotlight in 2024, benefiting from capital rotation out of US mega-caps and geopolitical shifts under the Trump administration.
• Energy security meets energy transition: The EU seeks to balance renewable capacity growth with hydrocarbon reliability. Rubis straddles both worlds.
• Valuation support: European energy mid-caps continue to trade at a discount versus US peers, making Rubis attractive for contrarian investors.
⚡ Strategic & Financial Drivers
1. Shift to Renewables – Through its subsidiary Photosol, Rubis already operates 535 MW of solar capacity with a pipeline exceeding 3 GW, targeting 3.5 GW in operation by 2030.
2. Stable Downstream Franchise – Distribution of LPG, fuels, and bitumen across 40+ countries remains a resilient, cash-generating core. EBITDA for the fill FY2024 was €730m, with the distribution business ("retail and Marketing) accounting for 95% of it..
3. Dividend Aristocrat Status – Rubis has increased its dividend for 28 consecutive years, delivering an impressive 8% CAGR in dividend per share (DPS) over the past decade. With a forward yield of ~7.2% by 2026, it ranks among Europe’s most attractive income stocks .
4. Strong Financials – Historical EPS CAGR of 9% over 10 years, >100% free cash flow conversion (2011–2021), and conservative leverage (<2x corporate net debt/EBITDA) ensure balance sheet resilience .
5. Influential Shareholders – Bolloré and CNN’s stakes provide confidence in governance and long-term optionality.
🚨 Risks
• Execution risk in scaling renewables profitably.
• Structural long-term decline of oil & gas distribution volumes.
• Regulatory and taxation headwinds on fossil fuels in Europe.
• Delay in commercial operation of solar plants
🧭 Conclusion
Rubis combines the resilience of a cash-generating downstream franchise with the growth optionality of renewables, backed by a 28-year record of dividend growth. Trading at a discount to peers (p.e. of 8.6x), with a forward yield of 7%+ and validation from industrial shareholders, Rubis stands out as a contrarian long-term income and transition play in European infrastructure.
ETH watch $4238.73: Semi-Major Genesis fib to slow/stop SurgeShown here is a single fib series in 3 different timeframes.
The "Genesis Sequence" has called all major turns since 2015.
$4238.73 is a "Semi-Major" fib Ratio so it will be quite strong.
It is PROBABLE that we orbit this fib a few times.
It is POSSIBLE that we reject and form a local top.
It is PLAUSIBLE that we Break-n-Retest to continue.
See "Related Publications" for previous analysis ---------->>>>>>>>>>>

DAX Resilience To Shine ThroughThe DAX Index continues to hold strength just beneath all-time highs, popping higher above 24,000 after three consecutive sessions of gains.
Bulls are keeping control through strong earnings in tech and auto sectors, combined with supportive macro tailwinds. However, the major resistance and previous ATH remain to be tested.
U.S. Interest Rate Path in Focus
The Federal Reserve held rates steady at its July meeting but left the door open for a possible cut in September, should inflation and labor market data soften.
Markets are pricing in an increasing probability of a cut, which is fueling optimism across global equities.
A dovish Fed supports global risk sentiment and weakens the USD, indirectly benefiting European exporters.
ECB Holds, But Dovish Undertone Grows
The European Central Bank left rates unchanged in its latest decision, but ECB President Christine Lagarde acknowledged that “disinflation is progressing” and that further tightening is unlikely.
Forward guidance was interpreted as dovish, with the market now expecting a cut by December, possibly sooner if economic activity remains sluggish.
A dovish ECB lowers borrowing costs and improves equity risk premiums, especially for cyclical-heavy indices like the DAX.
EU–U.S. Trade Tensions
Recent rhetoric from U.S. officials, including renewed tariff threats on European pharmaceutical and automotive exports, has reignited trade tensions.
The EU has signaled its willingness to respond proportionally, but negotiations are ongoing.
While no measures have been enacted yet, uncertainty over trade policy is capping some upside momentum in European equities.
German automakers and industrial exporters are vulnerable to tariffs. Continued trade uncertainty may limit gains unless diplomacy resolves key friction points.
The DAX remains resilient, buoyed by improving fundamentals, strong earnings, and global rate expectations.
The index is coiled just under a key psychological resistance at 24,000, with bulls eyeing a breakout toward the all-time high near 24,639.
Momentum remains favorable, but traders should watch macro headlines and volume closely around resistance zones.

EURUSD Q3 | D23 | W30 | Y25📊EURUSD Q3 | D23 | W30 | Y25
Daily Forecast🔍📅
Here’s a short diagnosis of the current chart setup 🧠📈
Higher time frame order blocks have been identified — these are our patient points of interest 🎯🧭.
It’s crucial to wait for a confirmed break of structure 🧱✅ before forming a directional bias.
This keeps us disciplined and aligned with what price action is truly telling us.
📈 Risk Management Protocols
🔑 Core principles:
Max 1% risk per trade
Only execute at pre-identified levels
Use alerts, not emotion
Stick to your RR plan — minimum 1:2
🧠 You’re not paid for how many trades you take, you’re paid for how well you manage risk.
🧠 Weekly FRGNT Insight
"Trade what the market gives, not what your ego wants."
Stay mechanical. Stay focused. Let the probabilities work.
FRGNT

EURUSD Q3 | D21 | W30 | Y25 📊EURUSD Q3 | D21 | W30 | Y25
Daily Forecast 🔍📅
Here’s a short diagnosis of the current chart setup 🧠📈
Higher time frame order blocks have been identified — these are our patient points of interest 🎯🧭.
It’s crucial to wait for a confirmed break of structure 🧱✅ before forming a directional bias.
This keeps us disciplined and aligned with what price action is truly telling us.
📈 Risk Management Protocols
🔑 Core principles:
Max 1% risk per trade
Only execute at pre-identified levels
Use alerts, not emotion
Stick to your RR plan — minimum 1:2
🧠 You’re not paid for how many trades you take, you’re paid for how well you manage risk.
🧠 Weekly FRGNT Insight
"Trade what the market gives, not what your ego wants."
Stay mechanical. Stay focused. Let the probabilities work.
FRGNT 📊

EURGBP SHORT – WEEKLY FORECAST Q3 | W29 | Y25💼 EURGBP SHORT – WEEKLY FORECAST
Q3 | W29 | Y25
📊 MARKET STRUCTURE SNAPSHOT
EURGBP is currently reacting from a key higher time frame supply zone, with price action showing weakness at premium levels. Momentum has slowed, and early signs of distribution are appearing. With structure aligning bearishly across multiple timeframes, the pair presents a short bias opportunity.
🔍 Confluences to Watch 📝
✅ Daily Order Block (OB)
Price reacted from a high-probability bearish OB.
Rejection wicks and a shift in candle body control point to supply dominance.
Momentum is fading, confirming the presence of smart money sellers.
✅ 4H Order Block
Clear mitigation of 4H OB followed by an internal break of structure (iBoS).
Price is respecting the OB zone, printing lower highs beneath key supply.
Perfect mid-timeframe confirmation of trend transition.
✅ 1H Order Block
1H structure shifted bearish, validating LTF trend alignment.
Price building supply chain with continued lower highs and bearish engulfing patterns.
Ideal zone for entry on pullback or liquidity sweep.
📈 Risk Management Protocols
🔑 Core Principles:
💰 Max 1% risk per trade
📍 Only execute at pre-identified zones
⏰ Set alerts — avoid impulsive trades
📉 Respect RR — minimum 1:2 per position
🧠 You're not paid for frequency. You're paid for discipline and execution quality.
🧠 Weekly FRGNT Insight
“Trade what the market gives, not what your ego wants.”
Stay mechanical, stay focused, and allow the probabilities to play out. Your job is to control risk — not the outcome.
🏁 Final Thoughts from FRGNT
📌 The structure is clear.
📌 The confluences are stacked.
📌 The bias is confirmed.
Let your execution reflect your discipline, not your emotions.
❤️ Good luck this week, and as always – I’ll see you at the very top.

Opportunities Arise from Dollar WeaknessSince the dollar peaked in 2022, it has declined by 24%.
Such a decline may not seem significant for a stock, it’s a different story when it comes to currencies, especially a reserve currency for USD. US purchasing power has dropped by a quarter, meaning they will now have to pay 24% more for imports from EU.
However, the decline in the USD also presents opportunities in other markets.
Mirco EUR/USD Futures
Ticker: M6E
Minimum fluctuation:
0.0001 per euro = $1.25
Disclaimer:
• What presented here is not a recommendation, please consult your licensed broker.
• Our mission is to create lateral thinking skills for every investor and trader, knowing when to take a calculated risk with market uncertainty and a bolder risk when opportunity arises.
CME Real-time Market Data help identify trading set-ups in real-time and express my market views. If you have futures in your trading portfolio, you can check out on CME Group data plans available that suit your trading needs www.tradingview.com

SHORT ON EUR/USDEU has given a nice bearish setup with a rising channel.
I will be selling EU to the next demand level looking to catch 200-300 pips.
