Updated - Tron (TRX) - Elliott Wave Count and Prediction - 4hrI'm making a slight adjustment to my Tron (TRX) EWT count.
It appears TRX isn't waiting around for a slightly deeper pullback to complete (2), so it's highly probable we are now in a (3) of W3 which will give us a fantastic run-up in the next week or so. Notice the red vertical time cycle lines and the beautiful symmetry between the subwaves of W1. This supports the wave count further and I can find no alternate count nearly as probable as this. The subwaves of W1 peaked around 17 day increments. Using this symmetry puts us at January 27th (+/- 24hr) for the next noteworthy pullback. At which time, wave (3) of W3 should complete. Then we will consolidate for a wave (4) of W3.
Please feel free to comment and/or make suggestions on how to improve my wave counts.
I love wave counting the markets and am in awe of their beauty, but *NOTE* I am not an investment advisor and am not offering investment advice.
EWT

Current EWT Wave Count - Ripple XRPUSD - 4 HR - Big Move Coming It appears XRP/USD has completed a correction W2 (white) that ended on January 13th, completing a complex WXYXZ correction lasting since January 24th, 2018.
To confirm the end of corrective W2 (white) is wave (Z) ending as a .618 proportion of wave (W). This also coincides with W2 retracing within a few points of the .786 of W1.
Time cycles place the likelihood of wave (3) of W3 beginning on or around January 19th. If this count is correct, we should see the beginning of the bull run as a 3 of 3; generally giving you the fastest and highest gains.
I am entering at current levels with generous stops below the beginning of W1 at $.2750. A breach of this level would negate this wave count entirely.
I will take profit on 1/4th of the position at $.4975 and trail stops up to $.33 which is just below the ending of wave (1) of W3. The remainder of the position will be held indefinitely as it appears a bottom is in place and there is nowhere to go but up. I'll trail my stops respective to EWT rules and pay close attention to if this wave count holds up.
I am not an investment advisor and am not recommending you buy or sell. I enjoy predicting market behaviour and, most of all, learning new trading techniques. Please feel free to politely offer suggestions or critiques of my EWT analysis.

ETH in bearish 4th wave triangleConfluence at target with long term horizontal support, triangle measurement from A-B projected from E and also Algo target from most recent significant swing high to swing low. Trade is invalidated if E wave goes above C of the ABCDE.
Longs outpacing shorts which can be construed as a contrarian indicator.


USOIL near term downside target: $67.25Short Term running flat correction looks most likely. Downside target is $67.25 to $66.17.
If it starts to play out that way, it could turn around short of that target since it's running flat. But it looks pretty flat, and so I think the target makes sense.
Next move after that would probably be to the upside, but it could keep going down depending on momentum, fundamentals, etc. Have to wait and see what happens. Cheers -

SP500 target 2920-2940, then correction, then Santa ClausTriangle wave IV recently completed and current leading diagonal primary wave 1 nearing completion. The diagonal should have 3-3-3-3-3 structure, and it appears to be about to finish the last leg this week or next; maybe right after Labor Day. Primary wave 2 could be a significant correction, setting up a nice Santa Claus rally in November. We'll see.
Cheers -

Ermanometric and EWT situation update.I cannot paste images in my last idea, so new idea with situation update. That 5th wave if will occur should not last long, minimum for this is around 7 cents (38.2 length of wave 3rd) maximum rests for trading robots or panic sellers. I will put some pending buy orders @HitBtc and @Zaif but in hope for get fast free of cost XEMs. Before trend change here should be that panic shortlived dump and daily close with intresting candle and long shadow.

Nasdaq 100 - Re-accumulationAs can be seen from the chart above - I believe the Nasdaq is going through a clear re-accumulation - currently in phase C.
We see each reaction to the downside reduced after the Feb lows, higher highs, higher lows as the weeks pass.
EWT suggests the price action seen during the February crash formed w4. We are now in W3(5). Daily bar on the 15th August (retest of local highs on high vol) suggests we are clear for another push to the upside.
1.618 extension of W1 leave us with a target of 8700. A continuation of the tech boom we are now experiencing will further drive the nasdaq forward. The next task is finding a good entry point!

Short FTSE100 - Clean ABCSee above the buy limit order I have set up for the FTSE
From the Macro analysis I published in my last idea, I am expecting some downside for the FTSE over the next couple of months. Now to find a good entry!
As stated previously, I can see a test of the lower bound of the ending diagonal. EWT suggest we has just completed Wave C-1, currently in wave C-2 - a pullback to the 50% fib here is standard - h4 50/100/200 ma's have clustered just above the 618 fib. I have front run my order slightly due the the most recent strong bearish move to the downside.
Lets see can I get filled.
Good R:R for this trade. Once, my order is filled I will move my stop up to just above the local high to reduce my risk on the trade and increase the R:R.
Best of luck!
For more in-depth Analysis join me at - t.me or follow me on twitter @ColGal92

Elliot Wave Theory: Degrees, Basic structure and Fractals (pt.1)I am going to start posting a visual guide to Elliot Wave since a lot of people ask me about where they can learn Elliot Wave theory, and many complain about how long it usually takes. So with this I hope I can simplify the theory for you. This theory works very well in financial markets as well as cryptocurrency markets (not /BTC but /USD)
Introduction : Elliot Wave theory was developed by R.N. Elliot and popularized by Richard Pretcher. This theory claims that crowd behaviour moves in clear trends. Elliot identified a certain structure to price movements in financial markets. I will be explaining this theory and most structures in a somewhat simplified version in the upcoming ideas, so this is pt.1, in these parts we will cover: Basic structures, Degree of waves, Fractal nature of markets, Wave personality, Impulse/Motive waves, Corrective waves, Fibonacci projections and retracements, cycle of markets in relation to Elliot Wave Theory, The right look, Percentages, and Fibonacci relationships, Rules, Guidelines and more. I am making this series to help those unfamiliar with Elliot Wave theory, for those who might be struggling in it to get a visual understanding, and for those who might be too impatient to read through the entire book. Many are quick to brush off Elliot Wave theory as hocus pocus because they do not take the time to remember the patterns, rules, and other things then try to apply them to real-time charts without the needed knowledge, however I guarantee you if you take the time to memorize these patterns and apply them to the charts in front of you while using proper rules, etc. you will be able to predict most price moves in real-time.
Basic structure : The basic structure I have shown is based off of a "normal" 8 wave structure which has an extended wave 3, and as we know markets can behave irrationally and not follow the norm, sometimes there are complex corrections and non-typical extensions, but we will cover that in further posts.
Leave a like if you wish to follow this series, every update will be posted below.

BTC still going down, completing wave 5 down BTC completing 5th wave down of possible A..see how it develops as more info becomes available.


TRX Short Term Bull RunMostly just testing out the publish feature. Following TRXBTC and BTCUSD. TRX in my opinion is showing great technicals. My current price target is around 463 SATS

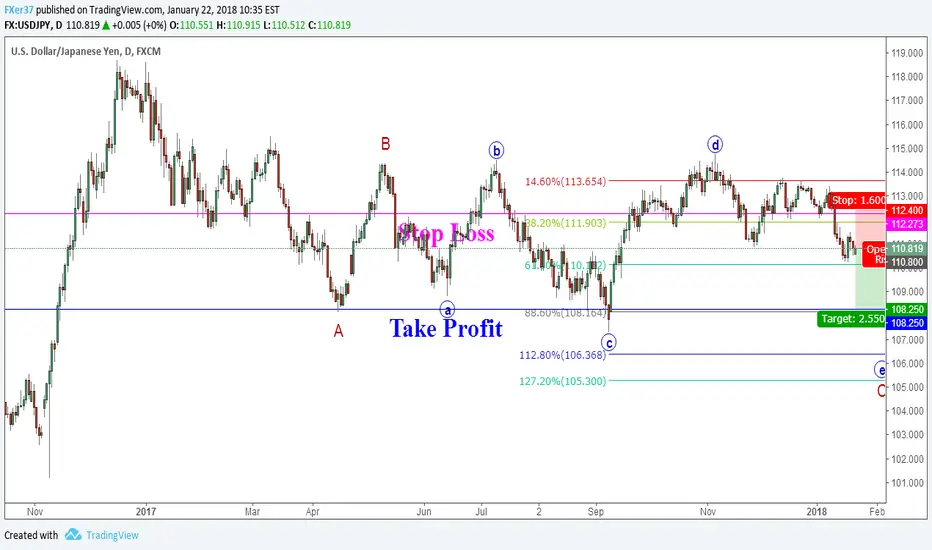
Strengthen Wave V, and Diffusion triangle is forming, Short UJReasons:
A. FX:USDJPY The wave V of diffusion triangle is working, and short-term bearish trend still intact.
B. The fall rhythm is great, showing the Fibo retracement 61.8% level is currently not enough to stop the downward trend. Morever, a downward gap occurred on Monday which predict trend contiune to fall.
C. The weekly chart shows the candlestick bearish combination form, and what’s important, the profit/loss ratio exceeding 1.5.
The fourth corrective wave completed, then downtrend, Short UCReasons:
A. The corrective wave had been finished, then downtrend is continuing and begin the fifth impulse wave;
B. The resistance of 50% fibonacci retracement is working now;
C. Reasonable profit and loss ratio.
Contraction triangle completed,continue downward trend. Short UJReason:
A. FOREXCOM:USDJPY The contraction triangle adjustment wave is basically completed, contiuing the downward trend since the peak of November 5, 2017;
B. Wave e alwasys below the trend of rising trend line, showing that the momentum of the rally has been declining, and the short potential energy has gradually increased;
C. Reasonable profit and loss ratio — with a defensive position above the downtrend line.

Fifthwave finished and contraction triangle broken, Short GjReasons:
A. The fifth motive wave had been finished;
B. The uptrend line is effectively broken;
C. Reasonable profit and loss ratio.

The fifth wave had been finished, short GBPUSD is good choiceReasons:
Firstly, due to the structure of fifth wave had been finished, so the corrective wave will be coming;
Secondly, wave(1) is equal to wave(5) , it seems time and space are almost same degree;
Thirdly, the recent correction was the equivalent of 61.8 percent of the last wave(5) .

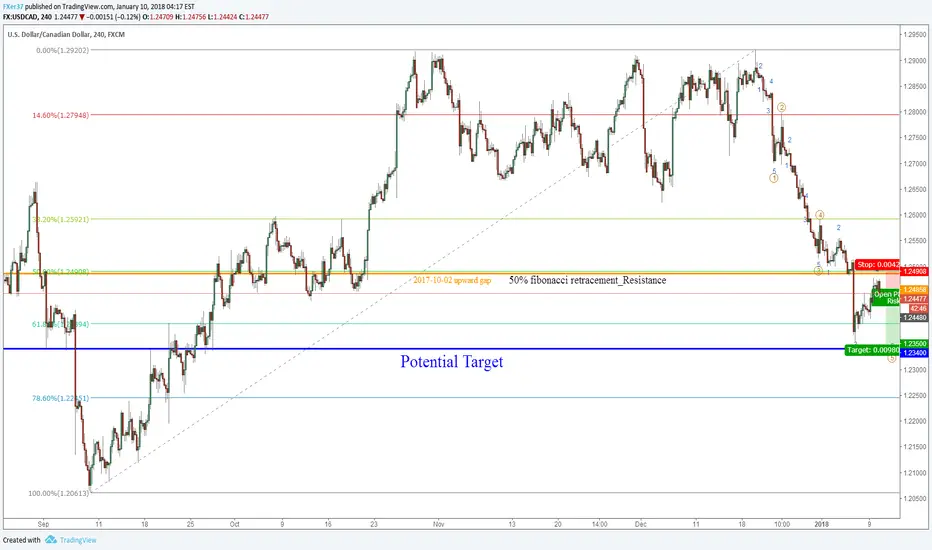
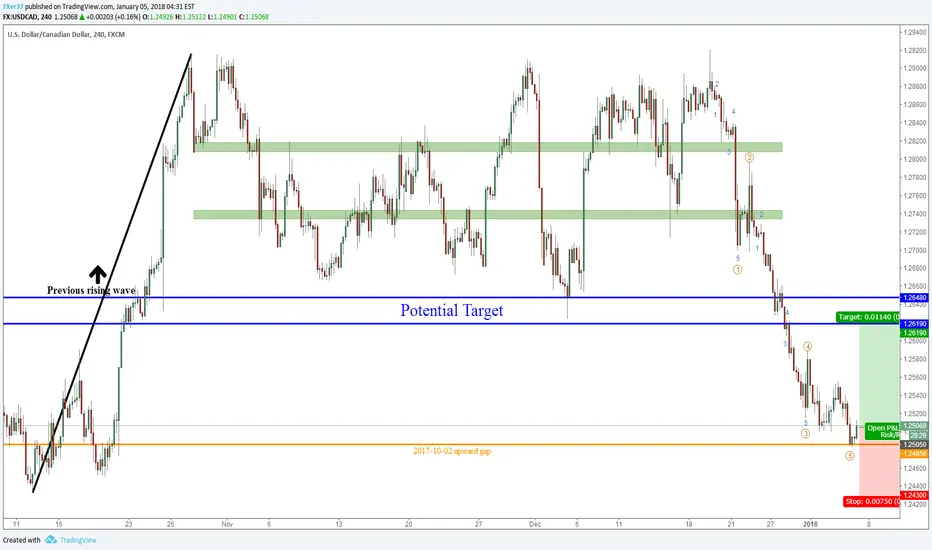
The first implue wave had been finished: good timeto Long USDCADReasons:
A. Due to the structure of the first implue wave (it had extended to fifth implue wave) had finished, the corrective wave is moving;
B. The upward gap which come from Oct 2nd,2017__It's price is about 1.24858 would be a great support, moreover is 88.6% retracement of previous rising wave.
C.In the same time, Recently the crude oil market tend to have a short-term correction.
The fifth wave had been finished, short GBPUSD is good choiceReasons:
Firstly, due to the structure of fifth wave had been finished, so the corrective wave will be coming;
Secondly, wave(1) is equal to wave(5) , it seems time and space are almost same degree;
Thirdly, the recent correction was the equivalent of 61.8 percent of the last wave(5) .


USDCHF: A lot of things on 1 chartHey traders,
On this USDCHF daily timeframe I'm looking to enter short in the grey reversal box. In this box we have:
50% Fibonacci retracement
61.8% Fibonacci retracement
100% AB=CD pattern
161.8% AB=CD pattern
Ending diagonal
Cheers
