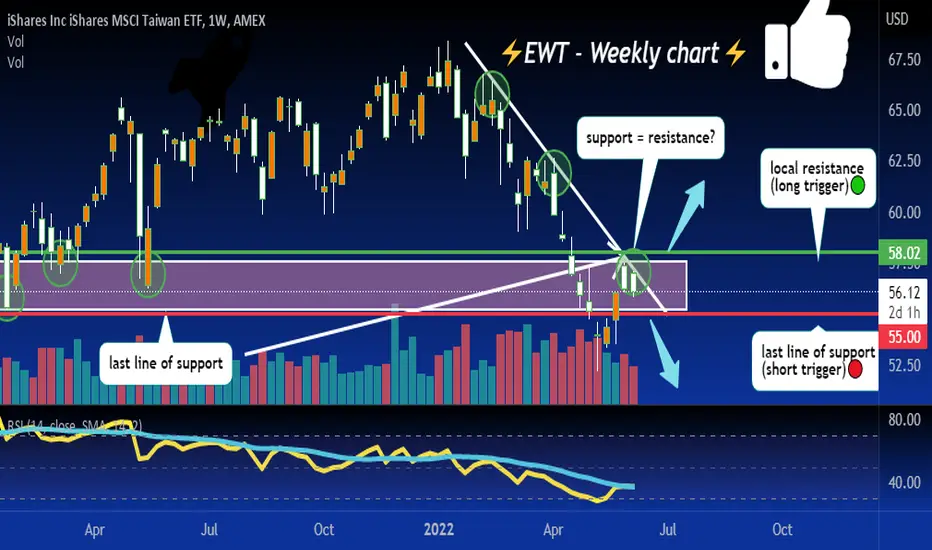
cluster resistance, not a good place to long! 🔴below local/trend resistance and recent support acting as resistance for now, not a good sign for longs.
Watching for longs above 58.02, shorts below 55
Key stats
About iShares Inc iShares MSCI Taiwan ETF
Expense ratio
0.59%
Home page
Inception date
Jun 20, 2000
EWT tracks an index that includes large- and midcap stocks, covering 85% of broad Taiwanese companies by market cap. EWT changed its name from iShares MSCI Taiwan ETF to iShares MSCI Taiwan Capped ETF on Dec. 1, 2016. It changed its underlying index from MSCI Taiwan Index to MSCI Taiwan 25/50 Index. The new index has explicit diversification requirements which may impact the weights of EWT`s top holdings. The capping methodology aims to limit the weight of any single issuer to a maximum of 25% of the Underlying Index. Additionally, individual issuers that constitute more than 5% of the weight of the Underlying Index cannot exceed a maximum of 50% of the weight of the Underlying Index in the aggregate.
Classification
What's in the fund
Exposure type
Electronic Technology
Finance
Stock breakdown by region
ALL INDEX HAVE CONFIRMED A MAJOR TOP WORLDWIDE I have moved in puts across all indexes a banking event jan 26


EWT - Taiwan getting rektWas wondering why Asia looks like crap tonight, Taiwan is getting rekt.... down over 5%
Keep an eye on EWT, this may wind up on my trade list


EWT - bullish Taiwan I might be being a bit over-optimistic here as always you can find a count that fits a more bearish direction if you look for it. I like this one however for now but I am still curious if, when and where we are going to see a decent wave 2 correction/pullback before it continues higher. Since the "

Money Wave Buy soon on Taiwan Fund (EWTMoney Wave Buy Signal on EWT when the Stochastic Closes > 20.
stockcharts.com


See all ideas