Bears BewareThe S&P 500 is setup in a third wave extension, likely to burn out around the 448 range. The pullback to follow this will likely start out slow as bulls pull back their bids overall. Expecting this pullback to proceed to the $422-$428 range in early-mid august. I am best at predicting what, not when. Trend lines do great help in trying to assess the pace of the wave-count.
This pullback will be the setup for one last bullish reclaim that could have us seeing as far as $460 before this correctional is completely finished up. This is one of the largest most substantial correctional waves we've ever seen on the S&P 500.
EWT

BTC- First WaveIt's so hard to fit this idea in a digestible way that can be viewed well. I've opted to just posting the most relevant part first and as we develop and update our count I'll post pictures till we're out of wave 1.
CURRENT STATE: MICRO COUNT - WAVE 2 (5 WAVES TOTAL)
We've got ourselves a nice little expanded flat it appears, the 1.618 extensions also line up perfectly with the VPR zone ($27,935) Honestly found my count to be very surprising especially on the eve of such bullish news for Bitcoin. But this is just the technical/wave count view.
Our long-term overall price target is still $40,000 for our main count linked in the idea attached.
Technical Notes
- Volatility we're expecting doesn't fit very well with the auto chart and I suppose I'm a bit to lazy to make the proper adjustments.
- No local trend lines so we're flying a little blind on the timeline of this move.
- VERY STRONG CORRELATION OF VPR + 1.618 EXTENSION!
This means this move is highly likely. Expecting it to happen rather rapidly.

BTC - Price will Bleed UPTIMELINE HERE IS NOT ACCURATE MOST LIKELY.
Separate posts will be made as we make each micro-wave for short-term predictions on how they'll most likely pan out. Maybe just plan on using this as a long-term guide/hub to all the other ideas I'll eventually link to this original one.
It was difficult to find relevant trend lines here so finding a timeline for the expected actions was difficult. The announcement of the largest securities brokers in America coming together to make a crypto exchange is indeed game-changing and will likely spark a significant rapid impulsive 5th wave extension likely to burn out around the $40,000 level.
Technical Notes
- The first wave was an expanded flat, so wave 4 did not enter the price territory of wave 1.
- The ABC count is so incredibly highly speculative just putting in their as an example of some idea of what I expect to see
-I do not expect price to follow these blue lines with any closeness, but they do represent the order of price targets I expect us to hit.
First Wave
This one will be the biggest, fastest, and most aggressive. But very likely will also see the biggest pullback. WE WILL NOT JUST GO STRAIGHT UP! But Very likely minimal pullbacks around the 5-7% range. Will post over the weekend what we're looking for specifically and link the idea here.
(Other Waves and notes will be posted here as we progress)

Unity - The Planned Sideways MovesUnity has recently had a significant pullback after finishing a solid 1-5 impulse set. This is purely a technical play, trend lines were hard to find here for this due to the ongoing sideways nature over the past year of this stock. I will be making a separate post in the coming weeks about Unity detailing the structural schematic appearing to be an accumulation setup (Referencing Wyckoff accumulation Schematic).
Technical Notes:
The B Wave's height/pullback expected is not known, just made a base assumption off of the top VWAP resistance.
The micro-wave count for the C wave is highly speculative.
Looking for this to play out over the next few weeks.

OKTA - Small Rise Before The FallOKTA - had a bad crash due to bad year-over-year earnings report despite crushing expectations.
Wave count suggests it was due, expanded flat setup, even with a good earnings report, very likely it would've rejected the 93.50 mark on the first attempt.
We're looking for a strong pullback followed by a lot more down-turn, towards the 1.272 expanded flat range of $60-$58 a share. VERY BULLISH AFTER THIS.

CVNA - Bulls Are Just BeginningCarvana is setting up for quite the run. Despite seeing a quick increase in price from $15 a share all the way to $26, this Elliot wave count presents a sizeable 3rd wave extension.
Right Now
It looks like we've completed a minute 3rd wave extension, price is looking to move in a serious pullback. The $15.20 range is a big aggressive! If bulls are impatient or a short squeeze is primed, the minute c wave may barely past the a wave.
Ahead?
We need to see more price action before getting more specific price targets, but in the short term (next 2 months) I am eyeing the $30-32 price range before our next major pullback.

EWT could change lives!no idea what this coin is or does but its nice seeing charts with so much potential!

Is a new bull market on the horizon? Likely, yes, but...... it can NOT lose the support at 403.90, or count invalidates, and has to break above 419.5 for confirmation, which will likely trigger an impulse higher up.

LAST Buying Opportunity For ENERGY WEB TOKENEWT or Energy Web token has reached its bottom.
Do you have the balls to buy?

A Case Study on NVDA, Risk Management & Head and ShouldersThe inverted head and shoulders (IH&S) pattern is a widely recognized technical chart formation that signals a potential reversal of a downtrend. This idea will analyze the recent price action of NVIDIA Corporation (NASDAQ: NVDA) stock and discuss the importance of risk management when price action reaches resistance after a substantial rise.
Analyzing the IH&S Pattern in NVDA Stock
a. The Setup: NVDA experienced a strong IH&S pattern, which has led to a significant rise in its stock price. This is not uncommon, as similar setups have been observed in other stocks like Apple (NASDAQ: AAPL). You can find other ideas that I have shared on AAPL recently.
b. Potential Target: The IH&S pattern in NVDA suggests a target price of $269, which has been obtained. There is an extension target of $289 which is only a few points away. The stock has increased by around 47% since the pattern was first identified, indicating that we might be approaching the point of diminishing returns. Also observe a bearish engulfing structure on the daily timeframe.
Preparing for a Potential Pullback
a. Pullback to $226: As NVDA approaches its target price, a pullback to $226 could be on the horizon. This could be triggered by a reversal or a simple retracement in the stock price.
Risk Management Strategies when Price Action Reaches Resistance
a. Assessing the Risk-Reward Ratio: As the stock approaches resistance, you should evaluate the risk-reward ratio to determine if the potential profit is worth the associated risk.
b. Setting Stop-Loss Orders: To protect against potential losses, you can set stop-loss orders at a predetermined price level below the current market price. This can help minimize losses if the stock price reverses unexpectedly.
c. Scaling Out Positions: Gradually closing out positions as the stock approaches resistance can help lock in profits and reduce exposure to a potential reversal.
d. Monitoring Technical Indicators: Keep an eye on technical indicators such as the Relative Strength Index (RSI) and Moving Averages, which can signal potential reversals and help you make informed decisions.
The inverted head and shoulders pattern in NVDA stock has provided valuable insights into its potential future price action. As the stock tagged its target, you should prioritize risk management to protect their profits and minimize potential losses. By understanding and implementing risk management strategies, you can make more informed decisions when dealing with stocks that exhibit patterns like the IH&S.
You will also notice I left a little easter egg on the chart which I will explain in more detail at a later date. This is the elliott wave theory structure. It would appear we've hit a wave 3 target and could be retreating for wave 4. This would suggest an ultimate target at a double top of the all time high. More details on that coming in the future.

EWT History Repeats itselfSame song different tune not financial advice im doing this to check back in the future
i just copy and pasted the current chart bars and had it respect the trendline then used fib levels
EWT energy web token and Polkadot relay chain web3
longterm targets you do the math

Ripple (XRP) Analysis: Understanding the Potential MovesRipple (XRP) has acquired significant attention from traders and investors recently, and it currently sits at a crucial point in its price action. I will analyze Ripple's recent performance and potential future scenarios from an Elliott Wave perspective. Additionally, I will discuss some of the factors that may influence Ripple's price, as well as its relationship with Bitcoin Dominance.
Recent Price Action and Elliott Wave Analysis
Ripple has experienced a strong move up to the resistance level of 56 cents, reminiscent of the spike in September 2022. This time, however, Ripple has managed to push slightly higher, reaching a current high of 58 cents. From an Elliott Wave perspective, it appears that we have completed a wave 3 at this high.
Extended Wave 3 and Potential Short-term Targets
There is a degree of likelihood that Ripple will surpass its current high of 58 cents in the near future if the market decides that breaking the 56-cent resistance (the September 2022 high) is worth pursuing further. This would indicate that we are in an extended wave 3 move, with short-term targets at 70 cents.
Wave 4 Cool Down and Retracement
If Ripple reaches the 70-cent mark, we can expect a cool-down period of at least a few weeks as the market enters wave 4. During this period, Ripple is likely to retrace back to around 60 cents before resuming its upward trajectory.
Bitcoin Dominance and Optimistic Scenario
The associated chart displayed in this analysis presents the most optimistic scenario for Ripple's price, assuming that Bitcoin Dominance behaves as expected when it reaches 50%. In this case, Ripple could experience significant growth throughout 2023.
Upper Limit for XRP in 2023
However, it's essential to exercise caution when holding XRP at higher price levels. If Ripple reaches 85 cents or higher, it may be wise to reevaluate your positions, as the top for 2023 could potentially be between 85 and 88 cents. Keep in mind that this is the most optimistic scenario, and it's crucial not to become overly attached to a specific price target.

Leading Diagonal Starts a Large Zig ZagIn the world of technical analysis, patterns play a crucial role in forecasting the future movements of a financial instrument. One such pattern is the leading diagonal, which can signify the start of a more extensive zig zag formation. In this article, I will delve into the recent price movements of the S&P 500 Index (SPX) and how a leading diagonal pattern has emerged as the beginning of a large zig zag formation. I will also discuss the significance of a leading diagonal in a zig zag formation and how it can serve as a valid trading signal.
Leading Diagonal Pattern in SPX
SPX recently witnessed a move that started around 3808 and peaked at nearly 4040. This price movement, characterized by a series of higher highs and higher lows, is indicative of a leading diagonal pattern. As the name suggests (leading), this pattern often appears at the beginning of a zig zag formation and is a valid formation within this context.
A leading diagonal is a five-wave structure, where each wave consists of three sub-waves. In the case of the SPX, we can observe this five-wave structure, which is now complete. The recent drop was expected, and the 4020 level has been a point of interest for some time. The index experienced an overthrow of this leading diagonal, and we are now below the lower trendline of the pattern.
Current Market Situation and Future Projections
At present, SPX is experiencing a small relief rally after falling below the lower trendline of the leading diagonal pattern. This indicates that bears are currently exhausted, and late short-sellers from yesterday are feeling the impact of time decay on their positions. As we move forward, we can expect a further move to the downside in the coming days or week, likely followed by a rally that takes the index back above the 4000 mark (potentially reaching the 4043-4050 range).
It is essential to keep an eye on the 61.8% retracement level, which stands at 4043. This level could be reached within the next two weeks and coincides with the next full moon, a period that I believe may present unique opportunities. You should be on the lookout for a potentially lucrative short position if the index reaches these levels.
At this time, I am not projecting any further out than the next few weeks, as the current primary path suggests a move back towards the 61.8% retracement level, followed by a potential short opportunity. However, it is crucial to keep in mind that market conditions can change rapidly, and you must remain vigilant and adaptable in their strategies.
The recent leading diagonal pattern observed in the SPX serves as a valid formation, signifying the beginning of a larger zig zag pattern. By monitoring the 61.8% retracement level at 4043 and the next full moon, traders can identify potential short opportunities in the coming weeks. It is crucial to remain vigilant, as market conditions can change rapidly, and traders must be prepared to adapt their strategies accordingly. This analysis serves as a guide for understanding the current market situation and identifying potential entry points, but it is essential to conduct your research and evaluate your risk tolerance before making any investment decisions.

Bitcoin: Navigating the Complexities of Market MovementsIn this update, I'm going to dive into a short analysis of Bitcoin's performance since last June, exploring three potential scenarios and their implications for both beginner and advanced traders. My aim is to provide an accessible yet technical discussion that caters to a wide range of users.
Scenario 1: Expanded Flat (BEARISH - top may be in or very close)
The first scenario we will consider is an expanded flat formation, which has a generally bearish outlook. An expanded flat formation consists of a 3-3-5 wave structure (A-B-C), with Wave B extending beyond the start of Wave A and Wave C extending beyond the end of Wave A. It's important to understand that Elliott Wave Theory is a complex analytical tool, and recognizing these patterns takes practice and experience.
While expanded flats are relatively rare compared to other market structures, the current Bitcoin chart shows some indications of this pattern. We can observe a 3-wave move into wave A, a 3-wave move into wave B, and a concluding 5-wave move into wave C. This pattern suggests a significant downward trajectory from the current price range, with a multitude of Fibonacci targets clustered within the first red box.
Scenario 2: 1-2 Wave Structure (BULLISH - short term target may be in or very close)
If Bitcoin's price movement is not following an expanded flat pattern, then we might be dealing with a 1-2 wave structure. In this case, we would still be completing a 5-wave structure, followed by an expected 3-wave correction. Many analysts predict that this correction will terminate at the 200-week moving average, currently at $25,600. However, if we are indeed in a 1-2 wave structure, it's likely that the correction will extend below this level, possibly reaching the $20,000 to $23,000 range.
Wave 2 usually retraces a portion of Wave 1 before the trend continues with Wave 3. The termination point of Wave 2 varies, but there are some general guidelines to consider:
Fibonacci Retracement Levels: Wave 2 often retraces between 50% to 61.8% of Wave 1. In some cases, Wave 2 retracement can be as shallow as 38.2% or as deep as 78.6%, but 50% and 61.8% are the most common levels.
Rule of Alternation: According to the Rule of Alternation, if Wave 2 is a deep retracement (closer to 61.8% or more), then the subsequent Wave 4 is likely to be shallow (closer to 38.2% or less), and vice versa. This rule helps traders anticipate the depth of retracements in Wave 2 and Wave 4.
Support and Resistance: Wave 2 may also terminate near areas of previous support or resistance from the price history. Support and resistance levels can act as barriers that either slow down or reverse the price movement.
It's important to note that while these guidelines can be helpful, market behavior is not guaranteed.
Scenario 3: Rising After Correction (BEARISH - prolonged chop and higher targets later this year)
Assuming Bitcoin's price does reach the lower target levels mentioned above, the next step is to evaluate the subsequent move. If we are in a 1-2 wave structure and entering wave 3, we could potentially see Bitcoin prices surge to around $60,000. However, the probability of this occurring is relatively low at the moment. A more plausible scenario is a downward move into June, followed by a price increase that may peak around $35,000 to $36,000 before declining again. This would also indicate a move to new lows (below $18,000).
It's crucial for traders to carefully analyze market patterns and consider various scenarios when making decisions. In the event of a significant price increase, it's wise to manage risk by taking profits and diversifying your assets. Keep a close eye on market developments and be prepared to adapt your strategy as necessary, always conducting your own research and consulting with a professional financial advisor before making any investment decisions.

📚 Elliott Wave Pattern: Flat 🌊●● Flat
❗❗ 𝙂𝙚𝙣𝙚𝙧𝙖𝙡 𝙧𝙪𝙡𝙚𝙨
● A flat always subdivides into three waves.
● Wave A is always a zigzag , flat or combination.
● Wave B is always a zigzag .
● Wave C is always an impulse or a ending diagonal .
❗ 𝙂𝙚𝙣𝙚𝙧𝙖𝙡 𝙜𝙪𝙞𝙙𝙚𝙡𝙞𝙣𝙚𝙨
● Wave A is usually a zigzag .
●● 𝙀𝙭𝙥𝙖𝙣𝙙𝙚𝙙 𝙁𝙡𝙖𝙩 ( Exp . FL )
❗❗ 𝙍𝙪𝙡𝙚𝙨
● Wave B always ends after the start of wave A .
● Wave C always ends past the end of wave A .
❗ 𝙂𝙪𝙞𝙙𝙚𝙡𝙞𝙣𝙚𝙨
● Wave B usually retraces 123.6 or 138.2% of wave A , less often — 161.8% .
● Wave C is often equal to 161.8% of wave A , less often — 261.8% .
● The most common type of flat.
●● 𝙍𝙪𝙣𝙣𝙞𝙣𝙜 𝙛𝙡𝙖𝙩 (Runn. FL )
❗❗ 𝙍𝙪𝙡𝙚𝙨
● Wave B always ends after the start of wave A .
● Wave C never goes beyond the end of wave A .
❗ 𝙂𝙪𝙞𝙙𝙚𝙡𝙞𝙣𝙚𝙨
● Within such a flat wave B should end well above the origin of wave A and that means wave C might reflect a 61.8% or even a 100% relationship to wave A .
● A running flat indicates that the forces in the direction of the larger trend at next higher degree are powerful.
● Wave B is usually no more than twice the length of wave A .
● Keep in mind that a running flat is rare.
●● 𝙍𝙚𝙜𝙪𝙡𝙖𝙧 𝙛𝙡𝙖𝙩 (Reg. FL )
❗❗ 𝙍𝙪𝙡𝙚𝙨
● Wave B never goes beyond beyond the start of wave A .
● Wave B always retraces at least 90 percent of wave A .
● Wave C always ends past the end of wave A .
❗ 𝙂𝙪𝙞𝙙𝙚𝙡𝙞𝙣𝙚𝙨
● The rarest type of flat.
__________________________
🔗 References:
Elliott Wave Principal 2005
Trade Waves / Elliott Waves Analysis (TWEWA)
📚 Elliott Wave Guide & Ellott Wave Archive ⬇️⬇️


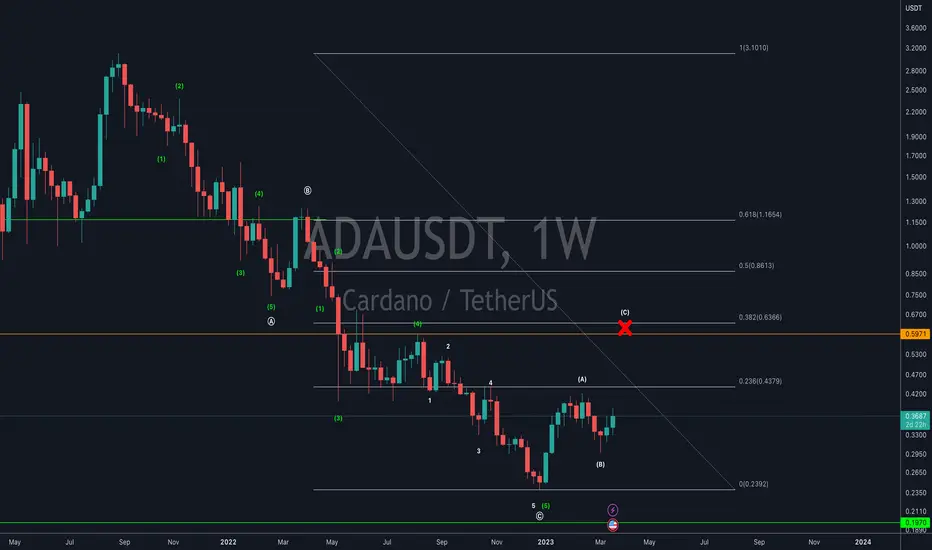
Cardano (ADAUSDT) and its Potential RecoveryCardano (ADA) is a decentralized public blockchain and cryptocurrency project, built on a proof-of-stake consensus algorithm called Ouroboros. Since its all-time high of around $3 in 2021, ADA has experienced a significant downtrend, reaching lows of about 24 cents. The combination of a declining asset and declining Bitcoin (BTC) creates an ideal environment for a potential reversal. I will examine the possibilities of a Cardano recovery within the next few weeks, using technical analysis tools such as support and resistance levels, Fibonacci retracements, and Elliott Wave Theory.
Key Levels and Fibonacci Retracement
Analyzing historical price data reveals key support and resistance levels that can provide insights into Cardano's potential price movements. The 23.6% and 38.2% Fibonacci retracement levels are noteworthy in this context. While the $1.16 level is a significant resistance point, it is unlikely to be reached this year.
The current target for an exit point in Cardano is around 60 cents. Although reaching the $1 mark is possible within 2023, it is more likely to occur towards the end of the year, if at all. It is essential to evaluate the market one day at a time and keep a close eye on Bitcoin dominance. If Bitcoin dominance drops significantly, this could create the perfect storm for altcoins like Cardano.
Bitcoin Dominance Support
The support level for Bitcoin dominance currently stands at around 40%. If Bitcoin dominance begins to fall to this level or break below, it could signal an opportune moment to stay invested in altcoins such as Cardano, and potentially delay selling until Bitcoin dominance finds support again. This shift in dominance could lead to substantial gains for Cardano and other altcoins.
Elliott Wave Theory Perspective
From an Elliott Wave Theory standpoint, Cardano's price movement appears to be corrective so far. To confirm an ongoing bullish wave 3, ADA would require a significant push to the upside. Traders and investors should continue to monitor the market's behavior, especially around key dates such as the full moon on April 6th, which could potentially impact market sentiment and price action. The Elliott Wave Theory also offers valuable insights into the potential for a bullish reversal, but it remains crucial to monitor the market and adapt strategies accordingly.
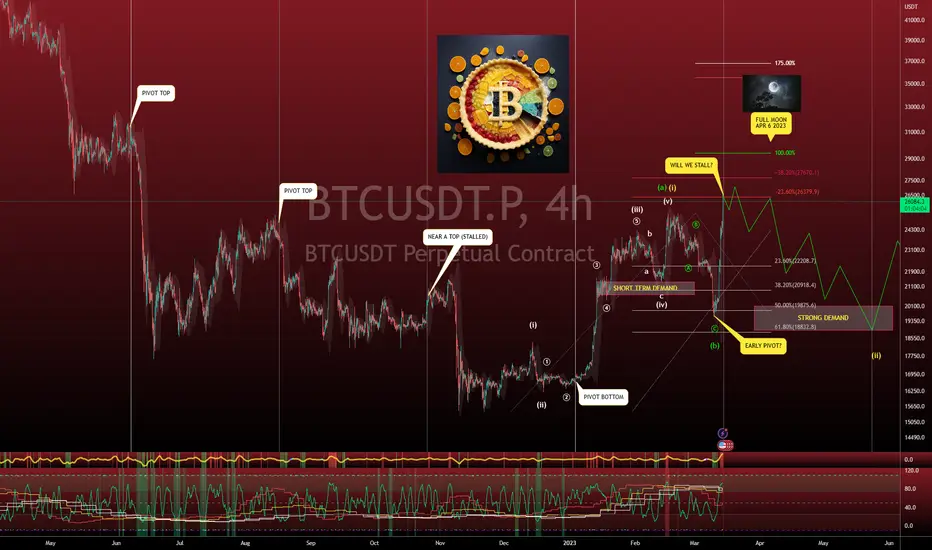
BITCON PIVOTS make a return (Happy Pi Day)Fred was a seasoned stock investor who had made his fair share of gains and losses in the market. But lately, he had been keeping a close eye on Bitcoin, convinced that the cryptocurrency was headed for higher prices. However, he was cautious about a potential move back to the $19,000 level, which was near the golden zone.
Despite his reservations, Fred couldn't help but feel optimistic about Bitcoin's recent performance. It had held well at the 50% area and was showing significant strength. However, he knew that momentum could stall in the time cycle window that they were entering.
As he monitored the market, Fred couldn't help but feel a sense of excitement and apprehension. He had a hunch that Bitcoin was on the brink of a major breakthrough, but he also knew that the market could be unpredictable.
Indicators are pointing to a move to roughly $27,000-$28,000 but depending on how long that takes, many indicators on higher timeframes will get to overbought status very quickly. The red wave has done a decent job of catching potential downside moves especially when we have gotten a sell signal. The last sell signal on the 4h timeframe on bitcoin was around February 16, 2023 and that resulted in a -20% move. The signs are early and I wouldn't make any harsh moves yet as things look incredibly strong but give it another week and we'll see where things are. Watch the red wave. If we pivot, we'd be creating some bearish divergence and if that plays out, then the green path seems likely to go to that golden zone by the end of May.
DON'T BE AFRAID TO TAKE SOME PROFIT OFF THE TABLE. Nobody survives in this market if you don't know how to manage your risk and take profits when necessary. The market can be generous and the market can be greedy.
AAPL Aims to Reach $160 Target in Near FuturePrice action in financial markets often gravitates towards key supply zones, which are areas where selling pressure has previously been strong enough to drive prices lower. Traders and investors often use supply zones as important levels to watch for potential price reversals or to enter short positions.
AAPL is no stranger to this, and when looking at the price action mixed with the key indicators on this 4h timeframe, we can see the last few times that the wave master indicator called a buy and sell:
DEC 10 2021: SELL: 179.50 (-6%)
DEC 30 2021: SELL: 178.19 (-14%)
FEB 03 2022: SELL: 173.00 (final warning -14% before -27%)
JUN 14 2022: BUY: 133.25 (+32%)
JAN 05 2023: BUY: 126.50 (+22.4% so far)
We're not geting a solid sell signal yet, but we're darn close. Look at ALL the waves. red, yellow, white are all overbought and the green wave is almost there. That will be the first time we've seen this since Feb 03 2022 but the chart formation looks more like the DEC 30 sell signal.
I'd be very cautious as a drop is likely to occur over the next 1-2 weeks. Probably won't be super deadly like other drops have been but it'll be enough to kill some late bulls for sure.

BOIL hit the boiling point FridayInvesting, investing,
Let's put our money to work!
Buying stocks and bonds and funds,
For our future we will perk!
BOIL, and natural gas in general spent what seems like forever capitulating. There was just too much supply but I expected demand will increase which would drive up the price of natural gas. Supply and demand are the main drivers of commodity prices as they determine the amount of a commodity available and the level of desire for it. When supply is low or demand is high, prices tend to rise, while excess supply or low demand can lead to price drops.
When news broke this morning, the price dropped 20% and we landed -20%+ at EOD Monday. If you look at the daily wave master (not pictured), you will see that there is significant chance that this little trooper will drop more. What is more important is that the move looked like it finished after a 60%+ move from the lows backon Frbruary 21st. Now, we wait. Lets see if BOIL and Natural Gas make new lows or if we'll find some support. Need patience on this one.

msft long $232-240msft wave count looks fairly decent. looks like we're getting a swing 1212 count.
would be looking to long between $232-240 zone with invalidation below $219.
set alerts at $240 and daily rsi oversold.

EWT/USDT- The breakout you do not want to miss. Great Setup for Energy Web Token-
If it can break the indicated level and flip resistance to support there could be some substantial gains to be made.
(A small break followed by a supported retest would be a major indicator for me and create the ideal setup)
Alternately if BTC continues to dip there should be some really good entry price options over the next month by simple DCA in the historic support zones.
If BTC plays friendly some high targets will come into play.
Keep an eye on it.
As always just my thoughts and TA,
Feedback Welcomed.
Bingaz.

Beginning Wave V of Impulse off July LoEnd goal is 506-510 by as early as April, but more likely May
Near term there is a decision point at 434 that will at least be tested for breakout in the coming weeks. If it breaksout expect 450, then pullback to test 434 for support, then finally move to low 500s.
Risk is definitely present with the possibility of filling gap down to 404.97; however, assume wave V is realized then it would be proceeded by a corrective wave to apprx. the wave IV low (in this case it would wait and fill gap down then and not now).
Highly recommended stock long-term based on my research on the company, IBD has 448.50 as the Buy-Point. DE impressed on earnings on Feb. 17, which can act as near-term catalyst if buyers pile in on this 0.618 pullback.
Not Financial Advice, but this is a Buy atm.
