FILUSDT — the formation is repeating, the structure is familiar.Filecoin(FIL) - is a decentralized storage system with the goal of "storing humanity's most important information." During its initial coin offering (ICO) in 2017, the project raised $205 million. The launch was initially planned for mid-2019, but the mainnet launch date was postponed until block 148,888, which occurred on October 15, 2020.
📍 CoinMarketCap : #50
📍 Twitter(X) : 667.3K
🔍 What I observe:
I’ve added the full trading history to the chart for better understanding (the chart on exchanges is cut off). The coin is liquid. I also added the prices for the public and private offerings.
There’s a large horizontal channel, or more specifically, a channel within a channel, which has been active for about 1111 days.
After another drop, a descending wedge formed, and now we are witnessing a breakout of its resistance (a retest is possible).
These patterns are ones I regularly track and trade, based on personal experience accumulated over the years and my strategy.
📊 I’ve plotted the nearest resistances and target prices with movement percentage calculations.
💭 It’s quite possible that this formation in the lower part of the wedge, coinciding with the area of lows on the support of the outer channel, was used to gather liquidity and shake out weak hands.
I also want to point out the large wicks in this zone - a characteristic pattern for accumulation points and subsequent reversals.
______
📌 Not financial advice. Observing structure and recurring phases.
Operate within your strategy and with an awareness of risks.
Falling Wedge

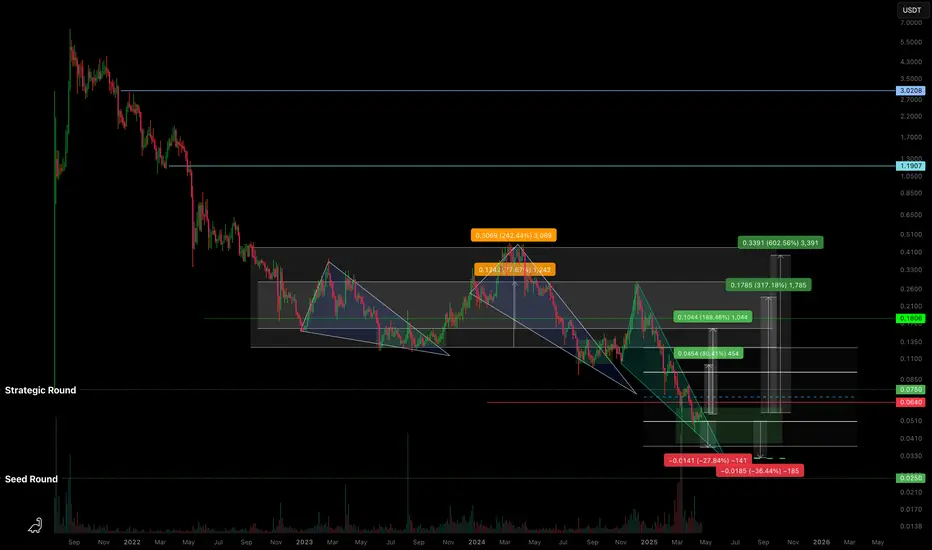
C98USDT — Descending Wedge & High R/R ZoneBased on the current structure, BINANCE:C98USDT is moving within a descending wedge , approaching zones that align with early investor positions.
🔍 What I’m seeing:
Potential drop into the range of a previous horizontal channel - marked on the chart.
We've already reached the Strategic Round level; below that is the Seed Round .
Assuming the project isn’t abandoned, it makes sense to expect investor defense in this zone.
From what I observe, there's likely accumulation happening from weak hands - at a discount .
🛡️ Approach:
As I’ve said before - you can’t treat coins like this in isolation .
They should be traded as part of a group of low-liquidity tokens , with proper risk management .
You can’t know in advance which one will “survive” without insider info from the team.
So the key is having a solid strategy and managing your portfolio and risk wisely .
📈 Targets:
Potential breakout targets from the wedge are marked on the chart.
If the market remains weak, I’ve noted a lower zone where consolidation might occur (sideways chop within a horizontal channel).
💭 Opinion:
The market is “paused” and waiting for a catalyst. You can’t rush it.
But zones like the current one on BINANCE:C98USDT seem attractive in terms of risk/reward .
The goal isn’t to guess - it’s to follow a pre-built strategy and stay focused .
📌 As always, this is not financial advice. Just my personal take and observations on the structure.
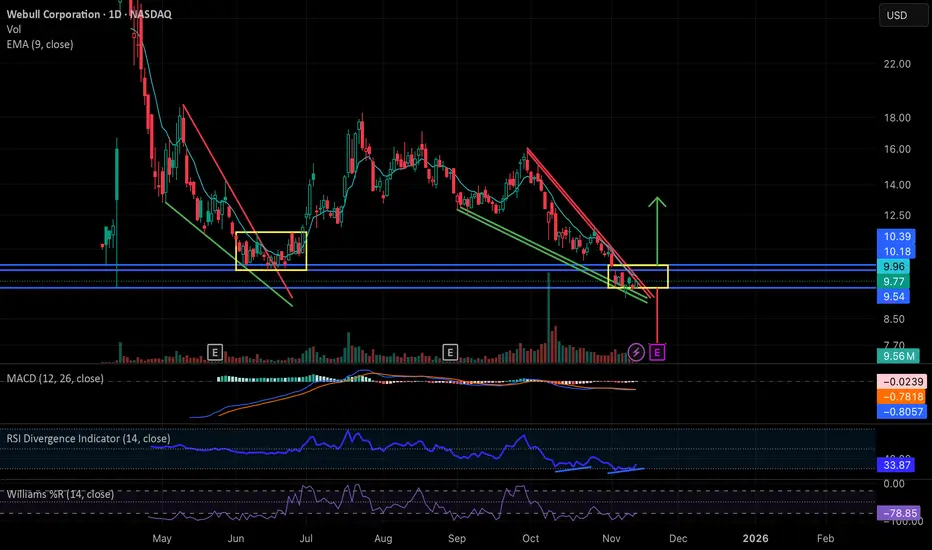
Webull: Falling Wedge Breakout ImminentNASDAQ:BULL has been in a steady decline essentially since the start of the government shutdown, forming a clean falling wedge structure very similar to the setup we saw in May and June. Back then, the wedge resolved with a brief breakout but ultimately moved into a sideways consolidation inside the yellow range before finally lifting in late June/early July.
Price is now sitting at the apex of a new wedge right as the government has officially reopened, almost to the day. With the president signing the bill, this may act as a macro green light for liquidity into year end, and BULL is positioned to potentially benefit from that.
Technically, the stock is deeply beaten down (roughly 40 percent from pre-shutdown levels), the MACD is starting to curl up, and there’s a clear daily RSI divergence. Together, these conditions make a relief move or breakout increasingly plausible.
If we don’t get a meaningful directional move between now and earnings on 11/20, then the most likely scenario is a replay of the May/June pattern: a period of sideways chop inside its current established support and resistance band zone around 9.54-10.18/10.39 while the market waits for the earnings catalyst. That report would then determine the next substantial move up or down.
In short: BULL is at a technical decision point, with momentum indicators improving, macro pressure easing, and earnings close enough that either a near-term wedge break or a consolidation-before-catalyst are both reasonable outcomes from here.
Bitcoin Falling Wedge Signals Breakout or Breakdown ZoneBitcoin is trading inside a falling wedge, a pattern that traditionally leans bullish when the breakout occurs.
At the same time, the price is approaching a historically sensitive region — the 112,000 USD zone, which is acting as the potential Point A (left shoulder zone).
If Bitcoin rejects from 112k–113k, this level may complete the left side of a developing head and shoulder formation, especially if the market loses its neckline later.
Important Supports to Watch
$97,000 → The most crucial support on the daily.
$97,500–$98,000 → Double-bottom demand zone.
$92,000 → The next major support & unfilled gap region.
A clean break below 97k will flip the entire market structure bearish and likely trigger a rapid decline toward 92k, confirming the neckline breakdown of a head and shoulder setup.
Bullish Scenario
If BTC forms a double bottom around 97.5k–98k, or if it sweeps liquidity and reclaims the level:
The falling wedge can break upward.
A push toward 112k becomes highly probable next week.
A breakout above 113k invalidates the bearish reversal and opens the way for continuation to higher levels.
This scenario requires a successful retest of the falling wedge breakout and strong volume.If BTC gets rejected at 112k–113k, and later breaks down below 98k, the chart will complete:
A textbook head and shoulder
A lost wedge structure
Momentum shift from bullish to bearish
This breakdown can trigger a high-velocity dump into the 92k gap zone.What Traders Should Focus On
112k–113k → Critical rejection zone to confirm the left shoulder.
97k–98k → Most important support and possible double-bottom area.
92k → Final downside target if BTC loses the neckline.
Watch for liquidity sweeps and volume strength to validate direction.Final View
Bitcoin is entering a decision phase.
The chart is offering both bullish wedge breakout potential and bearish head and shoulder risk, depending on how price reacts at 112k and 97k.
This is a position where traders should stay alert and wait for clean confirmation from either the breakout or the breakdown before placing major trades.

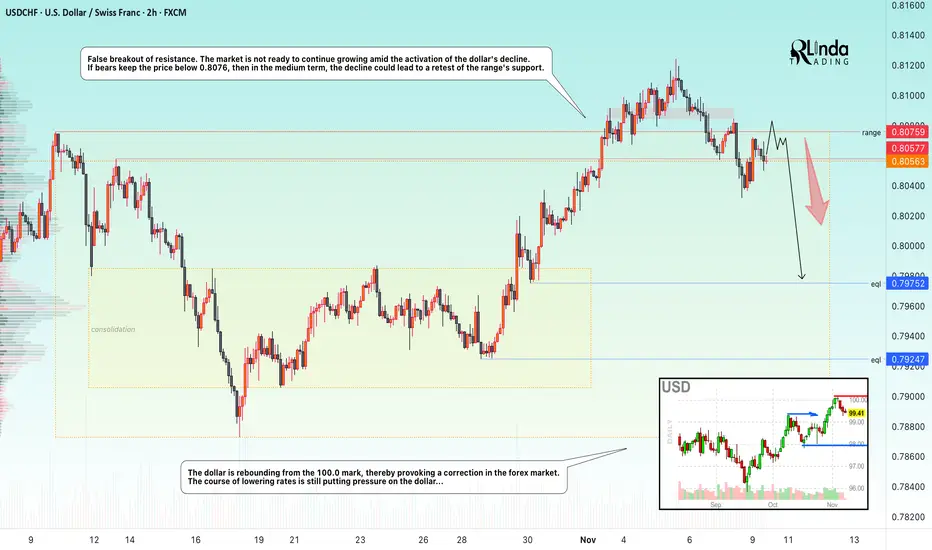
USDCHF → Manipulation? False breakout of resistance FX:USDCHF attempted to take advantage of the trend reversal opportunity after breaking out of a descending wedge, but the weak dollar hindered the rally...
The currency pair is facing resistance at 0.8076. There is no continuation of the momentum towards a breakout, and bearish pressure, which is intensifying as the dollar index declines, is negatively affecting the currency pair. The price has returned to the trading range, with an emphasis on 0.8057 - 0.8076. If the bears keep the price below this zone, this move could trigger further sell-offs.
Resistance levels: 0.8057, 0.8076
Support levels: 0.7957, 0.7925
The false breakout confirms that sellers currently have the upper hand and buyers lack the strength to push the price higher. Accordingly, consolidation below the key level could trigger a further decline towards the zone of interest at 0.7975.
Best regards, R. Linda!
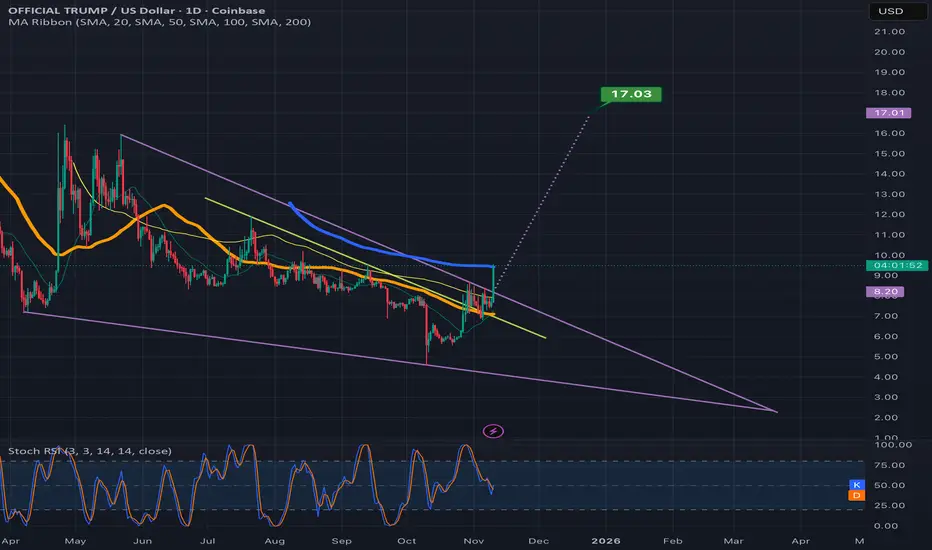
TRUMPUSD attempting to validate the falling wedge breakoutIt will need to flip the blue 200ma to solidified support to validate the breakout in my opinion but if it does it should 2x from its current value. *not financial advice*
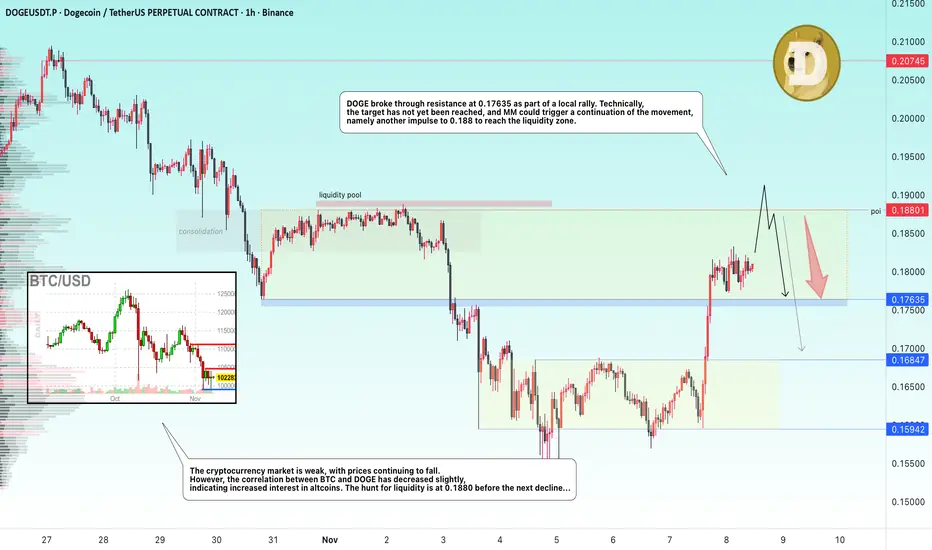
DOGE → The hunt for liquidity before the fallBINANCE:DOGEUSDT rose sharply on Friday. The reason is local news related to ETFs and Musk's tweet (it still works :) ). The growth potential may quickly exhaust itself...
The altcoin is strengthening, breaking resistance and consolidating between two important levels - 0.1763 and 0.188. The trend is bearish, the market is generally weak. I do not yet see any technical or fundamental potential for strong growth or a trend reversal.
In the current situation, DOGE may test the resistance zone of 0.188 due to the liquidity pool formed as part of local consolidation in early November. However, this liquidity pool may become a resistance to growth, which in turn may provoke a reversal and a fall.
Resistance levels: 0.188
Support levels: 0.1763
However, if the market does not allow the price to rise, it is worth watching the support level of 0.17635. Consolidation below this level will confirm the false breakout of the lower level and may trigger a decline.
Best regards, R. Linda!
$BYND - The Next GMELet's look at the thesis behind this idea :-
1) Massive Short interest.
2) Falling Wedge Pattern.
3) Diamond Hands are back again and This time they are supporting BYND.
4) Untapped Liquidity Resting above and possibility of liquidating Shorts would also be appealing to Market makers to supply Liquidity to HIGHER Bidders for building new Short positions.
From my speculation, this is highly risky play. But how to play it?
No need to go full APE.
Risk Assessment can be used. Assess your risk. Use a Stop loss. Accept your Risk. Always use a Stop loss with risk in mind of what you can afford to lose.
This is not a Financial Advice. Your gains and losses are your responsibility. I wish you good luck.
This idea is for educational purposes only. DYOR.
If you like this idea then Follow me please.

Opendoor Technologies (OPEN) – Bulls Still Holding the Door OpenWhat a ride it’s been for OPEN!
Back in early July 2025, the stock finally broke above its 50-day MA, and that was the spark that started an incredible rally — all the way to a major resistance zone from June 2022.
Then, as always, the market had to test everyone’s patience — a shooting star reversal formed, price pulled back into the 0.382–0.5 Fibonacci zone, and built a solid double bottom.
Once that double bottom broke out around 13–14 August, it was rocket fuel — a massive +247% run until 11 September 2025! 🚀
Since that peak, OPEN has been cooling off — retracing with low volume and shaping a falling wedge, which usually hints at bullish continuation. The price even bounced at EMA-50 and printed a hammer candle, showing that buyers are still defending the trend.
As long as the price holds above $6.23 (hammer support), bulls are still in charge.
Break that level? Then the bears might finally get a turn.
Until then — the door’s still open for another breakout! 😉
Trade Idea 💡
Bullish scenario: Wait for a breakout above the falling wedge with volume — that’s your green light.
Support to watch: $6.23 (hammer low).
Stop loss: Just below that support.
Take profit: Trail as long as price stays above the MA-50 or aim for the $13.70 zone .

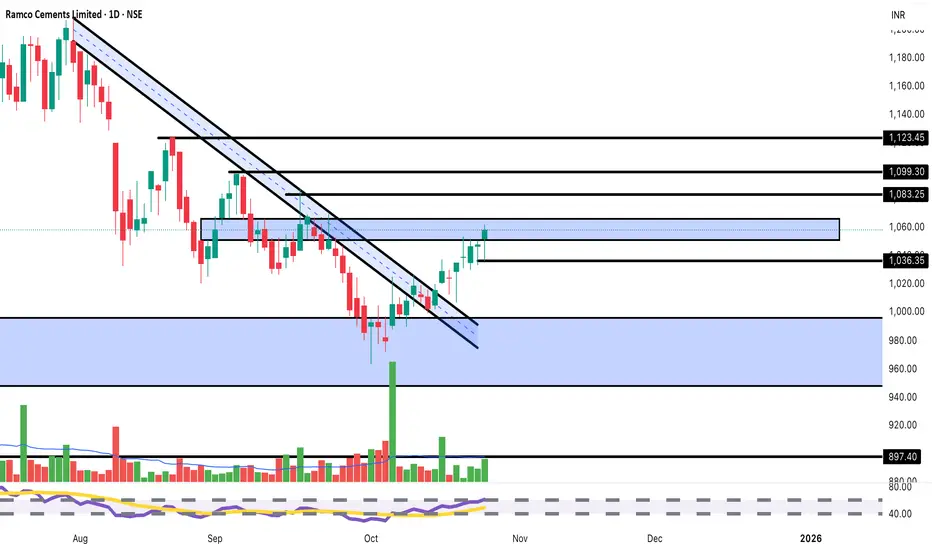
Ramco Cements Breaking Key Resistance | Target 1,100+BUY Setup 🏗️
Entry: ₹1,058-1,065 (Current Level)
Target 1: ₹1,083-1,090
Target 2: ₹1,099-1,110
Target 3: ₹1,123-1,135 (Extended)
Stop Loss: ₹1,036
Technical Rationale:
Breaking above descending channel (blue shaded area) - major bullish reversal
Strong momentum with +1.11% gain today
Price reclaiming 1,060 resistance zone
Breaking above both declining trendlines convincingly
High volume (343.03K) supporting the breakout
Consolidation zone (1,000-1,060) now acting as support
RSI trending upward, showing momentum building
Cement sector showing strength on infrastructure demand
Multiple resistance levels mapped: 1,036, 1,083, 1,099, 1,123
Clear support at 1,000 psychological level
V-shaped recovery from October lows
Risk-Reward: Strong 1:3+ ratio
Pattern: Falling wedge/descending channel breakout - highly reliable bullish reversal pattern
Strategy: Medium-term swing trade - Book 30% at T1 (1,085), 30% at T2 (1,105), trail remaining with SL at 1,065 after T1
Key Levels:
Breakout Zone: 1,060 (critical level crossed)
Strong Resistance: 1,083, 1,099, 1,123
Major Support: 1,036, 1,000, 980
Sector Catalyst:
Infrastructure spending boost expected
Cement demand picking up seasonally
For educational purposes only. Not SEBI registered. Major pattern breakout - manage position sizing appropriately. Cement stocks can be volatile. Conduct thorough research before investing.
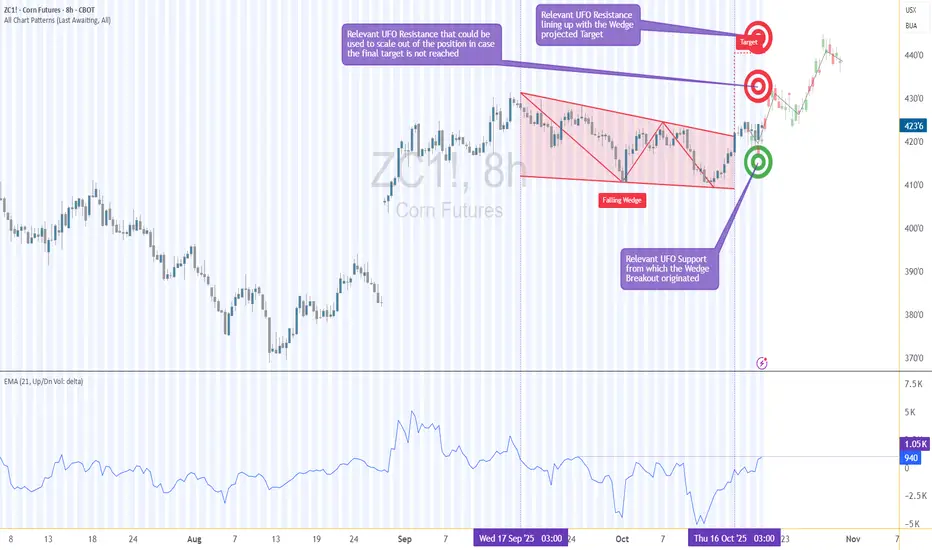
Breakout or Fake-Out — Corn’s Price Action Under the Microscope1. When Breakouts Lie
Few things in trading are more exciting than a clean breakout. But for every breakout that soars, there’s another that fakes out and traps eager traders.
Corn Futures (ZC) on the 8-hour chart just gave us that classic test — a breakout from a falling wedge that has traders asking: Is this the real thing, or another false alarm?
The pattern looks textbook. Price compressed lower within a wedge and broke above its upper trendline. However, the true strength of any breakout lies not in the pattern itself, but in the story told by volume and order flow. That’s what we’ll unpack in this article — using ZC (Corn Futures) and MZC (Micro Corn Futures) as our guide.
2. The Falling Wedge in Focus
Falling wedges often represent market exhaustion, where selling pressure slows and buyers quietly begin to accumulate positions. On the Corn Futures 8-hour chart, price has indeed pushed beyond the wedge’s descending resistance line — the visual signal that usually excites breakout traders.
But structure alone doesn’t make a sustainable move. Beneath the surface, the UFO support and resistance levels — zones of UnFilled Orders — provide the invisible scaffolding that can support or reject price movement.
In this case:
Support Zone: 418–411
Resistance Levels: 430 and 442
These areas represent pending potential new support and resistance areas where buy and sell orders that can act as launchpads or barriers. The key is to see how the market interacts with them while volume builds or fades.
3. The Volume Delta Story
Here’s where things get interesting.
Volume Delta — the difference between buy and sell volume — shows us who’s winning the tug-of-war between buyers and sellers.
During the wedge formation, the maximum delta reached +1.05K, indicating meaningful buying activity despite the downtrend. But as the breakout unfolded, delta turned slightly negative. In plain terms, fewer new buyers are stepping in — and without new buying energy, breakouts often lose traction.
That’s a classic setup for a potential fake-out: price pokes above the wedge, but order flow doesn’t confirm. This mismatch between technical breakout and volume delta is often the canary in the coal mine for fading momentum.
4. The Trade Logic — Let the Market Come to You
Instead of chasing the breakout, the smarter play here could be to wait for the market to revisit demand/support.
Why? Because that’s where new volume tends to enter — where pending buy orders (the UFOs) become filled, strengthening the delta and giving the move fresh fuel.
A potential plan might look like this:
Entry: 418 (within support)
Stop-Loss: 411 (below the zone)
Target 1: 430 (first resistance, partial exit)
Target 2: 442 (final resistance, full exit)
This setup maintains a clear reward-to-risk ratio above 3:1, assuming disciplined execution and volatility-adjusted sizing. It’s not about prediction — it’s about preparation. Waiting for retracement allows participation in a confirmed move, rather than reacting to emotional excitement at the breakout.
5. Contract Specifications & Margin Requirements
Understanding your instrument is as important as reading your chart.
Here’s what traders should know about these CME-listed Corn contracts:
ZC – Corn Futures (Standard Contract)
Contract Size: 5,000 bushels
Tick Size: ¼ cent per bushel (0.0025) → Tick Value = $12.50
Approx. Margin: Around $1,000 USD, varying by broker and volatility
MZC – Micro Corn Futures
Contract Size: 500 bushels (1/10th of ZC)
Tick Size: ½ cent per bushel (0.0050) → Tick Value = $2.50
Approx. Margin: Around $100 USD, varying by broker and subject to market conditions
Micro contracts allow smaller-scale traders to apply the same analysis and structure as the full-size contract, but with controlled risk exposure — a major advantage for capital management.
6. When New Volume is Injected in the Market
Think of Volume Delta as a glance in the rear-view mirror — it tells us what’s already been filled. On the other hand, analyzing support and resistance levels with the idea of where new unfilled orders might come in helps us prepare to enter trades just before momentum potentially reactivates.
When both are combined:
Rising delta confirms a healthier follow-through on breakouts.
Negative delta near resistance warns of a likely fading move.
Key support and resistance zones show where resting orders could inject new volume.
7. Risk Management — Protect Before You Project
Every solid trade plan starts with a stop.
For this setup, a logical stop below 411 ensures protection if the wedge breakout fails completely.
Scaling out at 430 reduces exposure early, locking gains in case the move stalls.
Always size positions relative to account equity and volatility — the most underrated edge in trading is survival.
The best traders don’t just hunt profits — they hunt consistency. Managing risk transforms a potentially stressful market environment into a structured decision process.
8. CME Context & Final Thoughts
Both ZC and MZC are cornerstone agricultural contracts traded on the CME Group’s CBOT exchange, giving traders exposure to one of the world’s most economically significant commodities.
While the setup we’ve explored is a case study, the takeaway extends beyond Corn:
Breakouts need participation. Volume confirms conviction. Key support and resistance levels reveal intention.
In markets where fake-outs are common, aligning technical structure, order flow, and patient trade planning gives traders the clearest edge of all — confidence grounded in data, not emotion.
When charting futures, the data provided could be delayed. Traders working with the ticker symbols discussed in this idea may prefer to use CME Group real-time data plan on TradingView: www.tradingview.com - This consideration is particularly important for shorter-term traders, whereas it may be less critical for those focused on longer-term trading strategies.
General Disclaimer:
The trade ideas presented herein are solely for illustrative purposes forming a part of a case study intended to demonstrate key principles in risk management within the context of the specific market scenarios discussed. These ideas are not to be interpreted as investment recommendations or financial advice. They do not endorse or promote any specific trading strategies, financial products, or services. The information provided is based on data believed to be reliable; however, its accuracy or completeness cannot be guaranteed. Trading in financial markets involves risks, including the potential loss of principal. Each individual should conduct their own research and consult with professional financial advisors before making any investment decisions. The author or publisher of this content bears no responsibility for any actions taken based on the information provided or for any resultant financial or other losses.
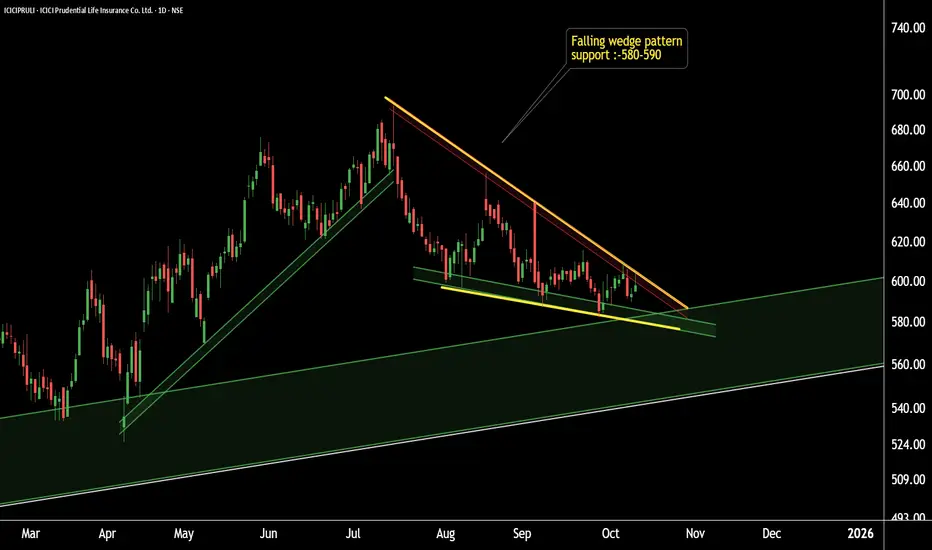
ICICIPRULI – Hidden Pattern Unlocked! Reversal or Continuation?ICICIPRULI Pattern Reveal
This is the daily timeframe chart of ICICIPRULI.
The stock is forming a falling wedge pattern, which is a bullish reversal setup.
Currently, ICICIPRULI is holding strong support near the 580–590 zone based on pattern structure.
If this level sustains, we may see higher prices in the coming sessions.
Thank You !!
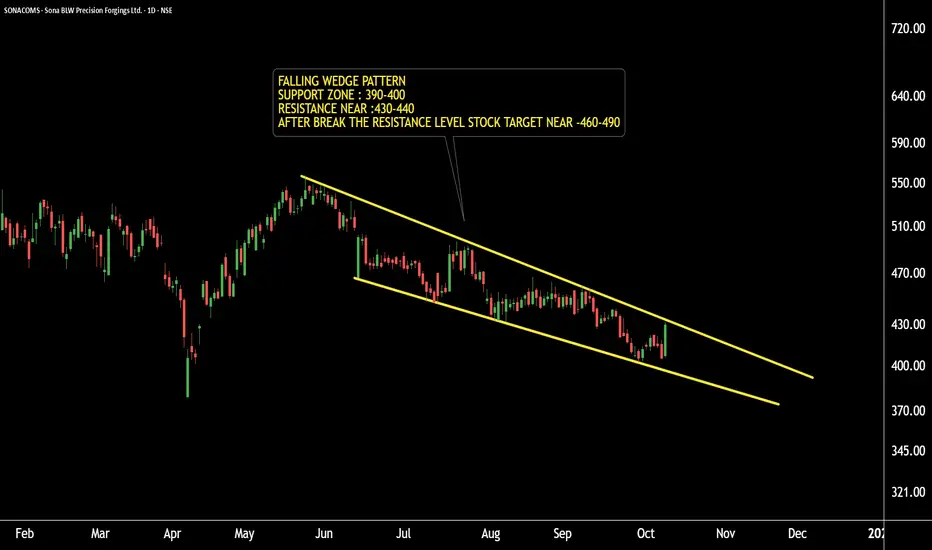
SONACOMS Technical Setup – Pattern Formation AlertSONACOMS – Falling Wedge Pattern Formation
Timeframe: Daily Chart
SONACOMS is forming a Falling Wedge pattern, which is a bullish reversal pattern in a bearish market phase.
The support zone is placed around ₹390–₹400 levels.
The resistance level is around ₹430.
A breakout above ₹430 may lead to pattern targets near ₹460 and ₹490.
If the support zone holds, we may witness higher prices in SONACOMS in the coming sessions.
Conclusion: Watch for a breakout confirmation for potential upside momentum.
Thank you !!
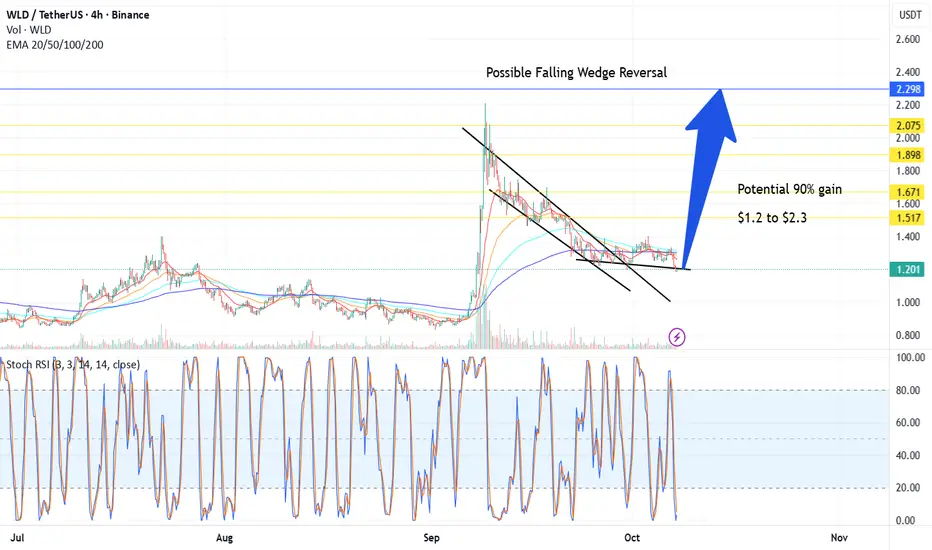
Possible Falling Wedge Reversal +90% run – 4H Setup - Worldcoin BINANCE:WLDUSDT could gain 90%
⚙️ Setup
Price has been trending down within a well-defined falling wedge since the local high.
Currently, it’s testing the lower trendline with Stochastics oversold and curving up, suggesting waning bearish momentum.
Volume has compressed, which is typical before a breakout.
We’re now at a decision point: either a bounce and breakout or a confirmed wedge failure.
Stochastics: Oversold (<20) with a possible bullish cross forming.
Volume: Decreasing — consistent with the final stages of compression.
EMAs: Price hovering around/under short EMAs (20–50); a close above them could trigger momentum shift.
📈 Plan / Hypothesis
Watching for bullish breakout confirmation above the upper trendline with increased volume.
Target: Height of the wedge projected upward (~ from breakout point).
Invalidation: 4H candle close below the lower trendline with volume expansion.
💭 Fundamenteal Thought:
We may or may not like Altman or Worldcoin's course of action to learn how to validate humanness, but the thing is, it's the only exposure we have to OpenAI and ChatGPT, and with AI everywhere, we are gonna need more than ever to validate people being real.
Considering Open AI, the disease, being worth $500 Billion, I think that the potential cure that Altman himself fabricated, Worldcoin, having a market cap of less than $3 Billion is pretty cheap. There's still many token to airdrop.
Anyhow, it all depends on what utility the token ends up delivering, I see that if this token is used to validate humanness, this will be really valuable. And ofc of what competitors do.
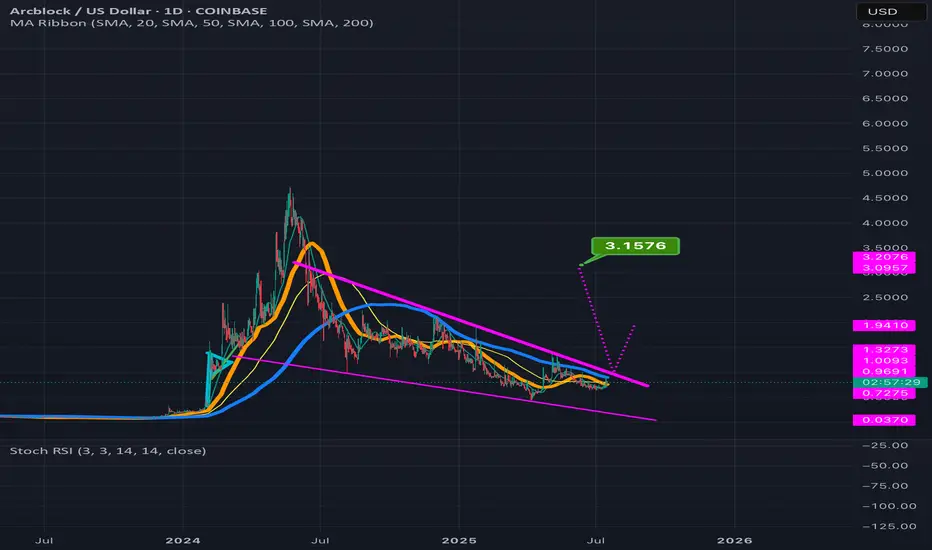
ABT can potentially 4x in value reading up from the wedge its inThe smaller pink dotted measured move line is for the inv h&s pattern its formed inside the wedge with the top trendline of the wedge doubling as the invh&s pattern’s neckline. Hitting that smaller target is more or less a 2x from current price action. If we hit the full falling wedge target that’s a 4x from where it is currently. *not financial advice*
CROX BULLISH OCT 7 2025Crox is looking good here as price has a support from higher time frames. Price is also trying to narrow its range. I am long here . Do not blindly trade any thing
Always manage your risk & then trade

What’s a Wedge Pattern?What's up traders! 👋
Wedge patterns are a powerful tool in technical analysis that can give you a heads-up about potential price moves. Whether you’re spotting a falling wedge or a rising wedge, these formations can reveal key signals about market direction.
What’s a Wedge Pattern?
A wedge pattern forms when price moves between two converging trendlines, creating a shape resembling a triangle. These patterns usually appear when the market is slowing down or consolidating before making a bigger move. Wedges can slope upwards or downwards, and the key difference lies in whether the trendlines are converging in an uptrend (rising wedge) or a downtrend (falling wedge).
Falling Wedge Pattern: Bullish Reversal 📈
The falling wedge pattern is a bullish reversal signal. This formation occurs when price moves between two downward-sloping trendlines, creating a series of lower highs and lower lows. The downward momentum weakens as the trendlines converge, indicating that sellers are losing strength, which sets up the potential for a bullish breakout.
How to Trade the Falling Wedge
Entry: Wait for the price to break above the upper trendline. This is your signal to enter long.
Target: Measure the height of the wedge at its widest point and project it upwards from the breakout point.
Stop Loss: Place it just below the most recent swing low to protect your position if the breakout doesn’t happen.
The chart illustrates a falling wedge pattern on the Bitcoin / Tether US pair with a 1-hour timeframe. Price action is contained within two converging downward-sloping trendlines, suggesting weakening bearish momentum. The breakout above the upper trendline signals a bullish reversal, and the subsequent uptick in price confirms the shift in momentum.
In rare cases, a breakout failure can lead to a bearish falling wedge pattern, but this scenario is less common. Keep an eye on the price action for signs of continued upward momentum.
Rising Wedge Pattern: Bearish Reversal 📉
The rising wedge pattern is a bearish reversal signal. This formation happens when price moves between two upward-sloping trendlines, creating higher highs and higher lows. The rising wedge indicates weakening buying pressure and a potential reversal to the downside.
How to Trade the Rising Wedge
Entry: Enter a short position once the price breaks below the lower trendline.
Target: Measure the height of the wedge and project it downward from the breakout point.
Stop Loss: Set it just above the most recent swing high to protect your trade.
Wedge Chart Pattern Trading: Key Tips ⚡
Context is everything when trading wedge patterns. If a bullish wedge pattern appears in an uptrend, it’s more likely to break to the upside. If a bearish wedge shows up in a downtrend, expect a breakdown.
Here are a few quick tips to improve your wedge trading pattern game:
Trendlines are key: Ensure your trendlines are drawn accurately. Properly drawn trendlines lead to better trades.
Breakout confirmation: Confirm breakouts with increased volume and, ideally, by checking for confluence with other indicators like RSI or MACD. A breakout without volume is often a false signal.
Risk management: Always use a stop loss to protect your capital.
Use other indicators: Wedge patterns work well with additional tools such as RSI, moving averages, or MACD. The more confluence, the better!
Final Thoughts 🏁
Wedge patterns, whether it’s the falling wedge pattern signaling a bullish reversal or the rising wedge pattern trading indicating bearish pressure, are some of the most reliable chart formations out there. But remember: no setup is perfect, so always use a stop loss and never rely on a single indicator.
With practice, you’ll get better at spotting these setups and timing your entries and exits like a pro. Happy trading, and may the charts be in your favor! 💰📊
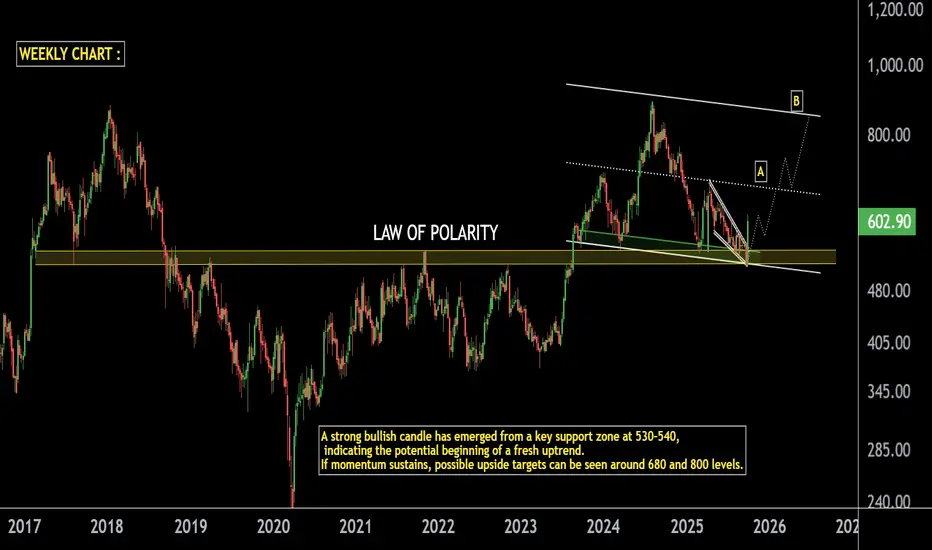
SUN TV on Fire: Explosive Move from Strong Support Zone.SUN TV Weekly Analysis
Support Zone: Stock is respecting the long-term LOP with strong support in the 520–530 range.
Bullish Candle: A powerful bullish candle has formed at this support zone, signaling strength.
Momentum Outlook: If momentum continues, a minor correction could act as a healthy pause before the next rally.
Resistance Levels:
First resistance / rally stop point near 680.
If 680 breaks, next resistance is positioned around 850.
Trend View: As long as the 520–530 support zone sustains, SUN TV may continue its rally in the coming sessions.
Thank You !!
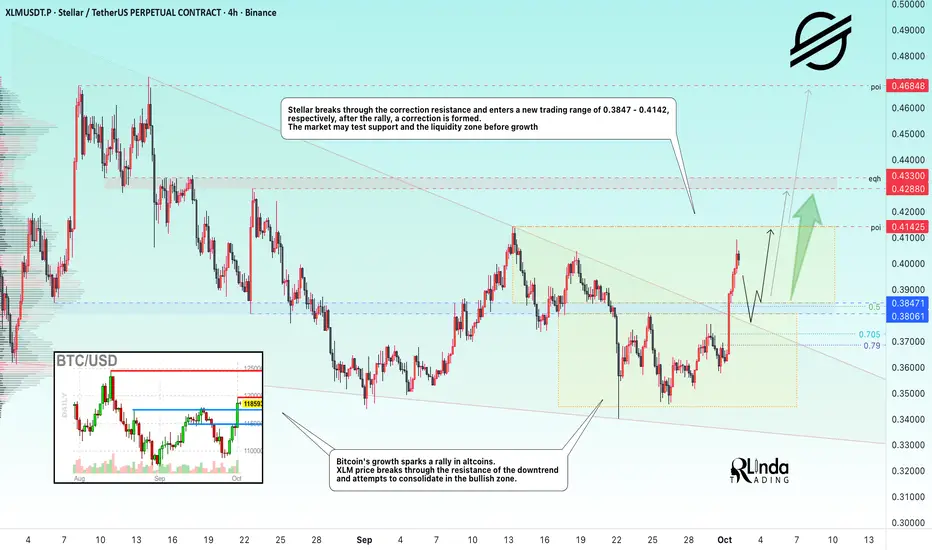
XLMUSDT → End of correction. One step away from a rally BINANCE:XLMUSDT follows the flagship currency in forming a rally and breaking out of the correction. The trend is bullish, but news is ahead. Will the bulls be able to keep the price above the risk zone?
Bitcoin's growth is provoking a rally in altcoins. The price of XLM is breaking through the resistance of the downtrend and trying to consolidate in the bullish zone.
Stellar is breaking through the resistance of the correction and entering a new trading range of 0.3847 - 0.4142, respectively, after the rally, a correction is forming. The market may test support and the liquidity zone before rising.
Resistance levels: 0.4142, 0.4288, 0.433
Support levels: 0.3847, 0.3806
As part of the correction, I expect a retest of the 1/2 zone of the formed impulse or the support zone of 0.385 (previously broken consolidation and descending wedge border).
If the bulls keep the price from falling even after the news, the coin may continue its medium-term bullish run to 0.4685.
Best regards, R. Linda!
NZDCAD → A false breakthrough will trigger a decline FX:NZDCAD is forming a countertrend correction with the aim of retesting key resistance and the liquidity zone amid a global downtrend.
A reaction to the support zone is forming. The price is recovering, but within the global downtrend. The countertrend movement may end in the resistance zone of 0.811 - 0.8125
The global trend is downward, but we are seeing a rebound within the retest of the channel support. There is a fairly large pool of liquidity ahead, which is capable of stopping the price from rising at a high speed. A false breakout of 0.811 - 0.8125 could trigger a decline.
Resistance levels: 0.811 - 0.8125
Support levels: 0.8056, 0.8030
A false breakout, consolidation below the specified zone, and a price close below the level could trigger a further decline.
Best regards, R. Linda!

NZDJPY → Consolidation amid a downtrend. What next?FX:NZDJPY is ending its correction and returning to the downward trend. The price is consolidating for a possible continuation of the downward movement...
The price breaks the support of the upward channel (countertrend correction). The movement occurs in a “step” format, which generally indicates weak demand. Clear consolidation boundaries are forming on the chart. The global trend is downward, and the local trend has also resumed its downward movement. Focus on two zones: 86.5 - 86.96. Within the framework of trading strategies, a false breakout of resistance or a breakout of support can be considered with the aim of continuing the decline.
Resistance levels: 86.96, 87.16
Support levels: 86.5
As part of consolidation, MM may form a liquidity trap on the resistance side, and a false breakout may trigger a further decline. However, if the bears increase pressure, the formation of a pre-breakdown base relative to the 86.5 support may trigger a breakout and a continuation of the downward movement.
Best regards, R. Linda!

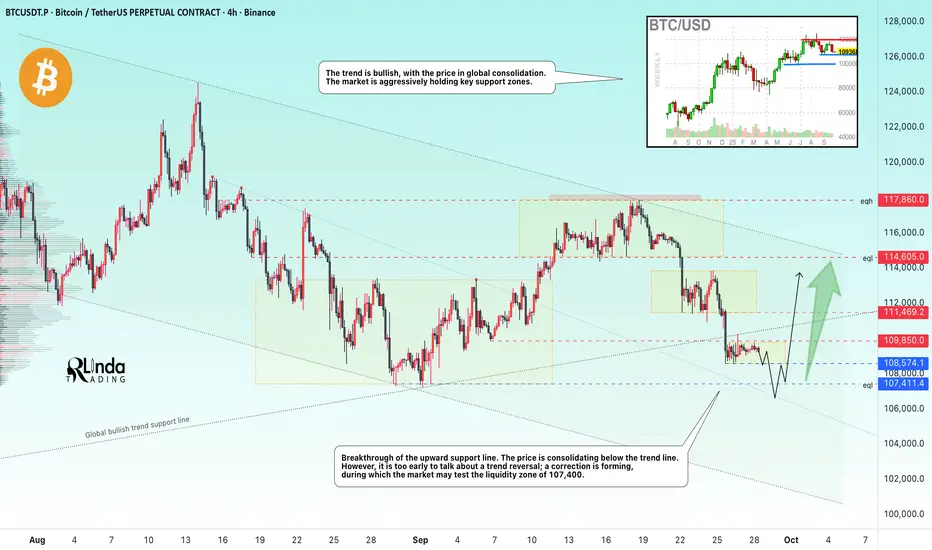
BITCOIN → Stagnation. A brief overview of the current situation.BINANCE:BTCUSDT.P is consolidating after breaking through the trend line support. Despite the positive fundamental background and bullish trend, the market is forming a countertrend correction.
The decline in interest rates in the US has had a negative impact on the cryptocurrency market. Can this be called manipulation? Most likely, yes. But the cryptocurrency market needs a constant driver to keep it alive; calm or neutral conditions lead to corrections and retests of intermediate lows...
As for Bitcoin, I have identified several key areas: the boundaries of the current consolidation at 109,850 and 108,575. Accordingly, a breakout and close above or below one of these boundaries could trigger a move in the corresponding direction. But within the local trend, we can expect a decline to the intermediate bottom of 107,400, from which an attempt at growth could form. In addition, an important zone is the conglomerate of resistance at 110K and the ascending support line. If the price can form an upward momentum and close above the trend support, the market may react positively.
Resistance levels: 109,850 - 110K, 111,500
Support levels: 108,500, 107,400
After breaking through the trend support, there is no momentum and the price is consolidating. This suggests that the market does not believe this premise and a battle for the area is forming. If the bulls can hold their ground and bring the price back within the boundaries of the uptrend, then it may be worth looking for a buying opportunity. Otherwise, it is worth waiting for a retest of the intermediate bottom at 107,400 before looking for an opportunity to open long positions.
Best regards, R. Linda!
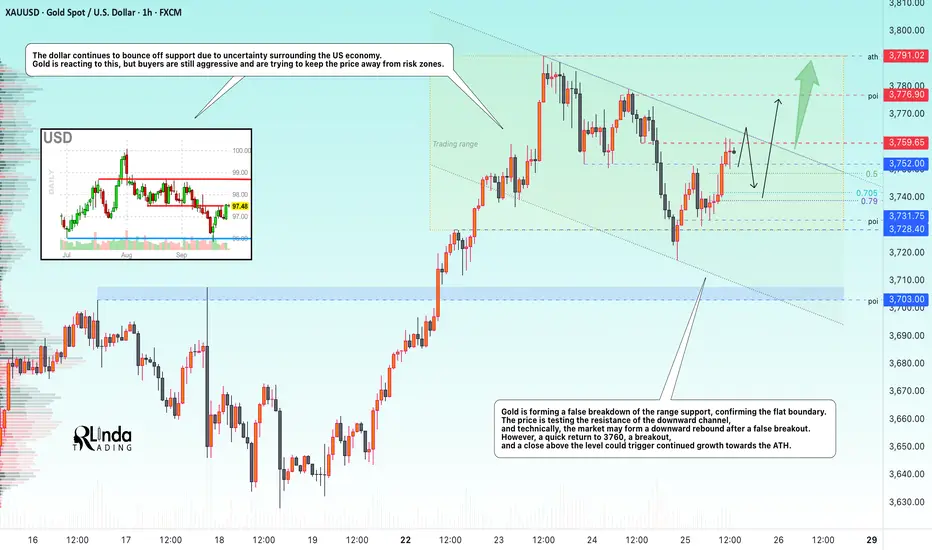
GOLD → Will the correction continue, or is it time for growth?FX:XAUUSD is inside a descending channel—corrections within a global bullish trend. The price is forming a retest of resistance, and the market's reaction to the 3760 zone will give further insight into price movement...
Gold is consolidating in the range of 3730-3790 in anticipation of US economic data and speeches by Fed officials. Pressure on the metal is intensifying due to revised expectations for rate cuts and a correction in the dollar...
Key factors: Markets have reduced expectations for easing to 43 bps by the end of the year after cautious comments from the Fed. The dollar index has reached a 9-day high, limiting gold's growth. Tensions between Russia and NATO are preventing gold from falling.
The market is in wait-and-see mode ahead of tomorrow's PCE data. Strong data today will strengthen the dollar and reinforce the correction in the metal, while escalating geopolitics will bring back demand for safe havens.
Resistance levels: 3760, 3776, 3791
Support levels: 3752, 3741, 3731
Technically, the market is testing downward resistance. Since the opening of the session, the price has already moved a lot and there may not be enough potential for an initial breakout. I expect a pullback to 3745-3740, and if the bulls return the price to 3760, the market will have a chance to break through resistance and continue growing towards the resistance level of the range.
Best regards, R. Linda!