Long term goal for BTCEvery 4 years BTC made another ATH. If BTC continues with that trend the next ATH will be around 170k +- 30k at the end of 2024. For this approximate target I used especially Fibonacci tools.
The 2024 halving will likely occur between February 2024 and June 2024.
This is my last chart on BTC . Enjoy!
Fib

ETH/USD - 1H - SetupETH/USD is in a bullish trend on 1H and bearish trend on 1D . The price action is currently testing an important resistance zone with a confluence of:
Falling Resistance (1D)
Horizontal Resistance (1D & 1H)
Bearish Candlestick pattern
AB=BC harmonic pattern
Fib being respected between 23% and 50%
Expecting bears to push prices lower towards 50% Fib.

AMZN on the Road?hello everyone
Here is my first chart from AMZN.
Basically LONG.
I actually didn't want to publish the chart until after wave 4 was completed. Now it's much more difficult.
Important points for scenario 1 with 55%:
- Stretched wave 3 should end above wave 1
- Wave 4 should end above wave 1.
Scenario 2 with 45%:
If the above points are not met, there will be a separate analysis.
I am speculating on scenario 1.
Have fun.
peace and out

SPY- Bearish- UpdateJust posting a quick update on the SPY here as on Friday we saw a hard rejection of the 400 level. The SPY closed out the week reclaiming its 50-day EMA and is sitting right on it at the moment, however, it rejected the 400 mark multiple times on Friday. Additionally, a bearish ABCD Elliot Wave has fully formed on the daily timeframe accompanied with some bearish hidden divergence on the RSI. Seems as if this bearish megaphone is continuing to play out so will be treading lightly at the moment.
Lastly, certainly worthwhile to note the importance of the upcoming week economically speaking. This coming Wednesday there's the upcoming FOMC announcement pertaining to inflation and interest rates, followed by the Fed Chair Press Conference, as well as various other economic data of the likes of GDP data, and new home sales. Staying hedged & scaling into long-term buying opportunities. Just some FIB levels and RSI-based supply and demand zones to keep an eye on in the meantime - (Previous Charts Attached Below).
--Previously Charted--

USD/CAD SHORTUSD/CAD auctions lackluster below 1.2900 displaying a lackluster performance in the early Asian session, the asset is juggling in a minute range below the critical hurdle of 1.2900.

Bitcoin Short if we hit this Area of InterestHere is my Bitcoin short idea that i'm looking at if we make it to this area of interest

Bitcoin using Elliot Wave Impulse and ABC corrective I've put this Elliot Impulse wave together with an ABC corrective and a possible entry around the fib golden pocket for anyone interested in maybe looking at this trade.
Thank you

Fibonacci Circle BreakoutA breakout of the 1.618 Fib level
Previous resistance can be seen at 1.618 (hammer)
Price has now passed straight through this area, now it should act as support
The fib circle is created by using the strongest trend available on this 9H chart

GMT | Possible cup with handle patternAs you can see, GMT after a very hard drop is trying to recover and appears to be inside this triangle where a cup with handle pattern is visible. If it holds the critical 0.83 level and bitcoin fails to drop below the local bottom, we could see GMT break this triangle up and point towards $1.50 again.

Get ready to trade this level on bitcoin | BTC I'm going to long bitcoin from the level i've market below but it needs to be watched, don't preset this on your exchange you need to watch it as it's a bit choppy in the weekly to daily level.
You can see the daily marked above where we bounced from the dollar.
This next level looks fairly strong to trade

DOGE in the local downtrend. Lots of energy on 1D.Hello everyone, let's take a look at the 1D DOGE to USDT chart as you can see the price has dropped below the local uptrend line.
Let's start by setting goals for the near future that we can consider:
T1 = $ 0.06843
T2 = $ 0.07035
T3 = $ 0.07241
T4 = $ 0.07513
and
T5 = $ 0.07849
Now let's move on to the stop loss in case of further market declines:
SL1 = $ 0.06040
SL2 = $ 0.05544
and
SL3 = $ 0.04919
Looking at the CHOP indicator, we can see that in the 1D range we have a lot of energy and the MACD indicator shows that we have entered a local downward trend.

Trent - Bamm but AB=CD hurdle with supplyTrent has BAMM but supply above with AB=CD is hurdle to meet BAT PRZ.

BTC ilerde ki çıkışı ön izlemesiBTC ilerde ki çıkışı ön izlemesi
Max 24000$
BTC 23011'i geçerse 24011'e çıkar sonra 23018'e iner
Short signals: 22300 den 21542'e kadar
Lütfen paylaşalım

LAZER LIGHT SHOW AMC So with my last two posts I just left the two/“three” un hidden. What will happen outside the box? Any guesses

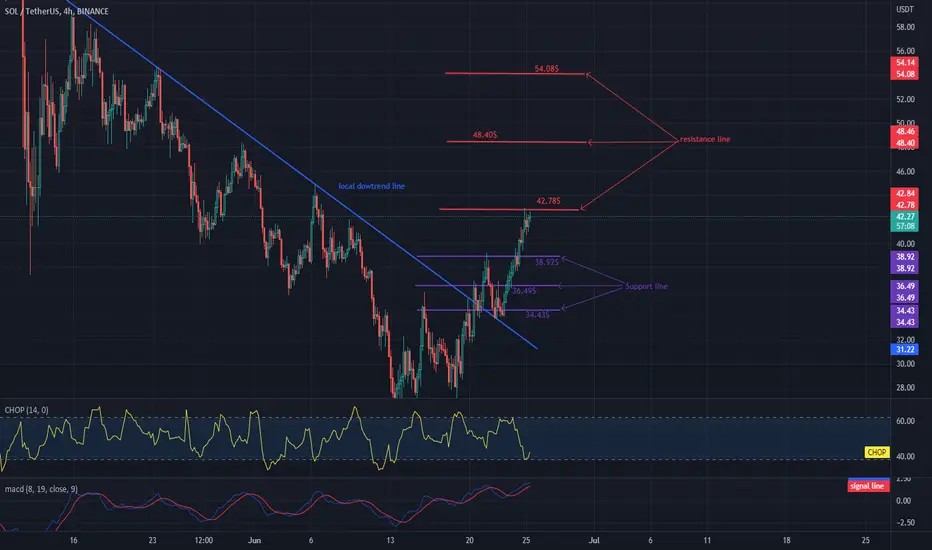
SOL is back to around $ 40Hello everyone, let's take a look at the SOL versus USDT chart over the 4 hour timeframe. As you can see, the price has broken the downtrend line and is above it.
Let's start with the designation of the support line and as you can see the first support in the near future is $ 38.92, if the support breaks down, the next one is $ 36.49 and $ 34.43.
Now let's move from the resistance line as you can see the first resistance is $ 42.78, if you can break it the next resistance will be $ 48.40 and $ 54.08.
Looking at the CHOP indicator, we can see that in the 4-hour interval the energy has been used up and is slowly bouncing back, while the MACD indicator shows a local upward trend.
Trend-based Fib extensions showing us the topI marked the blue 1.618 extensions that indicated the top before. When the 0.786 marks the local top, the 1.618 seems to indicate the next cycle's top. This cycle the 0.786 is at practically the same price as the 1.618 extension of the previous cycle !!

confirmation on GBPUSD for a buy!In my last video, I talked about buying on weekly and daily timeframes: sellers started getting exhausted.
Now, on H4, inverse head and shoulder pattern is recognized, with a big candle close above it. The trend retraced to the neckline finally and rejected up from the golden Fib buy zone.
Before taking this trade, watch the previous analysis in the video.
Joe.

Long term buy on GBPUSDGBPUSD is trending on a solid support, on the weekly chart, we will search for buy setups using Elliot Waves, Fib extensions (from many points of view) and Fib retracements.
We will also discuss the emotions of traders, where the sellers could start getting exhausted, and taking their profits so we can see the market bouncing.
Divergence comes at the end to confirm my trade.
Be careful, long-term trading needs a serious risk management, the stop loss is never close.
Don't consider the buy order at the end of the video, the recording run out of time and i couldn't explain the entry precisely.
This video is in Arabic language (Lebanese), I can start making english videos if you traders on tradingview are interested in my ideas.
Thankyou,
Joe

MRNA - More Fib WavesFib waves idea linking relevant information about my idea below
Similar areas are within corresponding colors

SP Futures ABC Elliott Wave correction is finished... BullishI believe the bigger ABC correction is finished.
All of the waves are super clean, and all fib levels and extensions are spot on for Elliott Wave measurements.
Doesnt mean it cant go into a more complex correction from here... but as far as the ABC correction... its finished imo.
SP is now starting a bullish wave 1 of a much bigger sequence that will eventually take it to ATH.
It appears it could be in wave 4 of the wave 1 now (wave 4 is often a triangle).
My analysis on tsla from april (see ) had the end of the c wave at possibly 620 (hit within $1)... and i see the same things in the ES for now with a clean 5 waves down for the C wave (has to be 5 waves).
4300 would be a good resistance spot for this move to stop, as there was a triple top at that level.
The big trade setup will be if price gets to the 4300 area, completing this first 5 waves up....
Then pulls back for wave 2 into approximately the 4000 area.
This will be a SCREAMING buy opportunity in my opinion, and a great entry for wave 3 up, which can often be the biggest wave.
Many things lining up for the bullish contrarian bet to be the right bet... We will see

LaVinci's 30-Day PlanUnfortunately, we cannot predict the future. We can, however, predict the immediate future as a function of our free will in conflict with the universe around us.
In anticipation of BTCUSD dropping to the 22,000 area, as a bearish harmonic extension distributes' itself, LaVinci has devised a plan to accumulate BTCUSD over the course of the next month.
The goal is to avert risk while simultaneously reap rewards by scaling into multiple LONG positions over the course of the above mentioned time period (30 days). Stop-Losses are also devised in the plan to scale out and liquidate the long positions in the event that the current structure fails to react accordingly. Take-Profits aren't being taken into account just yet, for the anticipated time that this position will be held is going to be between 70-90 days.
Please follow & critique, as critical feedback is strongly encouraged!
Thanks,
LaVinci


GMT in the local uptrend, SHORTHello everyone, let's take a look at the GMT to USDT chart over the 4 hour timeframe.
As you can see, the price is moving above the local trendline.
Let's start by identifying the stop loss we have in the near future:
SL1 - $ 0.9975
SL2 - $ 0.9070
SL3 - $ 0.7979
Now let's move on to the goals we may consider:
T1 - $ 0.9994
T2 - $ 1.0598
T3 - $ 1.1099
T4 - $ 1,7579
Looking at the CHOP indicator, we can see that in the 4H interval most of the energy was used, while the MACD indicator indicates a local upward trend.
