Eliana | BTCUSD – 30M – Intraday Market ConditionBITSTAMP:BTCUSD COINBASE:BTCUSD
After distribution near the 79,000–78,000 resistance range, BTC experienced a strong impulsive sell-off, confirming bearish dominance. The breakdown below 73,000 accelerated momentum toward the 69,000 liquidity pocket. Current bounce appears corrective rather than a trend reversal. As long as price remains below the broken structure and supply zones, overall bias stays bearish, with only intraday pullback opportunities for buyers.
Key Scenarios
❌ Bearish Case 📉 (Primary Bias) →
Rejection below 72,900 – 73,500 keeps sellers in control.
🎯 Target 1: 69,150
🎯 Target 2: 67,800
🎯 Target 3: 66,500
✅ Bullish Case 🚀 (Relief Bounce Only) →
Strong hold above 69,100 demand may trigger a corrective move.
🎯 Target 1: 72,900
🎯 Target 2: 75,000
🎯 Target 3: 76,800
(Bullish move is corrective unless structure flips)
Current Levels to Watch
Resistance 🔴: 72,900 – 76,800
Support 🟢: 69,100 – 67,800
⚠️ Disclaimer: This analysis is for educational purposes only. Not financial advice.
Fibonacci

GOLD - Correction (local downtrend). Range?FX:XAUUSD is showing increased volatility on Thursday, fluctuating within a wide range of 4800-5100. The market may move into consolidation...
Key fundamental factors
The USD's rise to two-week highs is putting pressure on gold. A weak ADP private sector employment report (22K vs. 48K forecast) supports expectations of two Fed rate cuts this year (limiting gold's decline). The agreement on negotiations between the US and Iran in Oman on Friday temporarily reduces demand for safe-haven assets.
Today's JOLTS (job openings) data and weekly jobless claims may strengthen or weaken expectations for Fed rates.
Gold is balancing between conflicting factors: a strong dollar and reduced geopolitical risks are weighing on prices, while weak employment data and general uncertainty about Fed policy are providing support.
Resistance levels: 4941, 5021, 5100
Support levels: 4856, 4751, 4670
The market is in a correction phase, with pressure in the 4950-5000 zones intensifying local sell-offs ahead of the news. The structure will be broken if gold breaks through the 4950 conglomerate and downward resistance and consolidates above this zone. But at the moment, I am considering a decline to 4751-4670 and a possible rebound with the aim of forming a sideways range.
Best regards, R. Linda!

Gamestop: Got To Love ItWell hasn't the narrative changed around GME
I've been WRONG and MORE WRONG about almost everything regarding pure timing with this one
But what I havent been wrong about is the fact that I said all last year that GME would hold that 20-22 region
What Im also not wrong on is the fact that there is NOTHING ABOVE 32
So what now?
No idea except I still feel the 20-22 region is the "floor" on GME and the price structure still points UP as far as I can tell
Where is the cat? No idea BUT I did say multiple times that GME DOES NOT NEED HIM TO RUN SIGNIFICANTLY HIGHER...and as we see someone else (i.e. Burry) is the recent viral catalyst
And the last question: Am I still in GME?
Of course :)
Good trading to you all!
P.S. I will not be responding to comments as this post is mainly just to document for myself a significant change in the GME story

Chumtrades XAUUSD Has Wave B finished?GOLD – DAILY PLAN
Has Wave B finished?
→ No confirmation yet.
Macro & Market Sentiment
US–Iran negotiations have been cancelled. Geopolitical risks remain, but not strong enough to trigger a new bullish wave.
Gold experienced a relatively calm trading session, failed to break above the key level around 5,100, and saw a moderate pullback during the US session.
The Daily candle formed a Spinning Top, indicating market indecision and consolidation, with a lack of momentum for a breakout.
👉 Macro factors are supporting prices, but not pushing the market into an immediate uptrend.
Technical Structure & Outlook
Price is still moving within a descending price channel.
On the H1 timeframe, price has broken above the 4,888 key level, showing a technical rebound.
However, the higher timeframe structure remains bearish, with no confirmed trend reversal.
→ Therefore, current rebounds are considered pullbacks within a downtrend.
Key Levels
Support: 4,810 | 4,830 | 4,700–4,750 | 4,650–4,624
Resistance: 4,950–5,000 | 5,100
Trading Scenarios
Primary strategy: Sell the rallies within the descending channel.
Look for SELL setups near resistance zones, targeting lower lows.
Momentum SELL may be considered if price clearly breaks below 4,882–4,890, with confirmation on H2 or H4, targeting around 4,810.
No BUY positions while price remains inside the descending channel.
👉 Only if price breaks and holds above 5,100, will we start reassessing a trend-following BUY scenario.
👉 Deeper pullbacks are viewed as potential zones for swing BUY opportunities, not short-term buys at this stage.
Note: The market is in a “confidence-testing” phase. Focus on zone-based trading, trend alignment, reduced position size, and avoid FOMO.

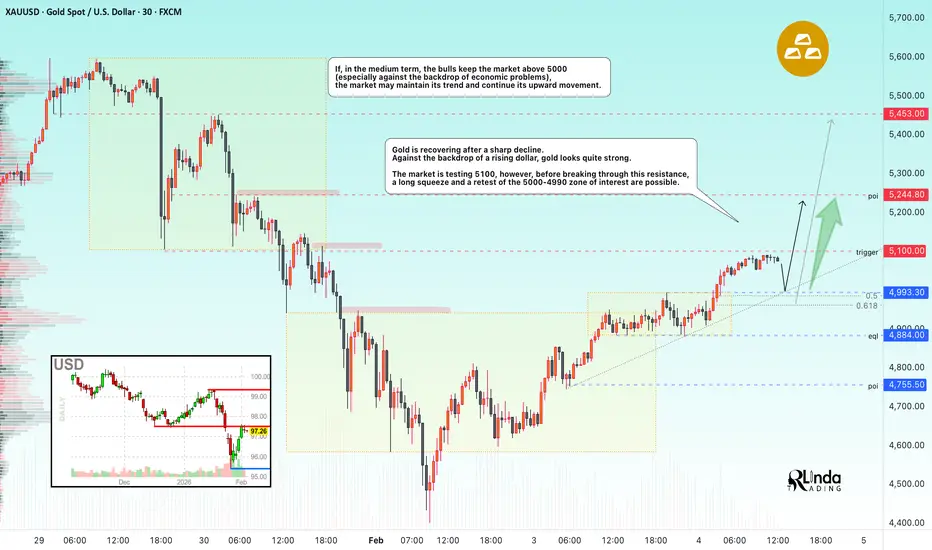
GOLD - Recovery. Pullback before growth to 5250...FX:XAUUSD continues its steady recovery. Against the backdrop of a rising dollar, the price of the metal looks quite strong... The rebound is due to the return of demand for safe-haven assets.
Geopolitics: US-Iran and new stages of escalation in the Russia-Ukraine conflict after a brief respite.
Uncertainty surrounding Fed policy under likely chair Kevin Warsh: on the one hand, expectations of lower rates, on the other, his reputation as a “hawk” and plans to reduce the Fed's balance sheet.
End of the shutdown and dollar weakness: The signing of the funding bill ended the partial US government shutdown, but delays in data releases (employment report) remain, which is holding back the dollar and supporting gold.
Today, the market is awaiting the ADP private sector employment report and the ISM Services PMI. The data will determine short-term market sentiment.
Resistance levels: 5100, 5150, 5250
Support levels: 5050, 5000
Technically, the local trend coincides with the global one, which generally indicates a bullish market sentiment. The formation of local movement and intraday bars indicates the presence of bulls.
Before breaking through 5100 and continuing to grow, the market may test the support zones: 5050 / 5000. A long squeeze and holding the price above key zones may resume growth.
Best regards, R. Linda!
GBPUSD: Intraday Buying Setup 04/02/2026The FX:GBPUSD pair dropped after the DXY reversed to bullish. Since the start of this week, the price has been declining. We’ve identified a potential buying zone where we believe the price will likely move. Once the price reaches our marked ‘point of interest’ the trade will activate and you can set a stop loss based on your analysis and risk management.
If you agree with our work, please comment below.
Team Setupsfx_

S&P 500 Breakdown Retest — Bears in Control, Bigger Drop Ahead?Today, I want to share a short setup on the S&P 500( SP:SPX ). Given that the crypto market—especially Bitcoin( BINANCE:BTCUSDT )—has recently regained strong correlation with the S&P, this analysis may be important for the crypto community too.
The S&P 500, over the past 20 days, has shown upward moves with low volume, while downward moves have had stronger momentum and volume. This indicates bears (sellers) have more control. The reasons include Federal Reserve policy shifts and escalating Middle East tensions. Historically, such tensions have led to S&P declines.
From a technical perspective, on the 4-hour timeframe, the S&P 500 has broken its support zone($6,956-$6,925) and is pulling back to it.
From an Elliott Wave perspective, it seems the S&P 500 is completing its main wave 4, which likely has a Double Three Correction(WXY) structure.
I expect the S&P 500 to decline toward the support lines. If broken, we could see the index drop further to at least $6,853.
Note: If Middle East tensions escalate further, as news suggests, the index could drop suddenly. Conversely, any agreement (e.g., between Iran and the U.S.) could support a recovery. Stay tuned to the news flow.
Note: A decline in the S&P 500 to at least 6,850 could also lead to the loss of Bitcoin’s heavy support zone($78,260-$70,080).
First Target: Support lines
Second Target: $6,853
Stop Loss(SL): $6,979(Worst)
Points may shift as the market evolves
Can gold resume its bullish trend, or should we expect deeper corrections?
💡 Please respect each other's opinions and express agreement or disagreement politely.
📌 S&P 500 Index Analyze (SPX500USD), 4-hour time frame.
🛑 Always set a Stop Loss(SL) for every position you open.
✅ This is just my idea; I’d love to see your thoughts too!
🔥 If you find it helpful, please BOOST this post and share it with your friends.

GOLD: +5000 pips if it reverse from one of our entry! Dear Traders,
Gold has recently become more stable but also more manipulative. Predicting any specific move is really difficult. This is why entering at key levels is so crucial. There are two potential reversal zones: the first is slightly risky but the price movement’s nature can make it more worthwhile and accurate. For a lower risk approach, wait for the price to fall to our safe zone for entry or find another intraday entry opportunity. As always, trading involves extreme risk so ensure you follow risk management and conduct your own analysis and research.
Good luck and trade safely!

BTCUSD – Volatility Trap, Key Supports & Why MSTR Is the Cleaner
BTCUSD has spent the recent period range-trading while consistently producing false short-term signals. Breakouts failed repeatedly, triggering stop losses rather than follow-through. Classic behaviour of a market dominated by excessive volatility and leveraged positioning.
Long-term structure remains negative.
Over the past month, I noticed that MSTR (MicroStrategy) has been a far more reliable guide for short-term trend assessment than BTCUSD itself.
While Bitcoin price action was noisy and emotional, MSTR maintained cleaner structure and better signal quality.
This matters.
BTCUSD is currently plagued by false breakouts, likely driven by volatility and liquidations rather than real directional conviction.
MSTR, as an equity proxy with less leverage distortion, appears less emotional and more structurally consistent.
For this reason, both charts are useful, but for different purposes:
BTCUSD = precise entry levels
MSTR = structural confirmation / trend filter
Key Long-Term Levels (unchanged)
To reassess the structure, I went back to my last detailed long-term analysis from 01 December.
These levels do not change with price movement.
$70,859 is first / minimum target
▸ 50% retracement of the Bitcoin bull run that started in 2023
▸ Reached today below
$71,000 area a former congestion zone that gave way rather easily, highlighting the strength of the move.
The previous major resistance now is a serious support
$58,500:
▸ 61% Fibonacci retracement of the 2023 rally
▸ Completion of a classic ABC corrective pattern
⚠️ A clean break below $58,500 would invalidate the ABC correction and suggest a transition into a proper 5-wave downtrend.
At this stage, projecting deeper bearish targets is unnecessary.
The focus should be tactical, not predictive.
Short-Term Focus
1) Assess the reaction around $58,500 support
2) Look for a first opportunistic long, if signs of absorption appear
3) Given current volatility, a rebound from this zone would likely offer attractive short-term risk/reward, even if the broader trend remains corrective
BTCUSD will be used to fine-tune entries, while MSTR will remain the less-noisy lead for confirming whether this move stays corrective or evolves into a real trend.
Sentiment Note:
As usual during sharp drawdowns, bearish narratives will multiply.
“Cassandra” voices tend to peak near inflection points.
At the same time:
Traders who shorted the $86k breakdown will likely take profits
Some will attempt to ride a reflexive rebound.
Price reaction at key levels, not narratives, will define the next phase.

Coiling Like a CobraBeen tracking this textbook distribution since November and it appears that the market is coiling its way toward an explosive move. I personally have successfully traded the past few months like a protracted “short every bounce” opportunity and will continue to execute on my bearish corrective thesis until proven otherwise.
As a newer retail trader without decades of experience in weathering myriad market conditions, I did not possess the insight that I now have when the 2022 correction occurred. In fact, having only begun trading in January of 2021, just after the post-Covid parabolic recovery, my only reference point was the hyper-euphoric FinTwit regime of newly minted perma-bull millionaires. At that time the prevailing winds only blew in one direction—UP UP UP!
Across most of the Usual Suspects, SPY, QQQ, AAPL (as goes AAPL, so goes the market), Crypto, etc., everyone was buying the dip and getting rich. At least that’s what it looked like to me. So when the market dipped in January of ‘22, I took my port long with what appeared to be a sure thing. 0DTE calls became just the latest in a series of opioid-like addictions, and by mid-Summer I was financially dopesick, with no relief in sight. High tuition paid in full.
Fast-forward 3.5 years and here we are, all the perma-bears finally coming out of hibernation after the bulls’ exponential 10-20x gains. With nothing but bad news across the macro-verse, a looming AI bubble, failed Trump 2.0 expansion, flight to precious metals, the aforementioned textbook topping shows NQ already down-trending and multiple ES failures at 7000. Note that rising bearish volume since November. The fix is in. And it’s not looking pretty! ES 5000 incoming. Or I’m an idiot. Who knows?

BTCUSDT Strong Support ZoneBTCUSDT clear chart showing the weekly strong support zone based on fibonacci clusters .
Good LUck

XRP — $1 Won’t Hold📉 Ripple CRYPTO:XRPUSD continues its downtrend from last year’s peak, unfolding a lower‑low sequence and now threatening to break decisively below the $1 mark.
The bearish structure points toward the equal legs area at 0.79 – 0.34, though reaching this zone does not guarantee a bottom as the broader cycle remains weak.

META - a deeeeep pullback soon META had solid bull run and probably this gonna follow rest of the names in this pullback.
Short it anywhere with some longer expiry puts. My preference would be Enter and Exit with good R:R zones and take profits. Expecting a fast move to the downside soon.
I prefer to use round number targets as those zones have good liquidity for puts.
Target 1 - 680
Target 2 - 600
Target 3 - 555
Target 4 - 500
Target 5 - 450
Target 6 - 400

BITCOIN - Correction to 81K - 82K before the fallBINANCE:BTCUSDT.P is forming a correction after a decline. The market is testing 79,200 (the consolidation boundary), which could trigger a breakout and momentum for a retest of the liquidity zone.
The fundamental background remains weak, there is still no support for the market in this direction, and the crypto winter phase may continue for some time. Statistically, after a sharp fall or a strong trend, the market should move into a sideways range/flat, where accumulation for a trend reversal may form.
Bitcoin is in local consolidation after strong sell-offs. The market is storming 79,200 and, as part of the correction, may break through resistance and head towards the zone of interest 81,000-82,000 before falling.
The cryptocurrency market, like Bitcoin, is in a downtrend. The coin tested support at 75K, but the area of interest (74,500) was not reached. Accordingly, due to the relevance of the liquidity zone, the market may form a short squeeze and return to the target.
Resistance levels: 79,200, 81K, 82,000
Support levels: 77,850, 74,500
I expect two movements from the market. As part of the current correction, Bitcoin may form a breakout of 79200 and an impulse to 81-82K, but bears are likely to keep the market in this zone and provoke a further decline to 77900 - 74500.
Best regards, R. Linda!

SOL $80 bottom?CRYPTOCAP:SOL is accelerating in wave C of 4 and now coming into a major High Volume and 0.382 Fibonacci retracement zone where wave 4 has a high probability of ending.
Wave Cs are characteristically scary for investors and come with extreme negative sentiment and quick drops to add fuel to the fear. Thats why they are capitulation events.
Losing $80 bring up the weekly S1 pivot at $8.
Weekly RSI has hit oversold but with no divergence.
Safe trading

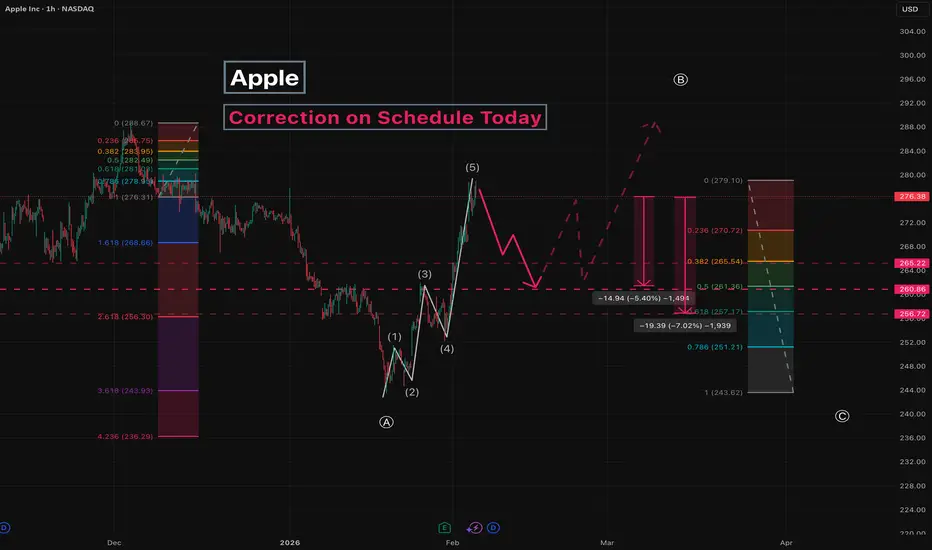
Apple - Correction on Schedule TodayWe continue to cover corrective moves in Apple stock.
Previously, we discussed Wave A .
Currently, the stock price is in Wave B .
The five -wave impulsive move up is complete and is now being corrected.
Key targets:
265 - local correction
260
256
Potential move from current level: 5-7% .
After that, expect a return to the growth phase,
with possibly one more small upward impulse toward the 290 area, slightly above or below, before Wave C develops.
---
Subscribe and leave a comment.
You’ll get new ideas faster than anyone else.
---
NZDJPY - Consolidation above previously broken resistanceFX:NZDJPY continues to follow an upward trend amid the weakening of the Japanese yen, caused by the rise of the dollar. The currency pair is breaking through resistance and trying to stay above the key level.
The Japanese yen continues to decline. The index is falling below 0.64, which only reinforces the movement. Against this backdrop, the NZD may strengthen.
The currency pair is breaking through the resistance of the ascending triangle, which only confirms the bullish sentiment. Consolidation is forming above 94.0. If the bulls keep the price above the key support, the growth may continue.
Resistance levels: 94.18, 95.0, 96.0
Support levels: 93.900, 93.65
Consolidation above 93.90 - 94.0 and a breakout of 94.18 will be a confirming signal of readiness to move higher within the bullish trend.
Best regards, R. Linda!

This Gold Range Is NOT Accumulation (Here’s Why)OANDA:XAUUSD
HTF high formed, followed by CHoCH → BOS to downside
Clear sequence of Lower Highs (LH) + Lower Lows (LL) → bearish structure intact
Price is now sitting at equal lows → liquidity pool + choppy / compression zone
This is distribution → sweep → continuation behavior, not accumulation (yet)
Trade Bias
Bearish continuation bias
Market is consolidating below broken structure, likely pausing before another leg down.
Primary Trade Setup (High Probability)
Sell on Pullback
Entry: 4,885 – 4,900
(Previous support → now resistance + trendline rejection zone)
Stop Loss: 4,930
(Above last LH & descending structure → invalidates bearish idea)
Targets:
TP1: 4,820 (equal lows liquidity sweep)
TP2: 4,760 (measured move of last impulse)
TP3 (extended): 4,700 (trend continuation target)
Aggressive Breakdown Option (Optional)
Sell below: 4,840 (clean hourly close)
SL: 4,900
TP: 4,760 → 4,700
>>>>> Trade Justification in a simple way <<<<<
Market has shifted bearish via CHoCH + BOS, confirming trend change
Price is retesting broken structure under a descending trendline
Equal lows = liquidity, likely to be taken before any meaningful reversal
Invalidation
If price closes and holds above 4,930, bearish setup is invalid → expect deeper consolidation or reversal.

Most Traders Will Buy This BTC Pullback — Pros Will Sell ItPEPPERSTONE:BTCUSD
Bias: BEARISH (Sell on pullbacks)
Why?
Clear HTF Break of Structure (BOS) after the 126k top
Sequence now = LL → LH
Strong impulsive downside move (institutional selling)
No Higher Low (HL) formed yet
>> Until BTC forms HL + breaks LH, bias stays bearish.
>> Market Structure Breakdown (What price is doing)
From your markings:
Final HH ≈ 126,300
HL broken → BOS confirmed
New LL around 65,400
Current move = corrective pullback, not reversal
>>> This is a bearish continuation structure.
> Why a Pullback is Expected (Logic)
After a strong impulse down:
Market must rebalance
Short-covering + late buyers create a pullback
Institutions sell again at premium levels
Your marked zones are correct:
FIB 0.50
FIB 0.61
Previous broken support = new resistance
>>>> SELL Trade Plan (Primary Setup)
>>> Trade Type: Pullback Sell (Continuation)
>>> Sell Entry Zone (Scale-in)
Entry 1: 78,500 – 80,000 (FIB 0.50)
Entry 2: 82,500 – 85,000 (FIB 0.61 + structure resistance)
>>> Wait for LTF bearish candle confirmation inside this zone.
>> Stop Loss (Invalidation)
SL: Above 88,500 – 90,000
Reason:
Above pullback structure
Above FIB 0.61 rejection
Protects against fake breakout
>> Take Profit Targets
>> Target 1 (Safe / Partial)
70,000 – 72,000
Previous reaction area
Psychological round number
>>>> Target 2 (Main Target)
65,500 – 63,500
Current LL
Liquidity magnet
>>> Target 3 (Extension)
58,000 – 55,000
HTF demand imbalance
Panic selling zone
>> Trail stop after TP1.
>> Alternative Scenario (What would change the bias?)
>> Bias changes ONLY if:
BTC forms a Higher Low above 65k
Breaks & closes above ~90k
Holds above broken resistance
Until then:
Any upside = correction, not bull market.
>> Risk–Reward Profile
Risk: ~5–7%
Reward potential: 15–30%
RR ≈ 1:3 to 1:5
This is professional-grade.
>> Trade Logic Summary (3 Lines – Pro Style)
BTC has completed a HTF bearish BOS after failing near 126k, confirming a LL–LH structure.
Current upside is a corrective pullback into FIB 0.50–0.61 and prior support-turned-resistance.
Selling rejection in this zone targets liquidity below 65k with bearish continuation bias.

Solana Breakdown Alert🚨 CRYPTO:SOLUSD has broken below the April 2025 low, confirming the bearish sequence from the 2025 peak and violating the neckline of the weekly Head & Shoulders pattern.
With price now trading under $100, the structure favors further downside continuation in the coming months, targeting the $50 zone and below before conditions align for the next bull market cycle.

Oracle - Seeking SymmetryLet’s examine the corrective impulsive move that began in September 2025.
When breaking this movement down into waves and sub-waves, we can observe multiple waves that are roughly equal in size at both the beginning and the end of the structure, marked in red .
If the wave count is correct, one final wave is still missing - its projected size is marked in blue .
This becomes especially evident if we extend a flat correction from the last completed fifth wave and take into account that it typically retraces 50–60% of the prior wave. Under these assumptions, the structure aligns well.
Additionally, when applying Fibonacci levels from the first impulsive wave, they converge with the projected completion area of the move.
Conclusion:
The move is targeting the 150 level. From that area, a new phase of price action is expected to begin.
---
Please subscribe and leave a comment.
You’ll get new information faster than anyone else.
---

Silver — Bullish Correction Into a Bearish WallSilver just printed a fresh bullish ABC on the 1H.
C-target sits around $96 .
Here’s the part that matters:
That $96 level is also a bearish WCL from higher timeframe structure.
So no, this isn’t a “new bull market” victory lap.
HTF is still bearish .
But this pullback? It’s doing exactly what a healthy correction should do — walking straight into HTF resistance.
That’s ideal.
What I’m watching:
Bullish sequence stays valid → price can tag the $96 C-target
That level = decision point, not a blind buy zone
If HTF sellers show up there, continuation lower stays on the table
If $96 gets accepted, HTF bias is in trouble
This is context , not prediction.
Correction into resistance first. Reaction second. Ego last.
Let price speak.
Not financial advice.

ENPH [Enphase Energy] EWP FIB TC ANALYSIS WEEKLY TFENPH – late-stage corrective structure
ENPH remains inside a long-term rising macro channel. The ATH at $339.92 marked the upper boundary, followed by a large corrective phase now unfolding within a descending channel.
Price is currently reacting near the 0.382 Fib (~31.12), but the main structural confluence lies lower in the 0.5–0.618 zone (~14.87 → 7.10), aligning with both the lower boundary of the corrective channel and the rising macro channel. RSI on the 3W timeframe is deeply oversold, suggesting downside momentum is mature.
A final flush into this demand zone would complete a textbook macro ABC correction, opening the door for reaccumulation and a potential multi-year continuation toward the upper macro channel.
This appears to be a bull-market correction, not a secular trend break.
Like and follow for more charts like this.
