IONQ | This Quantum Play Will Rock 2026 | LONGIonQ, Inc. develops and manufactures quantum computers. The firm specializes in quantum computing and quantum information processing. The company was founded by Christopher Monroe and Jung Sang Kim in 2015 and is headquartered in College Park, MD.
Fibonacci

ERIC | Communication Equipment Provider on the Rise | LONGTelefonaktiebolaget LM Ericsson engages in the provision of telecommunications equipment and related services to mobile and fixed network operators. It operates through the following segments: Networks, Cloud Software, Services, Enterprise, and Other. The Networks segment supports all radio-access technologies and offers hardware, software and related services for both radio access and transport. The Cloud Software segment offers solutions for core networks, business and operational support systems, network design and optimization, and managed network services. The Other segment refers to the media business and other non-allocated business. Segment-level information has also been presented to Other. The company was founded by Lars Magnus Ericsson in 1876 and is headquartered in Kista, Sweden.

BCHUSD Potential path ways - {15/12/2025}Educational Analysis says that BCHUSD (Crypto Pair) may give trend Trading opportunities from this range, according to my technical analysis.
Broker - Bitstamp
So, my analysis is based on a top-down approach from weekly to trend range to internal trend range.
So my analysis comprises of two structures: 1) Break of structure on weekly range and 2) Trading Range to fill the remaining fair value gap
Let's see what this Crypto Pair brings to the table for us in the future.
DISCLAIMER:-
This is not an entry signal. THIS IS FOR EDUCATIONAL PURPOSES ONLY.
I HAVE NO CONCERNS WITH YOUR PROFITS OR LOSS,
Happy Trading,
FX Pairs & Crypto Curreny Trade Analysis.
My Analysis is:-
Short term trend may be go to the external demand zone.
Long term trend breaks the new high after going from discount zone.

Silver Short: Video Explanation of the underlying wave countsOver in this video, I provide the video walkthrough for the previous idea published.

BTCUSD - Down, DownBitcoin completed a corrective wave A and has resumed its downward move.
The decline is most likely heading toward the 80k area.
The move lower is expected to be choppy, so targets remain approximate.
Primary target: 80,500
Intermediate target: 86,100
---
Please subscribe and leave a comment.
You’ll get new information faster than anyone else.
---

Why is $PG Procter & Gamble NOT good for Dividends nowFor dividends, companies need to have a relatively stable chart, or even some ups/downs are even better, but do NOT gamble (pun intended) on price.
P&G specifically MAY have reached the bottom of the fall, and get a short-term uptrend, but after that double-top and being within a descending channel, my feeling is that the downtrend will continue.
I would NOT get this risk for a little 3% dividend.
WHY?
I use dividends as an accelerator towards Financial Freedom.
FOLLOW me and check my profile if you want Templates and Reports to:
know the exact breakdown of your income to dedicate to Savings, Investments, Basic needs, etc.
Deep research of the best companies providing Dividends, 5-year Yields, with analytics and rationale.

CRK - Movement PotentialThe correction is continuing, and wave C has started to develop.
Wave C is expected to unfold as an impulsive move, pushing well below the end of wave A , while also being approximately equal in length to wave A.
Primary target: 10.3
Intermediate target: 17.1
---
Please subscribe and leave a comment.
You’ll get new information faster than anyone else.
---

BULLISH MOMENTUM-The market has tensing up for almost 5 days before finally breaking its structure with the buy move.
-On a weekly & Daily there is still a BUY bais.
-The market has been hinting for sells for a while but gave us nothing as the buyers are still in control.
-Im expecting a contiuation of our buys. This can only be confirmed with a pullback into the marked entry & a push up to the daily swing high.
MARKET BAIS⬆️
:WEEKYLY=⬆️
:DAILY=⬆️
:1HR=⬇️
NB:Whatever sells comes before the daily swing high has been swept/broken above is only temporary. Therefore any sells taken will be trading against the trend automatically putting me at a disadvantage.

Tesla - Falling DownThe bullish five-wave advance from Apr–Dec 2024 is complete.
Since Dec 2024, Tesla has been in a corrective phase.
Wave A (Dec 2024 - Apr 2025) was a five-wave corrective move.
Wave B (Apr - Oct 2025) formed a clear three-wave correction.
Sub-wave (C) correction is finishing. A brief upside attempt is still possible, but any short-term rise above 489 will likely make the subsequent decline of C deeper.
Tesla is in a major reversal zone.
A large wave C is expected, forming a five-wave impulsive decline to 210 or lower.
Summary:
A 50%+ decline in Tesla shares is expected in 2026.
---
Please subscribe and leave a comment.
You’ll get new information faster than anyone else.
---

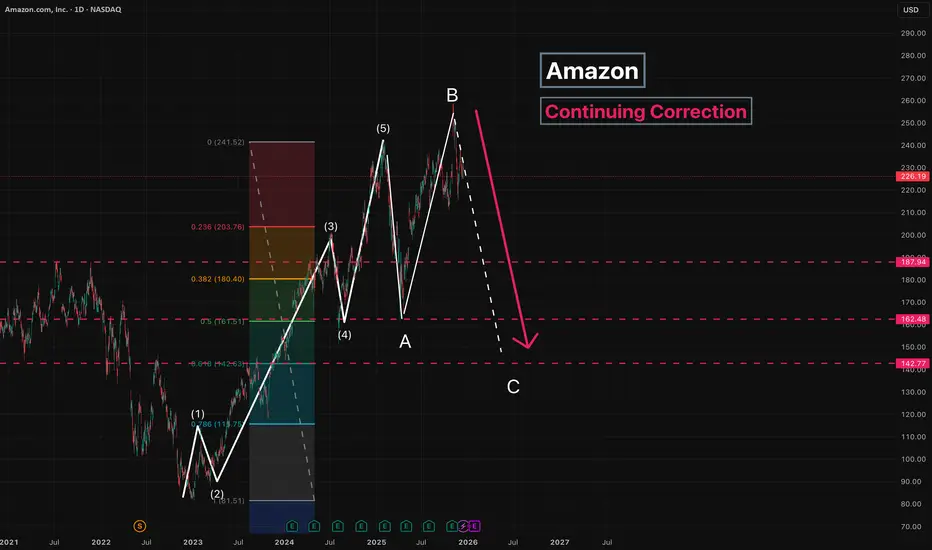
Amazon - Continuing CorrectionThe correction is ongoing, and wave C has started to form.
Since wave B is longer than wave A , wave C is expected to move below the low of wave A .
Main target: 142
Intermediate target: 187
---
Please subscribe and leave a comment.
You’ll get new information faster than anyone else.
---
Silver approaching a 0.618 fib line weekly chartDec 13 2025
I decided to have a look at Silver again using Fibs, so I made a retracement in the 2008 to 2011 price gain, and using prior analysis from Feb 25 2025 determined that the price and pattern on the Feb 25 analysis is around a 0.236 fib line, so if allis somewhat equal, and the fib is a little correct we may be approaching an area of consolidation in the Dec 13 2025 fib at line 0.618. Ultimately price would be what ever it is but may top out in $100 per ounce range, may be a good time to buy dips? or visit a silver etf?

Silver Short: Completed Wave 3, Wave 4 StartsFrom the Fibonacci extension confirmation and the completed wave counts, I believe we have seen Silver's top for the year. The expectation is for a sharp downturn (likely a Zig-Zag) as we use alternation (Wave 2 is complex and flattish). The target of of $45.53 may be conservative. But let's review when price nears there.
Stop above the high.
Good luck!

AUDCAD sellsActive and pending orders. Price approached Supply level after the sudden drop
Manage risk o

#ETH H4 HH (BOS) long update to 3900BINANCE:ETHUSDT.P
After a prolonged and structural decline according to wave theory, the price reversed on abc and updated its HH twice. The trend line that the price had been building through its short movement was broken on h4.
I expect a retest at 0.618 on the Fibonacci level, confirmed by strong HVN and the trend line as support in this case.
Based on the extended Fibonacci, I noted the first target of 3800-3900. If the price manages to hold at these levels, we can hope for a new long-term long scenario and an update of the record HH ETH.

ETH/USDT 1D CHart Long-Term.
🔍 Market Structure (Price Action)
1️⃣ Trend
Long-term: The uptrend has been broken (a downward breakout from the black trend line).
Medium-term: A sequence of lower highs and lower lows → a downtrend.
The current rebound is a correction in the downtrend, not a confirmed reversal.
📐 Key Levels (very well marked)
🔴 Support
2768 USDT – key support (current local bottom).
2157 USDT – final support from the previous structure (if 2768 breaks → a very real pullback).
🟢 Resistance
3506 USDT – current nearest resistance (retest after a downward breakout).
4101 USDT – strong supply zone + former support.
4477 USDT – main structural resistance (region of previous highs).
👉 Price is now exactly in the decision zone between 2768 and 3506.
📉 Trendline
Breaked and rejected (retest ended with a decline).
This is a classic signal of a downtrend continuation.
Until the price returns above 3506 and sustains, there is no uptrend.
📊 Stochastic RSI
The oscillator frequently reaches the 80–100 zone.
Currently: Moving out of overbought → signal of weakening upward momentum.
No bullish divergence → no confirmation of a trend change.
🧠 Scenarios
🐻 Baseline scenario (more likely)
Rejection of 3506
Return to around 3000 → 2768
Breakthrough of 2768 = open path to ~2150
🐂 Alternative (conditional) scenario
Daily close above 3506
Retest of 3506 as support
Only then is a move towards 4100 possible
🎯 Final conclusions
This is not a market for longs without confirmation.
The current rebound looks like a pullback in a downtrend.
Safeest:
Short at resistance (3506 / 4101)
Long only after a breakout and holding of 3506

GOLD - Distribution phase. Target - ATH (4380), 4400...FX:XAUUSD is rallying after breaking through consolidation resistance. The fundamental background is positive, with the train heading for an all-time high.
Expectations of a soft Fed policy remain, with the market pricing in two rate cuts in 2026. India's pension fund regulator has allowed investments in gold and silver ETFs. An increase in US unemployment claims (+44,000) has heightened fears of a slowdown in the labor market.
A reversal in the Bank of Japan's policy (rate hike) and a pause by the ECB are boosting the appeal of gold.
Any correction is likely to be short-term and will be met with support from buyers. The baseline scenario remains bullish amid soft monetary policy and a weakening dollar.
Technically, it is dangerous to sell in the current market; it is worth looking for buying opportunities after corrections or pullbacks...
Resistance levels: 4325, 4335, 4380
Support levels: 4300, 4285, 4265
The rally phase is quite aggressive due to the long period of consolidation that the market has been in. All possible factors are supporting growth. In such a market, one can only buy on pullbacks. I expect a pullback from the indicated zone, within which growth to ATH can be considered.
Sincerely, R. Linda!

BITCOIN → Downward trend pressure. 86K - 84K?BINANCE:BTCUSDT.P sold off all the gains associated with Tuesday and Wednesday's news. Technically, a false breakout of resistance is forming against the backdrop of a downtrend. There is no fundamental support.
Bitcoin failed to consolidate above 91800 - 94200, a false breakout was formed, and the price returned to the range. There is an imbalance zone on the chart, which the price may test before falling (weak technical and fundamental background).
The trend is downward in the medium term. A countertrend correction is forming, within which the market is facing pressure in the 94K - 95K zone. Zone of interest is 91850. I expect a retest, liquidity capture, and another phase of selling down to 88K - 86K.
Resistance levels: 91850, 92500
Support levels: 89550, 87980, 86260
The price is in the trading range of 84K - 94K. Resistance has been tested, and a double top reversal pattern has formed. Currently, a distribution phase is forming relative to the specified pattern and consolidation at 91850 - 94200. A retest of the nearest resistance could trigger a rebound and cause the price to fall further to the next zone of interest.
Best regards, R. Linda!

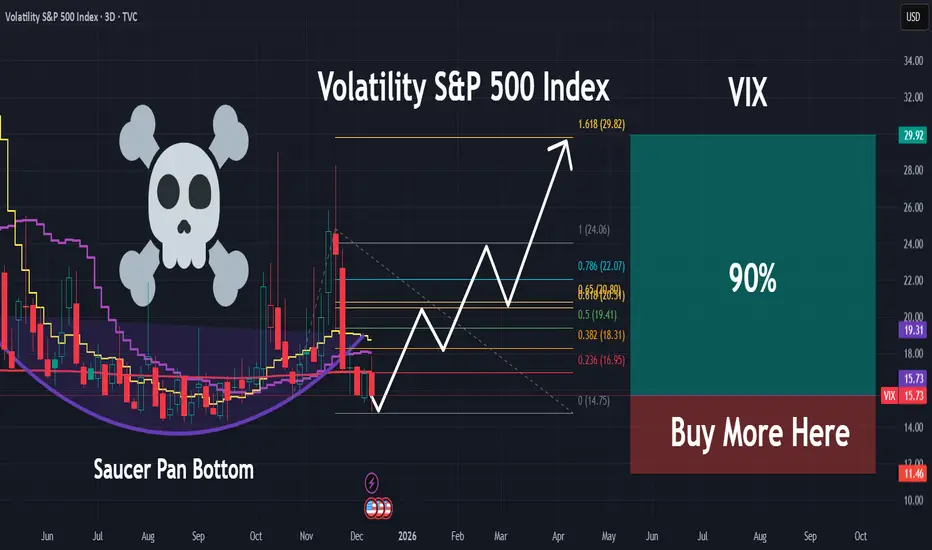
VIX | Major Volatility and Market Correction Incoming | LONGThe VIX Index, formally known as the Cboe Volatility Index, is a real-time market index that represents the market's expectation of 30-day forward-looking volatility for the S&P 500 index. It is widely known as the "fear gauge" because it tends to rise sharply during periods of increased investor fear and market uncertainty.
Ascending Channel | Golden Zone Retracement SetupAfter analyzing the chart on the 2-hour timeframe, price action has been moving within a well-defined ascending channel since Tuesday, 25 November 2025. The upper boundary of the channel has been consistently respected, confirming the strength and validity of this bullish structure.
Following a rejection from the upper boundary, price is currently trading around 1.17403. At this stage, the market appears to be developing a bearish corrective structure, resembling either an upper flag formation or a falling broadening wedge, which is still in progress and not yet completed.
Based on this structure and overall market behavior, we anticipate a potential retracement toward the Fibonacci Golden Zone, which aligns with our projected price target. This area may act as a key decision zone for the next directional move, especially if supported by price action confirmation and volume reaction.
Traders should monitor price behavior closely around the channel boundaries and Fibonacci levels for high-probability setups.
Happy Trading
SpicyPips

Breakout and Retest13-12-2025
1211 is retesting breakout zone near 57.7
aligned with Fib golden pocket
hidden bullish divergence can be seen
price is respecting EMA 89
good to enter with SL 57 or watch for descending channel breakout
it can hit 65, 67.5. Long term it can hit 75/79
# this is not a financial / investment advice. Only meant for tracking technical analysis

Hidden Bullish divergence on retracementRetraced to 78% fib levels
hidden bullish divergence can be seen
5 is good support so far
rebound from here can take it back to 6.1
with intermediate resistance levels at
5.47, 5.8

Potential Trend Reversal ongoing13-12-2025
expected Trend reversal ongoing
on higher TF
made a new high at 9.48
took support near 7 at 78% fib retracement level
HH/HL pattern on hourly TF
good volume on the rally while dried volume on the retracement
accumulate near 7 with tigh SL below 7
TP1: 7.6
TP2: 8.1
TP3: 8.6
crossing and sustaining above 9.5 will confirm trend reversal
#This is an analysis for learning purposes, not a financial / investment advice

EUR/USD Analysis – 4H OutlookEUR/USD remains in a strong bullish trend, with both technical structure and the broader fundamental backdrop continuing to support the upside. At the moment, however, price is in a corrective downswing within this larger uptrend, which opens the door to two main scenarios.
Scenario 1 – Direct move into liquidity and demand
From the current level, price may extend lower to sweep the downside liquidity resting beneath the recent lows and tap into the highlighted demand zone. This area aligns closely with the 61.8% Fibonacci retracement of the latest impulsive leg, making it a high‑probability support zone for a potential bullish continuation.
Scenario 2 – One more push up before the deeper correction
Alternatively, price could first push higher from the current area, break above the marked weak high, and create a new short‑term high. After that, a reversal from above could trigger a break of the intervening low (the low that breaks the high), followed by a continuation lower into the same liquidity pool and finally into the demand zone around the 61.8% retracement, before a strong upside leg resumes.
Execution plan and disclaimer
The plan is to look for long positions only from the marked demand zone, and only if clear bullish reversal signals appear (e.g., rejection wicks, structure shift, or strong bullish candles). This is a personal technical outlook for educational purposes only and does not constitute investment advice or a recommendation to buy or sell any financial instrument.
