Gold Short: Ended Corrective Move upOver in this analysis, I point out 2 ways that the Gold Elliott waves can be plotted and I went through the breakdowns as well as 2 interesting Fibonacci extensions that both points to where the recent high of Gold ended.
The idea is invalidated at the recent high so stop should be placed above that.
Good luck!
Fibonacci

$BTC Bearish Pennant Or Higher Low Breakout?₿itcoin continues to struggle to reclaim the 9DEMA.
Is this a bearish pennant that will trap bulls?
Or will these higher lows lead to a violent breakout to the upside?
If PA can start trading within the POI above the .618 Fib then there’s a chance for a nice relief rally going into Christmas. Gut says it might breakthrough on the 5th attempt.
Confirmation will be CRYPTOCAP:BTC closing above the 50MA and 50% Gann level.

XAU/USD Hits Record Close- High-Stakes Year-End Breakout LoomsThe gold advance extending into resistance on Friday at the record high-day close (HDC) and the 100% extension of the late-October advance at 4356. Despite the late-week surge, gold pulled back more than 1.2% off the highs and the immediate focus is on inflection off this threshold in the weeks ahead with the recent advance vulnerable while below. A decisive reaction here will be critical in determining whether the next leg of the rally can take hold into year-end or if a pullback is needed to reset momentum.
Initial weekly support now rests with the 38.2% retracement of the late-October advance at 4175 and is backed by the record high-week reversal close at 4112- losses below this threshold would threaten a more significant correction. Subsequent support rests at 4000 with broader bullish invalidation at the October low at 3886. Note that the lower parallel of the yearly pitchfork converges on this threshold over the next few weeks and break below would suggest a larger trend reversal is underway.
A topside breach / close above 4356 would be needed to mark resumption of the yearly uptrend with subsequent resistance objectives eyed 75% parallel (currently near ~4430s) and the 1.618% extension of the 2024 December rally at 4603. Note that the upper parallel converges on this threshold next week- look for a larger reaction there IF reached.
Bottom line: Gold stretched into resistance at the record high-day close today and the focus is on a reaction off this mark into the close of the year. From a trading standpoint, losses should be limited to 4112 IF price is heading higher on this stretch with a weekly close above 4356 needed to fuel the next leg of the gold rally.
-MB

GBP/USD Puts in Third Weekly Gain Ahead of BoE MeetingGBP/USD pulled back on Friday, falling about 0.11%, following a rally this week that pushed prices to an 8-week high. Today’s losses were modest compared to this week’s price action, with the pair set to put in a gain of about 0.33% on the week.
The pound is up nearly 3% since its swing low from early November, which marked the lowest level traded since early April. Now on track for a third weekly gain, GBP/USD has retraced about 50% of its move off the July swing high, which marked its strongest level since 2021.
Prices have stair-stepped higher since early November after a double bottom pattern formed. The 23.6% and 38.2% Fibonacci retracement levels have provided support from the double bottom pattern, with the price action around those levels being defined by bull flag patterns.
The pseudo 50% Fibonacci provided resistance this week to bulls, with Thursday’s intraday move failing to hold above the level. Coincidentally, this is also alongside 1.34, bringing into play some psychological resistance.
The 100-day exponential moving average (EMA) offered support on the latest period of consolidation that started last week, and now the 20-day EMA has nearly crossed above the 50-day EMA, suggesting that momentum is strengthening.
Overall, the trend is pointed higher for now, and some consolidation along the way makes sense. The Monetary Policy Committee of the Bank of England (BoE) meets next week, and they are expected to cut rates by a narrow margin. With inflation coming down recently and some softness in the labor market for October, we could see a dovish tilt, although the MPC will likely remain divided.

EURGBP Wave Analysis – 12 December 2025
- EURGBP reversed from support zone
- Likely to rise to resistance level 0.8850
EURGBP currency pair recently reversed up from the support zone between the strong support level 0.8745 (former resistance from April, July and October) and the lower daily Bollinger Band.
This support zone was strengthened by the support trendline of the daily up channel from July and by the 61.8% Fibonacci correction of the upward impulse from October.
Given the strong daily uptrend, EURGBP currency pair can be expected to rise to the next resistance level 0.8850 (which stopped earlier impulse wave 1).

Ethereum Wave Analysis – 12 December 2025- Ethereum reversed from resistance level 3400.00
- Likely to fall to support level 2907.00
Ethereum cryptocurrency recently reversed down with the daily Shooting Star from the resistance area between the key resistance level 3400.00 (former strong support from August and October) and the upper daily Bollinger Band.
This resistance area was further strengthened by the 50% Fibonacci correction of the downward impulse C from last October.
Ethereum cryptocurrency can be expected to fall further to the next support level 2907.00 (low of the earlier correction ii).

HYPE price analysis#HYPE Third attempt to form a bottom — will it hold above $36?
The price of OKX:HYPEUSDT is again testing the same demand zone where two previous rebounds were formed.
At the moment, the key factor remains unchanged:
Key Levels
$36 — critical level that must be reclaimed and held
$49–50 — realistic short-term target if momentum flips
Breakdown below current support would open room for a deeper retrace
A successful breakout above $36 would confirm buyer strength and could trigger a short-term rally into the New Year period.
Question: Do you expect #HYPE to reclaim $36 and move toward $50, or is another sweep of the lows more likely?
______________
◆ Follow us ❤️ for daily crypto insights & updates!
🚀 Don’t miss out on important market moves
🧠 DYOR | This is not financial advice, just thinking out loud

Long XAUUSD"After a pullback and a corrective move into the predefined zones (fibo as Order Blocks, FVGs, or key support levels), the price may regain bullish momentum and continue its upward trend."

Eli Lilly May Be OversoldEli Lilly surged last month, and now it’s pulled back.
The first pattern on today’s chart is the 50 percent retracement of the advance. That may suggest its direction is pointing higher. Prices have also stabilized at the psychologically important $1,000 level.
Second, the 50-day simple moving average (SMA) had a “golden cross” above the 200-day SMA in early November. That could reflect a bullish long-term uptrend.
Third, the 8-day exponential moving average (EMA) has remained above the 21-day EMA. That may reflect a bullish short-term uptrend.
Finally, stochastics have dipped to an oversold condition.
TradeStation has, for decades, advanced the trading industry, providing access to stocks, options and futures. If you're born to trade, we could be for you. See our Overview for more.
Past performance, whether actual or indicated by historical tests of strategies, is no guarantee of future performance or success. There is a possibility that you may sustain a loss equal to or greater than your entire investment regardless of which asset class you trade (equities, options or futures); therefore, you should not invest or risk money that you cannot afford to lose. Online trading is not suitable for all investors. View the document titled Characteristics and Risks of Standardized Options at www.TradeStation.com . Before trading any asset class, customers must read the relevant risk disclosure statements on www.TradeStation.com . System access and trade placement and execution may be delayed or fail due to market volatility and volume, quote delays, system and software errors, Internet traffic, outages and other factors.
Securities and futures trading is offered to self-directed customers by TradeStation Securities, Inc., a broker-dealer registered with the Securities and Exchange Commission and a futures commission merchant licensed with the Commodity Futures Trading Commission). TradeStation Securities is a member of the Financial Industry Regulatory Authority, the National Futures Association, and a number of exchanges.
TradeStation Securities, Inc. and TradeStation Technologies, Inc. are each wholly owned subsidiaries of TradeStation Group, Inc., both operating, and providing products and services, under the TradeStation brand and trademark. When applying for, or purchasing, accounts, subscriptions, products and services, it is important that you know which company you will be dealing with. Visit www.TradeStation.com for further important information explaining what this means.

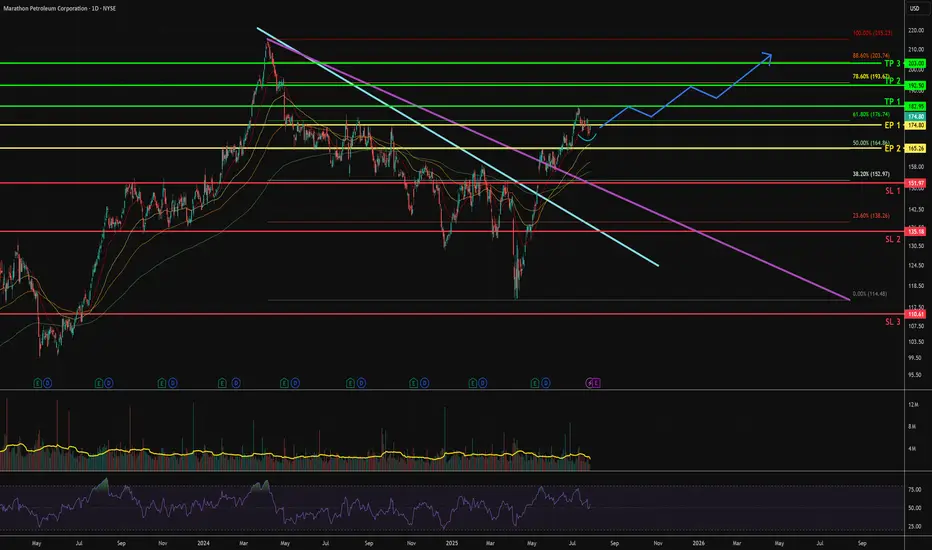
MPC - Upside swing [ 1 to 3 months ]1. Downtrend line of 11 months is broken
- Price gapped up, and sustained above Fib 38.2% and 50%.
- This concludes the end of bear trap and the switch from bear to bull trend.
2. In the last month, weak selling pressure is noticed.
- Rounding bottom above previous 1D resistance at $171.50
- Closes are creeping near to Fib 61.8%
- Flipping to bullish stance
3. Entry points
EP 1 - buy spot with 1 or 0.5 size
EP 2 - Enter another 1 or 0.5 size if closing prices stay above Fib 50% at $164.8
#XAUUSD(GOLD):+1300 Pips Move Before Our Swing Sell Entry ActiveGold is likely to continue bullish move where we expect price to hit around 4380 area or 4400. This our intraday approach and before our sell entry get activated which will be our swing entry. There is only one target for this setup which is 4390$. You can adjust stop loss and take profit based on your own view.
If you like our work then do consider liking and commenting the idea.
Team Setupsfx_

SNDK: at macro resistance Price broke out through the resistance zone highlighted in the September update and continued to show strong upside momentum. However, the trend structure now appears substantially extended at current levels.
As long as the price remains below the 207–225 resistance zone, I expect selling pressure to start building, potentially leading to a pullback toward the 130–100 support area.
Chart:
Previously:
On resistance level (Sep 26):
Chart:
www.tradingview.com

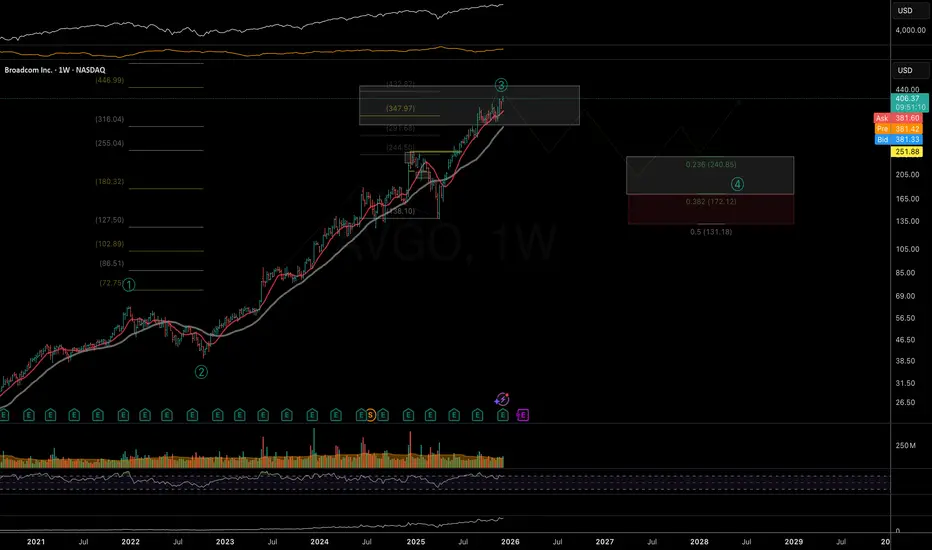
AVGO: at the macro resistance zone Although the initial immediately bullish January setup failed to follow through (see idea from Jan'25) — with price breaking local support and sliding deeper into a complex corrective structure — the broader macro trend structure may have effectively fulfilled itself after reaching major macro resistance levels built since the May bull run.
Chart (Weekly):
There is still not enough confirmation that a macro top is in. The first signs would be price starting to close below the 21DEMA and 50DMA, forming a sequence of lower highs along with bearish EMA convergence (similar to the February ’25 structure).
For now the key question is whether the negative post-market reaction to strong earnings and positive guidance will sustain. If selling pressure persists and price begins to decisively close below the 21EMA, that would increase the odds of a developing reversal. Otherwise, continued dip-buying may push price toward the upper boundary of the macro resistance box near 445.
Previously:
On a bullish macro structure (Jan'25):
On macro resistance zone (Sep 5 and 24):
www.tradingview.com
and
www.tradingview.com
AVGO: mid-term trend structure If price is to hold above 209-198 area of support, next resistance zones are: 287-303 and 320-330-360.
Macro trend structure also assumes higher targets for the uptrend since 2022 bottom (Monthly):
Thank you for your attention!

Bullish BOS Breakout, Watching Reaction at OB & Sell-Side Liquid◆ Market Context (H2)
Price has just broken a bullish BOS and closed above the previous equilibrium zone, confirming buyers are in control. After the strong impulse, the market has entered a rebalancing phase, where a short-term pullback often appears before continuation or a liquidity sweep to the upside.
◆ SMC & Price Action
• Bullish structure confirmed by consecutive BOS following the prior CHoCH.
• The 4,274 OB is the nearest demand zone where buyers previously reacted.
• Above lies sell-side liquidity at 4,355, with a further extension toward 4,408 — a potential distribution or short-term reversal zone.
• Price is currently in premium, so patience is preferred over FOMO entries.
◆ Key Levels
• Resistance / Liquidity: 4,355 → 4,408
• Support OB: 4,274
• Deeper OB: 4,217
◆ Trading Scenarios
➤ Scenario A – Pullback BUY (Primary)
• Wait for a pullback into OB 4,274
• Conditions: structure holds (no break of recent lows), bullish reaction appears
• Targets:
▪ 4,319
▪ 4,355 (Liquidity Sell)
▪ Extension: 4,408
➤ Scenario B – Break & Continue
• If price holds above 4,319 with bullish closes
• Monitor reactions at 4,355 for partial profit-taking
• Avoid chasing price in premium zones
➤ Scenario C – Deeper Pullback
• If OB 4,274 is clearly broken
• Price may retrace to OB 4,217 for re-accumulation
• Only consider BUY after a fresh bullish CHoCH
◆ Summary
• Primary trend: Bullish (BOS confirmed)
• Priority: Buy pullbacks, avoid FOMO
• Key decision zone: OB 4,274
• Upside liquidity targets: 4,355 → 4,408

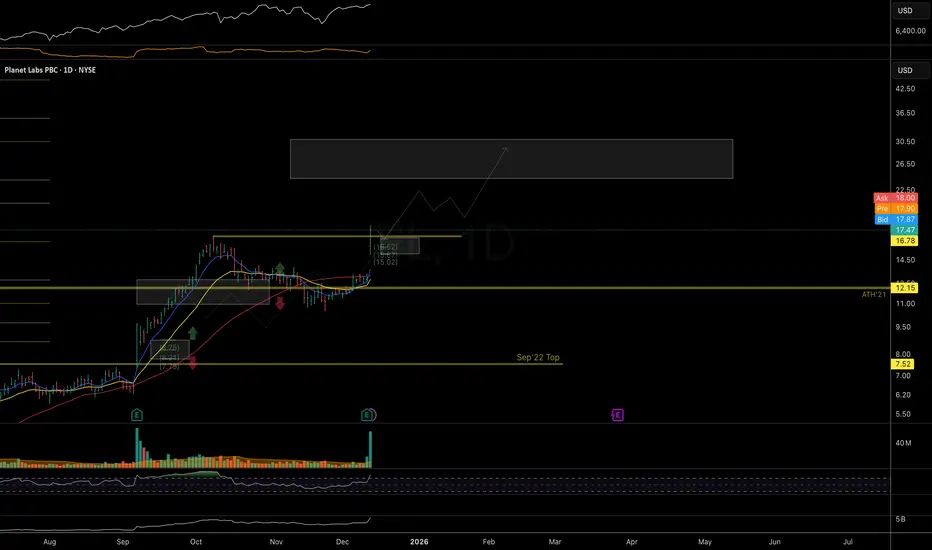
PL: room to follow-through Price continues to follow the macro bullish trend structure outlined in the September updates. Watching for further follow-through into the next 24–30 resistance zone.
The earnings gap may offer a delayed-reaction setup if we see a constructive, low-volume pullback in the coming days - ideally with price holding above the 15 local support.
Chart:
Macro view (Weekly):
Previously:
• On macro bullish-trend structure (Sep 14):
www.tradingview.com
• On resistance zone and pullback (Sep 26):
www.tradingview.com
Waiting for Premium Pullback Buy the Bullish Continuation1. Market Context & Structure (H1)
• After a prolonged consolidation phase, Gold has delivered a clear bullish BOS, breaking above the previous highs around 4,24x–4,25x.
• The current impulse originated from the EQL → OB 4,209 zone, confirming active buying flow and a shift into a short-term uptrend.
• Price is now trading above the Premium Zone at 4,265; any pullback into this area is considered a technical retracement within the bullish trend.
2. Key Technical Zones
• Main OB – Demand: around 4,209 → Origin of the current bullish leg; a strong BUY zone if price holds.
• Premium Pullback Buy Zone: 4,265 – 4,270 → First discount after BOS; priority area to look for BUY setups.
• Target 1 – Reaction Zone: 4,322 – 4,323 → Fibo 0.5–0.618 confluence; potential profit-taking / short-term sell reaction.
• Target 2 – Extension Zone: 4,366 – 4,367 (Fibo 1.272) → Bullish extension target and potential liquidity sweep zone.
3. Trading Scenarios
Main Scenario – Trend BUY at Premium Zone
• Wait for pullback to 4,265 – 4,270.
• Look for confirmation: long lower wicks, bullish engulfing, or bullish ChoCH on M15–H1.
• Execute BUY with trend continuation.
TP1: 4,322
TP2: 4,366
• Partial TP at TP1, move SL to BE, hold remainder to TP2.
• Invalidation: H1 close below 4,258 → pause BUY scenario.
Scenario 2 – Deep BUY at OB 4,209
• If price breaks Premium decisively and drops to OB 4,209, do not catch a falling knife.
• Wait for strong bullish reaction and reversal structure (new HL, bullish ChoCH).
TP: 4,265 → 4,322
4. Risk Management Notes
• Avoid FOMO BUY at highs after strong bullish candles.
• SELL setups are only short-term reactions, not the main bias.
• Bias remains BUY on dips as long as H1 holds above 4,209.

GOLD → Positive fundamental background. Focus on 4200 FX:XAUUSD is testing the $4,250 level amid news momentum related to interest rate cuts. The fundamental backdrop is improving, with the dollar entering a downward trend...
The Fed cut rates by 25 basis points to 3.75%, as expected. Powell's tone was cautious rather than hawkish, which weakened the dollar and Treasury yields. The market expects two rate cuts next year, compared to one in the Fed's forecasts
- Focus has shifted to US employment data (jobless claims). The next key risk will be next week's NFP data.
The Fed's decision provided support for gold, but for growth above $4250, confirmation of a weakening labor market in upcoming reports will be needed. Technically, the focus is on the 4200-4220 zone.
Resistance levels: 4220, 4250, 4260
Support levels: 4200, 4180, 4175
Consolidation above 4200 will confirm the bullish sentiment, while a breakout and consolidation above 4220 will open up a new chance for growth towards the resistance of the range.
I do not rule out the possibility of a retest the support of the range at 4181 before moving up (the price is still in a sideways trend).
Best regards, R. Linda!

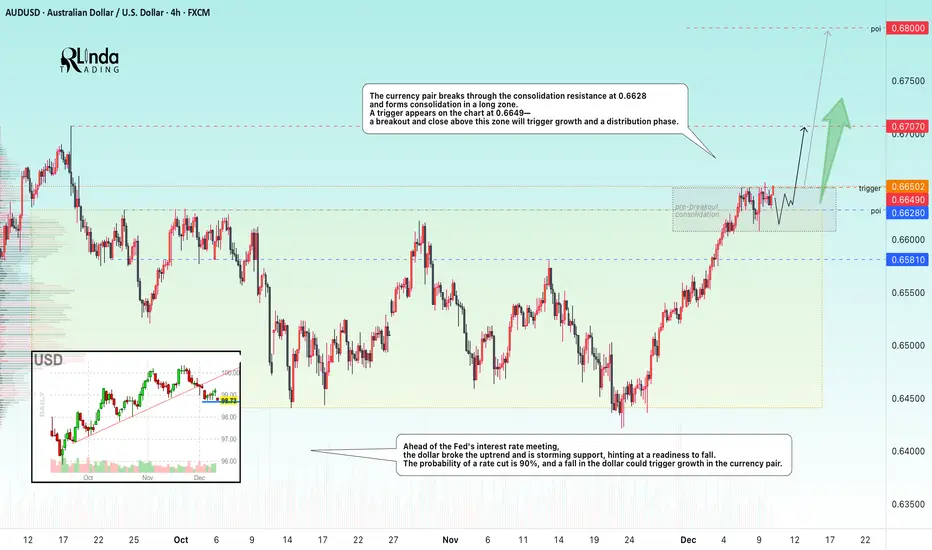
AUDUSD → Readiness for distribution within the uptrend FX:AUDUSD breaks through the resistance of a wide trading range (consolidation) and is preparing for growth. Important news ahead...
Ahead of the Fed's interest rate meeting, the dollar broke its upward trend and is storming support, hinting at a readiness to fall. The probability of a rate cut is 90%, and a fall in the dollar could trigger growth in the currency pair.
The currency pair is breaking through the consolidation resistance at 0.6628 and forming consolidation in a long zone. A trigger of 0.6649 appears on the chart - a breakout and close above this zone will trigger growth and a distribution phase.
Resistance levels: 0.6649, 0.67, 0.68
Support levels: 0.6628, 0.6581
Before rising, the price may test support (the previously broken trading range boundary). However, a breakout and close above 0.6649 could trigger a distribution phase towards 0.67-0.68, especially against the backdrop of a weak dollar...
Best regards, R. Linda!
Bitcoin to $100kBitcoin is trading exactly at the resistance line and is very likely to break above it towards 100k. Then after a pullback, we can expect a rally to the 110k area in the coming weeks and months.

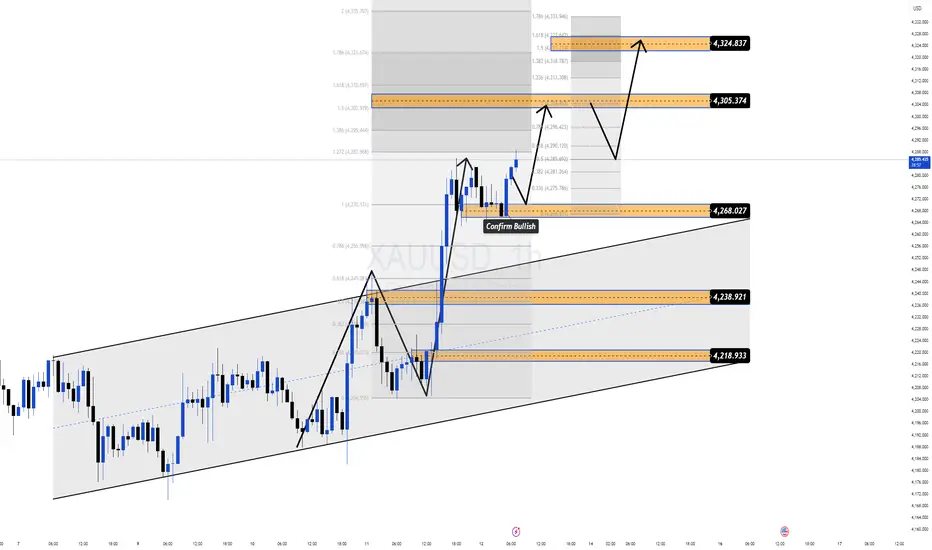
Bullish Confirmation - Buy the PullbackGold has delivered a clear bullish structure break and is currently holding firmly inside an ascending trend channel. The recent impulsive move confirms strong participation from smart money, while the current price action reflects a healthy pullback–continuation phase, not a reversal.
From a fundamental perspective, dovish Fed expectations and a lower-rate outlook continue to support Gold. This keeps downside moves corrective in nature and favors trend-following BUY setups.
📊 Market Structure & MMF Flow (H1)
• Bullish structure is confirmed with Higher Highs and Higher Lows.
• Price is retracing toward demand zones to rebalance liquidity before the next expansion.
• No bearish structure break has appeared so far.
💎 Key Levels – MMF Style
• Primary Buy Zone: 4,268
• Deep Buy Zone: 4,238 – 4,219
• Upside Targets: TP1 4,305 → TP2 4,324
🎯 Trading Scenarios
Primary Scenario – Trend BUY
Alternative Scenario – Continuation above 4,305
🧭 MMF Intraday Bias
Bullish above 4,238
Invalidation below 4,219
GBPCAD LONG IDEAGBPCAD has been ranging since it tapped into the D1 DEMAND zone. I will be expecting a bullish reaction from that H1 demand zone

NQ Power Range Report with FIB Ext - 12/12/2025 SessionCME_MINI:NQZ2025
- PR High: 25733.25
- PR Low: 25648.75
- NZ Spread: 189.5
No key scheduled economic events
Session gap -0.42%, open above 25833
Session Open Stats (As of 12:45 AM)
- Session Open ATR: 404.03
- Volume: 27K
- Open Int: 295K
- Trend Grade: Long
- From BA ATH: -2.6% (Rounded)
Key Levels (Rounded - Think of these as ranges)
- Long: 26521
- Mid: 25264
- Short: 24008
Keep in mind this is not speculation or a prediction. Only a report of the Power Range with Fib extensions for target hunting. Do your DD! You determine your risk tolerance. You are fully capable of making your own decisions.
BA: Back Adjusted
BuZ/BeZ: Bull Zone / Bear Zone
NZ: Neutral Zone
