LTC/USDT 1D🕵️♂️ The overall picture
• Price: 102.50 USDT
• Trend: The current downtrend is down (black downtrend line), but we are currently breaking above the trendline, which may signal a change in direction.
• Interval: Daily (1D)
⸻
📊 Key technical levels
• Resistance 1: 106.99 USDT
• Resistance 2: 119.25 USDT
• Support 1: 95.61 USDT
• Support 2: 89.65 USDT
• Support 3: 79.90 USDT
The current candle has broken above the downtrend line and the level of 95.6 USDT, which is a bullish signal.
⸻
🔥 Volume
• You can see a big increase in volume during today's bullish candle - this confirms that the buyers are in control.
• This is a classic example of a confirmed breakout from a downtrend.
⸻
📈 Candles
• Today's candle is a strong demand candle (green) with a large body.
• If today's close stays above the trend line (~100 USDT), it will be a technical confirmation of the breakout.
⸻
⚙️ Stochastic RSI indicator
• The blue line (RSI) is rebounding from the oversold area (<20) and heading upwards - this is a buy signal.
• The orange line begins to turn in the same direction, which may indicate the beginning of an upward impulse.
⸻
💡 Scenarios:
🟢 Growth scenario (more likely):
• Maintaining the price above 100 USDT = breakout confirmed.
• Potential targets:
• 106.99 USDT – first test of resistance, possible short pullback.
• 119.25 USDT – main target in the medium term (approx. +16%).
🔴 Downside scenario (if the breakout turns out to be false):
• Return below 95.6 USDT and closing of the daily candle there = false breakout signal.
• Then a possible decline to 89.65 USDT, and with further weakness even 79.90 USDT.
Fibonacci

ZEC proves that old-school crypto still got the fire!The price of CRYPTOCAP:ZEC finally broke out from a long consolidation (unlike poor #DASH 😅).
💰 Market cap already exceeded $6B, even slightly surpassing CRYPTOCAP:XMR (Monero).
🪙 True old-school vibes:
Total supply is limited to 21M coins — just like CRYPTOCAP:BTC . No trillions, no inflationary nonsense 😎
📊 On the #ZECUSDT chart, we see an almost correction-free rally — brief pauses between levels and then another leg up.
In fact, CRYPTOCAP:ZEC just broke above its 2021 high, and we don’t really see any major profit-taking yet.
🧩 P.S. The technical levels work beautifully — use them wisely 😉
⚖️ But the real question is:
is this genuine demand for anonymity, or is someone carefully pumping CRYPTOCAP:ZEC after years of mining accumulation?
______________
◆ Follow us ❤️ for daily crypto insights & updates!
🚀 Don’t miss out on important market moves
🧠 DYOR | This is not financial advice, just thinking out loud.

CSIQ | Great Entry Point | LONG SolarCanadian Solar, Inc. engages in the manufacture of solar photovoltaic modules, provision of solar energy and battery storage solutions, and development of utility-scale solar and battery storage products. It operates through the CSI Solar and Global Energy segments. The CSI Solar segment designs, develops, and manufactures solar ingots, wafers, cells, modules, and other solar power and battery storage products. The Global Energy segment includes solar and battery storage project development and sale, asset management services for operational projects, sale of electricity, and investment in retained assets. The company was founded by Shawn Qu in October 2001 and is headquartered in Guelph, Canada.

GBPJPY Wave Analysis – 7 November 2025
- GBPJPY reversed from support area
- Likely to rise to resistance level 202.85
GBPJPY currency pair recently reversed from the support area between the support level 200.00 (former resistance from July to September), lower daily Bollinger Band and the support trendline of the daily down channel from the start of October.
The upward reversal from this support area stopped the previous short-term ABC correction 2 from the start of October.
Given the clear daily uptrend and the strongly bearish yen sentiment seen across the FX markets today, GBPJPY currency pair can be expected to rise to the next resistance level 202.85.

UVXY | Volatility Will Pop VERY Soon | LONGProShares Ultra VIX Short-Term Futures ETF seeks daily investment results, before fees and expenses, that correspond to one and one-half times (1.5x) the performance of the S&P 500 VIX Short-Term Futures Index for a single day. The index seeks to offer exposure to market volatility through publicly traded futures markets and is designed to measure the implied volatility of the S&P 500 over 30 days in the future.

BBW watch $48.93: Golden Genesis asks "can Bulls luv Bears?"BBW blow off top back to earth.
Launchpad Golden Genesis at $48.93
Fib to answer: Can bulls luv bears again?
.
See "Related Publications" for other examples of Golden fibs at work ------->>>>>>>>>>>

GOLD → The battle for the $4,000 zone. Are the bulls here?FX:XAUUSD is gradually recovering. The price is breaking through $4,000 and trying to stay above the key psychological level. Focus on 4,030–4,050...
Weak employment data, namely a sharp increase in layoffs in October, has heightened fears of an economic slowdown, a decline in government bond yields, and the ongoing correction of AI assets is fueling demand for safe havens.
The probability of a Fed rate cut in December has risen to 69%. The situation is stabilizing somewhat, there is no strong news today, and the market may try to maintain the current backdrop...
Gold retains its upside potential while macro risks remain. The $4000 level is currently acting as key support. Closing the week above this mark will open the way to test $4050.
Resistance levels: 4030 - 4050
Support levels: 4000, 3975, 3956
The dollar and gold are rising, and the inverse correlation is decreasing, indicating that bulls are still trying to keep the market from falling sharply. However, given the lack of drivers, strong news, and a clear fundamental backdrop, I would say that gold is not yet ready to break out of its current range. Consolidation above 4K could lead to a retest of 4030-4050, which in turn could trigger a pullback to local support.
Best regards, R. Linda!

SOFI: price reached key resistance zone Price has moved in line with the macro trend structure outlined since the July update and has now reached key resistance levels before reversing.
At this stage, I’m tracking two potential trend alternatives:
• Main scenario: price is in the process of forming a deeper pullback targeting the January’25 / July’25 highs. This view will gain even more weight if price breaks and starts closing below the 24 support zone.
• Alternative (more immediately bullish) scenario: potential for upside reversal and continuation of momentum, provided we see supportive action holding around the 24 level.
Chart:
Previously:
• On bullish trend structure (Jul 29):
www.tradingview.com
• On support zone (Aug 5):
www.tradingview.com

NFLX watch $1061-81: Crucial support zone that bulls MUST Hold NFLX has been struggling for months to make new highs.
Now testing a CRUCIAL support zone $1061.79-1081.84
Look for a clean Bounce or a reclaim if it falls through.

MCHP watch $52.86-53.55: Dual Fib support zone may hold the DUMPMCHP apparently had a disappointing earnings report.
It dumped into a significant support at $52.86-53.55
Look for consolidation above the zone then recovery.
.
Previous Analysis that caught a PERFECT entry AND exit:
Hit BOOST and FOLLOW for more such PRECISE and TIMELY charts.
=========================================================
.

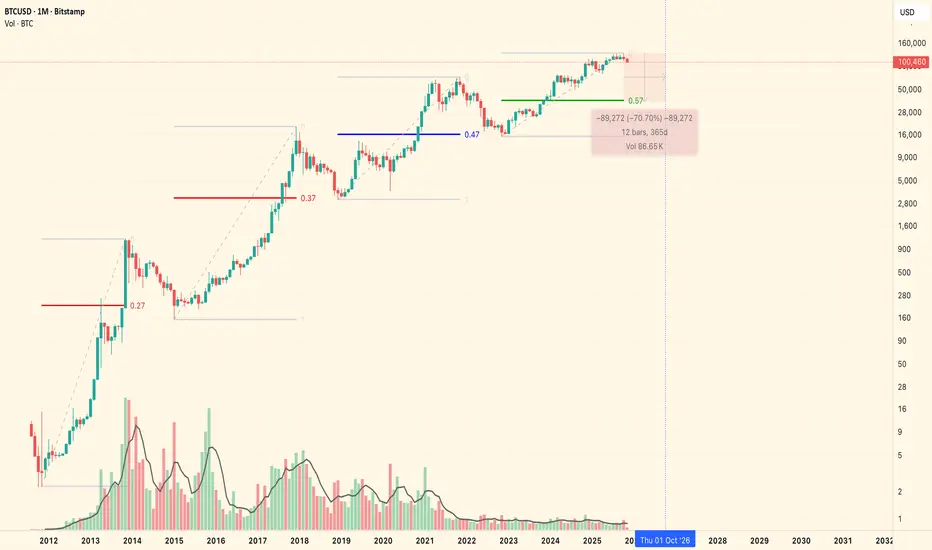
true bitcoin bottom - fib and time cyclesthough experience and study of the various factors of history and human behavior.
and importantly how these interface with the bitcoin price.
unless there is significant market intervention from the US Government, or from whales & Billionaires. it is my estimation the true bitcoin bottom will be where I have shown it to be.
will nonetheless be trading scalps, punts on new technologies, & innovations, and farming along the way. and I pray if you see this, you know there is light at the end of the tunnel. and there will be 'up-only' again.
and naturally, as a permabull, I hope I am wrong.
good luck and may the odds be ever in our favor
Bitcoin At Make-or-Break Zone – Long Setup Ahead?Bitcoin ( BINANCE:BTCUSDT ) is currently moving near a Heavy Support zone($111,980-$105,820) , Support lines , Potential Reversal Zone(PRZ) , and Cumulative Long Liquidation Leverage($106,432-$104,513) .
From an Elliott Wave perspective , it seems that Bitcoin might be completing the microwave 5 of the main wave C .
As long as Bitcoin does not break below that Heavy Support zone($111,980-$105,820) , we can still be hopeful about long positions . There's a chance of a fake break of the support lines, and then Bitcoin might bounce back from the PRZ and start rising again.
I expect that after touching the PRZ , Bitcoin could rise back up and move toward the Resistance zone($110,700-$109,380) .
Note: If the support lines break with high momentum, please do not enter a long position.
Cumulative Short Liquidation Leverage: $113,085-$111,444
Stop Loss: $104,420
Please respect each other's ideas and express them politely if you agree or disagree.
Bitcoin Analysis (BTCUSDT), 1-hour time frame.
Be sure to follow the updated ideas.
Do not forget to put a Stop loss for your positions (For every position you want to open).
Please follow your strategy and updates; this is just my Idea, and I will gladly see your ideas in this post.
Please do not forget the ✅' like '✅ button 🙏😊 & Share it with your friends; thanks, and Trade safe.

Bitcoin BTC – Short Term Update📊 CRYPTO:BTCUSD initial reaction failed, and price action suggests one more leg lower to complete a 5th wave from the 10/27 peak. This would wrap up the current impulsive decline and set the stage for a larger corrective bounce.
⚠️ Important Note:
Treat any upcoming bounce as corrective, not impulsive. The structure does not yet support a new ATH scenario unless the market proves otherwise with a decisive bullish shift.

GIFTNIFTY IntraSwing Levels for 07th Nov '25Useful to Tally / Recognize for Next day Trade Plan.
✍🏼️ "Future IntraSwing Levels" mentioned in BOX format.
✍🏼️ "WEEKLY Levels" follow Sunday / Saturday's Post.
✍🏼️ "WEEKLY Levels" mentioned in BOX format.
L#1: If the candle crossed & stays above the “Buy Gen”, it is treated / considered as Bullish bias.
L#2: Possibility / Probability of REVERSAL near RLB#1 & UBTgt
L#3: If the candle stays above “Sell Gen” but below “Buy Gen”, it is treated / considered as Sidewise. Aggressive Traders can take Long position near “Sell Gen” either retesting or crossed from Below & vice-versa i.e. can take Short position near “Buy Gen” either retesting or crossed downward from Above.
L#4: If the candle crossed & stays below the “Sell Gen”, it is treated / considered a Bearish bias.
L#5: Possibility / Probability of REVERSAL near RLS#1 & USTgt
HZB (Buy side) & HZS (Sell side) => Hurdle Zone,
*** Specialty of “HZB#1, HZB#2 HZS#1 & HZS#2” is Sidewise (behaviour in Nature)
Rest Plotted and Mentioned on Chart
Color code Used:
Green =. Positive bias.
Red =. Negative bias.
RED in Between Green means Trend Finder / Momentum Change
/ CYCLE Change and Vice Versa.
Notice One thing: HOW LEVELS are Working.
Use any Momentum Indicator / Oscillator or as you "USED to" to Take entry.
⚠️ DISCLAIMER:
The information, views, and ideas shared here are purely for educational and informational purposes only. They are not intended as investment advice or a recommendation to buy, sell, or hold any financial instruments. I am not a SEBI-registered financial adviser.
Trading and investing in the stock market involves risk, and you should do your own research and analysis. You are solely responsible for any decisions made based on this research.
"As HARD EARNED MONEY IS YOUR's, So DECISION SHOULD HAVE TO BE YOUR's".
Do comment if Helpful .
In depth Analysis will be added later (If time Permits)

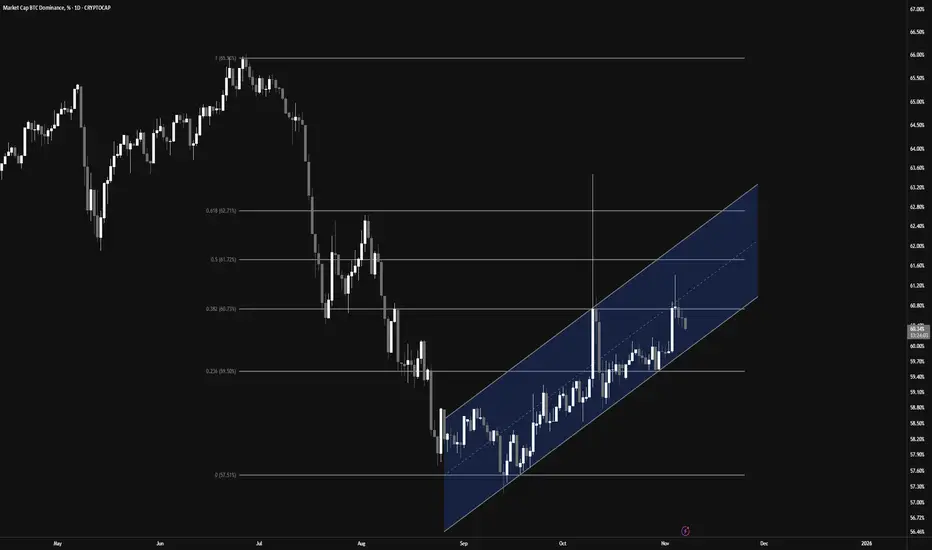
Bitcoin Dominance Rejection and Altcoin Pump👋🏻 Hey everyone! Hope you’re doing great! Welcome to SatoshiFrame channel.
✨ Today we’re diving into the 1-Day Bitcoin Dominance analysis. Stay tuned and follow along!
👀 On the daily timeframe, Bitcoin dominance has reached a key resistance zone at 60.73%. If this level breaks, we could see a deeper correction across altcoins. However, a rejection and move downward could trigger a strong rally for altcoins. As Bitcoin’s market weight decreases and capital flows into altcoins, we might be entering an early altseason, presenting potential profit opportunities.
🕯 From a technical perspective, Bitcoin dominance is moving within a well-structured ascending channel. The midline of the channel acts as a solid rejection point. A Fibonacci retracement from the previous downtrend shows a 38% overlap with this midline — a tough level to break. After a strong bearish candle rejection from that area, dominance is now heading lower. If the move continues, we could see a test of the channel’s lower boundary, and a confirmed breakdown would strengthen the altcoin bullish scenario.
💰 Typically, capital rotation in crypto follows this pattern: money flows into Bitcoin, then Ethereum, then the top 10 coins, and finally into smaller altcoins — before converting to USDT and exiting the market. With Bitcoin dominance currently at high levels after a solid Bitcoin season, this could signal the early stages of capital shifting toward altcoins. Traders should watch closely for these shifts to maximize profitability.
❤️ Disclaimer : This analysis is purely based on my personal opinion and I only trade if the stated triggers are activated .
BTCUSD Short: Bearish Rejection Targeting $100.6K Support ZoneHello traders! Bitcoin (BTCUSD) continues to trade within a well-defined descending channel, reflecting sustained bearish pressure after the rejection from the $116,000 Supply Zone. The market previously experienced a Fibonacci Arc retracement followed by a strong sell-off, signaling exhaustion from buyers and the formation of a broader corrective structure.
Currently, we have seen multiple fake breakouts on both the upper and lower boundaries of the channel, suggesting that liquidity sweeps are actively influencing volatility. Notably, price recently tapped the major Demand Zone around $100,600, a level that has historically triggered strong reactions. The sharp wick and immediate recovery from this support indicate buyer accumulation and defense of the zone. A short-term pivot point has now formed near $103,500–$104,000, marking a key decision area. If buyers hold above the $100,600–$101,000 support, a corrective move toward the upper channel boundary becomes increasingly likely.
I expect Bitcoin to retest the $103,500–$105,000 Pivot Resistance Zone, which aligns with the mid-channel level and previous breakout point. If price shows rejection in this region — such as bearish candlestick patterns or weakening momentum — it would provide a favorable entry point for short positions. A break and hold below $100,600 would strengthen bearish momentum and may trigger a continuation toward $98,000. However, if the price breaks and closes above $105,200, the short setup becomes invalid, as this would signal a potential shift in structure and a move toward $110,000. Manage your risk!

EURUSD Long: Rebound Setup Targeting 1.1560 Pivot ResistanceHello traders! EURUSD continues to trade within a clearly defined descending channel, maintaining a consistent bearish structure characterized by lower highs and lower lows. The recent rejection from the 1.1660 Supply Zone once again confirmed strong seller presence at that level. Additionally, the fake breakout above the channel resistance further highlighted the inability of buyers to shift the market structure.
Currently, price continued moving lower and is now testing the 1.1475–1.1500 Demand Zone, which aligns with the lower boundary of the descending channel. This area has previously acted as a reaction zone, meaning buyers have shown interest here before. The recent candle structure suggests that bears are slowing down near the demand area, indicating potential for a corrective pullback rather than immediate continuation downward.
In my opinion, If buyers manage to defend the 1.1475 Demand Zone, we could see a short-term bullish rebound toward the 1.1560 Pivot Resistance. This creates a favorable area for short-term long positions aiming for corrective upside movement. However, if sellers break below 1.1475 and price closes beneath the demand line, this would signal continuation of the primary bearish trend, opening the path toward lower levels around 1.1420–1.1380. For now, as long as price holds above the demand zone, a corrective rebound remains the more probable scenario. Manage your risk!

NIFTY IntraSwing Future & Weekly Levels for10th - 14th Nov '25✍🏼️ "Future IntraSwing Levels" mentioned in BOX format.
✍🏼️ "WEEKLY Levels" mentioned in BOX format.
L#1: If the candle crossed & stays above the “Buy Gen”, it is treated / considered as Bullish bias.
L#2: Possibility / Probability of REVERSAL near RLB#1 & UBTgt
L#3: If the candle stays above “Sell Gen” but below “Buy Gen”, it is treated / considered as Sidewise. Aggressive Traders can take Long position near “Sell Gen” either retesting or crossed from Below & vice-versa i.e. can take Short position near “Buy Gen” either retesting or crossed downward from Above.
L#4: If the candle crossed & stays below the “Sell Gen”, it is treated / considered a Bearish bias.
L#5: Possibility / Probability of REVERSAL near RLS#1 & USTgt
HZB (Buy side) & HZS (Sell side) => Hurdle Zone,
*** Specialty of “HZB#1, HZB#2 HZS#1 & HZS#2” is Sidewise (behaviour in Nature)
Rest Plotted and Mentioned on Chart
Color code Used:
Green =. Positive bias.
Red =. Negative bias.
RED in Between Green means Trend Finder / Momentum Change
/ CYCLE Change and Vice Versa.
Notice One thing: HOW LEVELS are Working.
Use any Momentum Indicator / Oscillator or as you "USED to" to Take entry.
⚠️ DISCLAIMER:
The information, views, and ideas shared here are purely for educational and informational purposes only. They are not intended as investment advice or a recommendation to buy, sell, or hold any financial instruments. I am not a SEBI-registered financial adviser.
Trading and investing in the stock market involves risk, and you should do your own research and analysis. You are solely responsible for any decisions made based on this research.
"As HARD EARNED MONEY IS YOUR's, So DECISION SHOULD HAVE TO BE YOUR's".
Do comment if Helpful .
In depth Analysis will be added later (If time Permits)

Probable Price Action BTC Daily chart - Elliott wave analysisThis screenshot provides my Elliott Wave technical analysis setup for Bitcoin (BTC), focusing on market structure and probable key support zone in the short to mid term.
07/11/2025

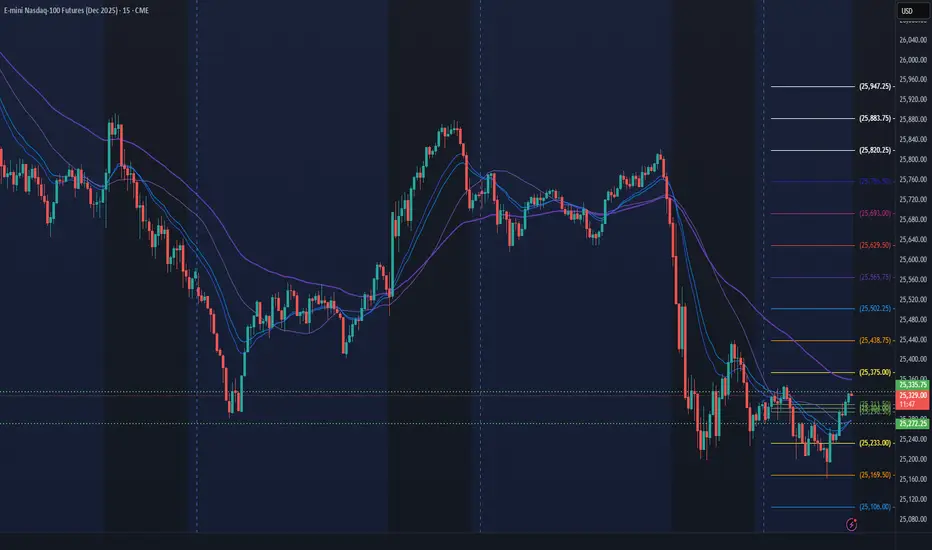
NQ Power Range Report with FIB Ext - 11/6/2025 SessionCME_MINI:NQZ2025
- PR High: 25335.75
- PR Low: 25272.00
- NZ Spread: 142.75
No key scheduled economic events
Session Open Stats (As of 2:55 AM)
- Session Open ATR: 420.01
- Volume: 55K
- Open Int: 296K
- Trend Grade: Long
- From BA ATH: -4.0% (Rounded)
Key Levels (Rounded - Think of these as ranges)
- Long: 26636
- Mid: 25410
- Short: 24039
Keep in mind this is not speculation or a prediction. Only a report of the Power Range with Fib extensions for target hunting. Do your DD! You determine your risk tolerance. You are fully capable of making your own decisions.
BA: Back Adjusted
BuZ/BeZ: Bull Zone / Bear Zone
NZ: Neutral Zone
Nifty 50Nifty 50 Chart Analysis......07-11-2025
If Nifty gives a 15 minutes closing below the 25420 level today, we may see Nifty trading below 25200 in the coming time.
Enjoy !
Note : Counting the impulse on Nifty chart, there are two harmonic targets at 25133 and 24760 levels.

NZDCHF; lower than higher for a long timeMy interpretation of Elliot Waves for NZDCHF on a weekly chart.
Around October'23 I lost hope of NZDCHF going lower due to price closing at the 50% fib retracement. In my observation when price closes at a 50% fib retracement - that is the reversal point. I thought Aug'23 was wave 3 and Oct'23 wave 5...I thought I missed the low. But the sideways move for wave gave me hope.
I'm expecting a lower low for NZDCHF to complete wave (5) of (V) or V which is in line at the 1.618 area

USDCHF Bearish From Here?FX:USDCHF has reached a resistance zone with previous lower highs and broken support on 1 and 4 hr timeframes. Presence of bearish divergence on RSI on both 1 and 4 hr timeframes indicating a potential bearish rally!
Im looking to short at previous support + the 0.382 Fib level for an optimal position and risk to reward on the trade!
