XAUUSD (ONDA) IntraSwing Levels For 29 -30th Oct (2.30 pm) 2025🌡️Plot Levels Using 3 Min, 5 Min Time frame in your Chart for Better Analysis
L#1: If the candle crossed & stays above the “Buy Gen”, it is treated / considered as Bullish bias.
L#2: Possibility / Probability of REVERSAL near RLB#1 & UBTgt
L#3: If the candle stays above “Sell Gen” but below “Buy Gen”, it is treated / considered as Sidewise. Aggressive Traders can take Long position near “Sell Gen” either retesting or crossed from Below & vice-versa i.e. can take Short position near “Buy Gen” either retesting or crossed downward from Above.
L#4: If the candle crossed & stays below the “Sell Gen”, it is treated / considered a Bearish bias.
L#5: Possibility / Probability of REVERSAL near RLS#1 & USTgt
HZB (Buy side) & HZS (Sell side) => Hurdle Zone,
*** Specialty of “HZB#1, HZB#2 HZS#1 & HZS#2” is Sidewise (behaviour in Nature)
Rest Plotted and Mentioned on Chart
Color code Used:
Green =. Positive bias.
Red =. Negative bias.
RED in Between Green means Trend Finder / Momentum Change
/ CYCLE Change and Vice Versa.
Notice One thing: HOW LEVELS are Working.
Use any Momentum Indicator / Oscillator or as you "USED to" to Take entry.
⚠️ DISCLAIMER:
The information, views, and ideas shared here are purely for educational and informational purposes only. They are not intended as investment advice or a recommendation to buy, sell, or hold any financial instruments. I am not a SEBI-registered financial adviser.
Trading and investing in the stock market involves risk, and you should do your own research and analysis. You are solely responsible for any decisions made based on this research.
"As HARD EARNED MONEY IS YOUR's, So DECISION SHOULD HAVE TO BE YOUR's".
Do comment if Helpful .
In depth Analysis will be added later (If time Permits)
Fibonacci

EURJPY SHORT After seeing the previous daily candle close bearish below the low of the last bullish candle we could expect price to continue selling off since we saw a rejection at a key weekly level

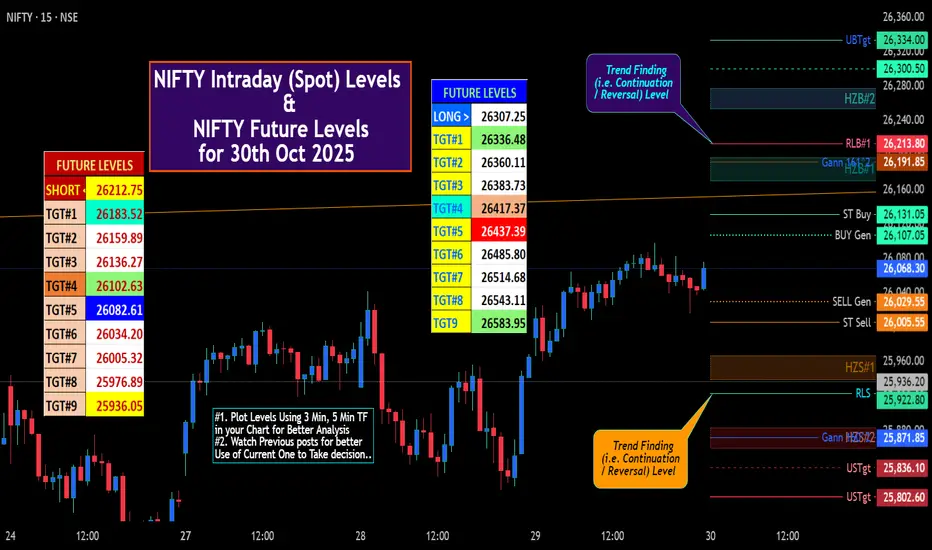
NIFTY IntraSwing (Spot) Levels & Future Levels for 30th Oct '25🚀 "NIFTY Future Levels for 30th Oct 2025" mentioned in BOX format.
🌡️Plot Levels Using 3 Min, 5 Min Time frame in your Chart for Better Analysis
L#1: If the candle crossed & stays above the “Buy Gen”, it is treated / considered as Bullish bias.
L#2: Possibility / Probability of REVERSAL near RLB#1 & UBTgt
L#3: If the candle stays above “Sell Gen” but below “Buy Gen”, it is treated / considered as Sidewise. Aggressive Traders can take Long position near “Sell Gen” either retesting or crossed from Below & vice-versa i.e. can take Short position near “Buy Gen” either retesting or crossed downward from Above.
L#4: If the candle crossed & stays below the “Sell Gen”, it is treated / considered a Bearish bias.
L#5: Possibility / Probability of REVERSAL near RLS#1 & USTgt
HZB (Buy side) & HZS (Sell side) => Hurdle Zone,
*** Specialty of “HZB#1, HZB#2 HZS#1 & HZS#2” is Sidewise (behaviour in Nature)
Rest Plotted and Mentioned on Chart
Color code Used:
Green =. Positive bias.
Red =. Negative bias.
RED in Between Green means Trend Finder / Momentum Change
/ CYCLE Change and Vice Versa.
Notice One thing: HOW LEVELS are Working.
Use any Momentum Indicator / Oscillator or as you "USED to" to Take entry.
⚠️ DISCLAIMER:
The information, views, and ideas shared here are purely for educational and informational purposes only. They are not intended as investment advice or a recommendation to buy, sell, or hold any financial instruments. I am not a SEBI-registered financial adviser.
Trading and investing in the stock market involves risk, and you should do your own research and analysis. You are solely responsible for any decisions made based on this research.
"As HARD EARNED MONEY IS YOUR's, So DECISION SHOULD HAVE TO BE YOUR's".
Do comment if Helpful .
In depth Analysis will be added later (If time Permits)
GOLD → The market is testing 4K ahead of the Fed's decision FX:XAUUSD is testing $4,000 ahead of the Fed's decision, partially recovering from a 3.5% drop this week. The fundamental backdrop is mixed, but technically, the signs of a bull market are positive.
Key factors : Fed decision (today): A 25 bps rate cut is expected, but the main focus is on the vote count and Powell's comments.
A dovish scenario (emphasis on risks to the labor market) will support gold. A hawkish surprise will reinforce the correction. Trump-Xi meeting (tomorrow): Statements about lowering tariffs weaken demand for defensive assets.
Gold is in limbo; in the second half of the European session and the beginning of the US session, the market may enter a phase of stagnation. Growth is only likely if the Fed takes a soft tone, while progress in trade negotiations or a hawkish surprise from the Fed will prolong the correction.
Resistance levels: 4015, 4050, 4085
Support levels: 3975, 3945, 3900
If the bulls can hold their ground above 4K, we will see strong support, in which case growth to 4050-4100 may be triggered. Otherwise, the market may form a correction to 3975-3945. It is worth keeping an eye on comments from Powell and Trump... Volatility will be high...
Best regards, R. Linda!

XAU/USD
Good morning, traders! ☀️
In today’s gold analysis, I’m watching for a potential bounce around the 4012–4020 zone, which aligns with a key resistance level and the 0.5 Fibonacci retracement. Ideally, I’d like to see price move down toward the 3982 support area, where the 0.382 Fib level sits, before aiming for a bullish reversal.
With major news events on the calendar today, many traders are eyeing lower zones on the chart to position themselves long. Stay sharp and manage your risk—reducing your lot size is crucial in volatile conditions if you want to protect your account.
Wishing you all a profitable and disciplined trading day! 🚀📈

AUDUSD – corrective math in motion.Price retraces into the prior order block that broke structure, completing a textbook ABC correction inside a premium zone. Liquidity pools just above IDM hint at a sweep before continuation toward 0.63.
Strengths :
Confluence between wave symmetry, premium retracement, and liquidity structure. Clear invalidation point above IDM keeps risk defined.
Weaknesses :
AUD fundamentals (RBA policy shifts, USD softness) could disrupt structure-based setups. No confirmed momentum shift yet on lower timeframes — patience required.
SmellyTaz — decoding chaos .

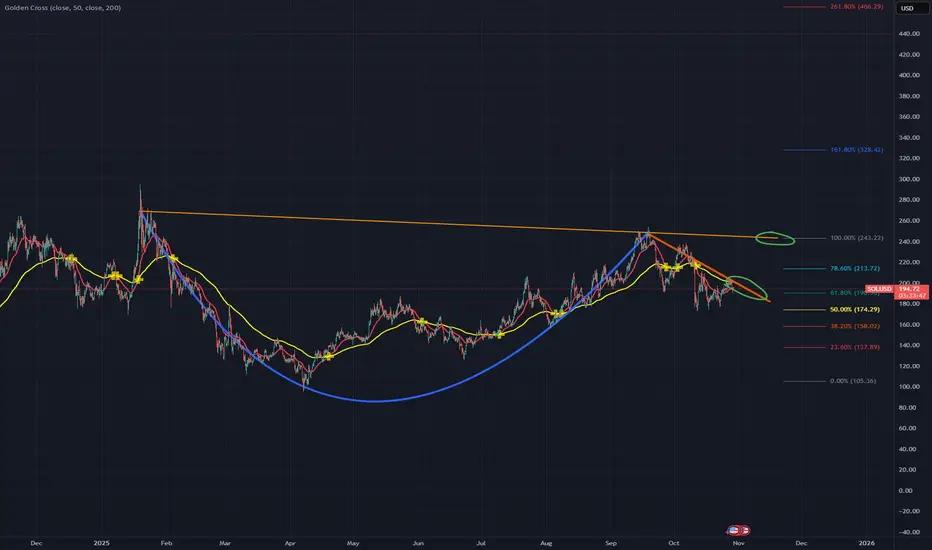
Cup and Handle pattern about to playout?A very possible scenario that could playout. All we need is some good news in this world: end of FED QT, more rate cuts and of course the tariff deal with China we have all been waiting for.
Important levels to look for for a breakout in this case are highlighted with green and of course the fib retracement drawn next to it.
If both breakouts are confirmed, then I think that $328 could become our new ATH in Q4 this year!
1000PEPE looks good from here?I did my analysis on different times frames, On higher time frame we are bearish, Short time frame up or down is unpredictable. On as you guy can see price didn’t respect trend and breakdown’ It’s does means that 100% is goin down because we also have Fib Support may that change the market direction from bearish to bullish. We also have FVG which didn’t respect it also and As you guys can see the situation of market mostly up and down by news. So I don’t expect anything good news for the market right now but we should prepare for everything. Those analysts on daily time frame.

GBPNZD - Looking To Sell Pullbacks In The Short TermH1 - Strong bearish move.
No opposite signs.
Expecting bearish continuation until the two Fibonacci resistance zones hold.
If you enjoy this idea, don’t forget to LIKE 👍, FOLLOW ✅, SHARE 🙌, and COMMENT ✍! Drop your thoughts and charts below to keep the discussion going. Your support helps keep this content free and reach more people! 🚀
-------------------------------------------------------------------------------------------------------------------

GOLD → Sell-off due to uncertainty FX:XAUUSD is falling, the trend is downward, and we have confirmation of this. Profit-taking is leading to a decline, which is causing buyers to exit the market...
Caution ahead of the Fed: Markets are pricing in a 25 bp rate cut, but the main thing is the tone of the statement and Powell's comments on further steps. The USD is not ready to continue its growth and is starting to look downwards. The US government shutdown continues, adding uncertainty, which supports gold.
However, an important issue is the trade deal between the US and China; a positive outcome could put pressure on gold.
Gold is balancing between hopes for a trade truce and risks from Fed policy.
Support levels: 3895, 3820
Resistance levels: 3943, 3975, 4015
Since the opening of the session, the price has fallen by 2.3%, which is an intraday range. The 3900-3895 area may see a reaction in the form of a false breakdown and a correction to the imbalance zone before a possible further decline.
Best regards, R. Linda!

AUDUSD → Attempt to reverse the trend to bullish FX:AUDUSD is forming a correction after breaking through the resistance of the downward channel. The market needs a trading range or consolidation above 0.6526.
The dollar is consolidating but is not ready to continue growing. Pressure on the currency is emerging ahead of the Fed meeting. This may support the growth of the Australian dollar.
The currency pair is entering a distribution phase after consolidation. The breakout of 0.6526 triggered a break of the downward channel resistance. An attempt to change the trend is forming. If the bulls keep the price above 0.6526, this could trigger further growth.
Resistance levels: 0.6567, 0.661
Support levels: 0.6526, 0.6493
At the moment, an attempt to change the trend has been initiated. Consolidation and distribution are a good sign, but above the previously broken trend line, a trading range should form, which will confirm the fact of a change in the local trend.
Best regards, R. Linda!

Possible upward movement for AVAXIn recent days, there has been a pattern of accumulation, and in the 4-hour timeframe, a reverse head-and-shoulders pattern can be seen.
If we add the gap filled in BTC and ETH + accumulation in the TOP 10, it could result in an upward movement for altcoins.

XAUUSD | Gold to drop 2000PIPS, where is the best sell zone?🔍 Market Context
After breaking the medium-term uptrend structure at the main Trendline , gold has formed a clear sequence of Lower High – Equal Low (EqL) , indicating a phase shift from bullish to bearish.
Currently, the price is fluctuating around the 3,960–3,970 USD zone – this is a temporary liquidity accumulation area before heading up to retest the resistance at 4,015–4,050 USD , which was previously a Demand Zone now turned into a Supply Zone .
If a strong bearish reaction occurs here, it is highly likely that the price will extend its decline towards the Order Block 3,945–3,960 USD zone, or even deeper to the Premium Zone 3,884 USD .
💎 Key Technical Structure
Main Trendline: broken, confirming a structure change (ChoCH).
Resistance Zone: 4,010–4,015 → quick reaction resistance.
Supply Zone: 4,043–4,060 → strong technical pullback zone.
Premium Zone: 3,884–3,900 → discount zone, potential temporary bottom.
📈 Trading Scenarios
1️⃣ SELL Zone 1 – Scalp Reaction at Resistance Zone
Entry: 4,010 – 4,015
SL: 4,025
Take Profit : 4,005 - 3,995 - 3,975 - 3,965 - Open
➡️ Quick scalp reaction at nearby resistance – suitable for London/NY session trading.
2️⃣ SELL Zone 2 – Major Retest at Supply Zone
Entry: 4,043 – 4,060
SL: 4,065
Take Profit : 4,050 - 4,040 - 4,030 - 4,020 - 4,010/Open
➡️ Main setup – retest of supply zone confluencing with broken trendline, high probability if strong rejection on H1/H4.
3️⃣ SELL Continuation – Break & Retest below 3,945 USD
Entry: 3,945 – 3,950
SL: 3,965
TP: 3,884
➡️ Setup breaks EqL bottom confirming downtrend continuation, targeting Premium Zone.
4️⃣ BUY Setup – Reversal at Premium Zone 3,900 USD
Entry: 3,900
SL: 3,880
TP1: 3,910 - 3,920 - 3,930 - 3,940 - 3,950/Open
✅ Condition:
Only buy when a strong reaction candle appears (long-tail rejection / ChoCH bullish on M15–H1).
➡️ This is the final discount zone before major capital can return to the market – technical reversal setup, low risk / high reward.
⚠️ Risk Management
Prioritize SELL at supply zones, BUY at Premium – avoid trading mid-range.
Reduce volume in scalp setup (Sell 1).
If price closes above 4,070 → short-term downtrend is invalidated.
💬 Conclusion
Gold remains under short-term bearish pressure, however, the 3,884–3,900 USD zone could act as strong support.
The suitable strategy is to capitalize on the two resistance zones for Selling and observe technical Buying at the Premium bottom.
👉 Comprehensive Strategy:
Sell 4,010–4,015 | SL 4,025 | TP 4,005 → 3,965 🎯
Sell 4,043–4,060 | SL 4,065 | TP 4,050 → 4,010 🎯
Buy 3,900 | SL 3,880 | TP 3,910 → 3,950 🎯
🔥 “Trade with patience, react at precision zones — that’s how consistency is built.”
⏰ Timeframe: 1H
📅 Update: 28/10/2025
✍️ Analysis by: Captain Vincent

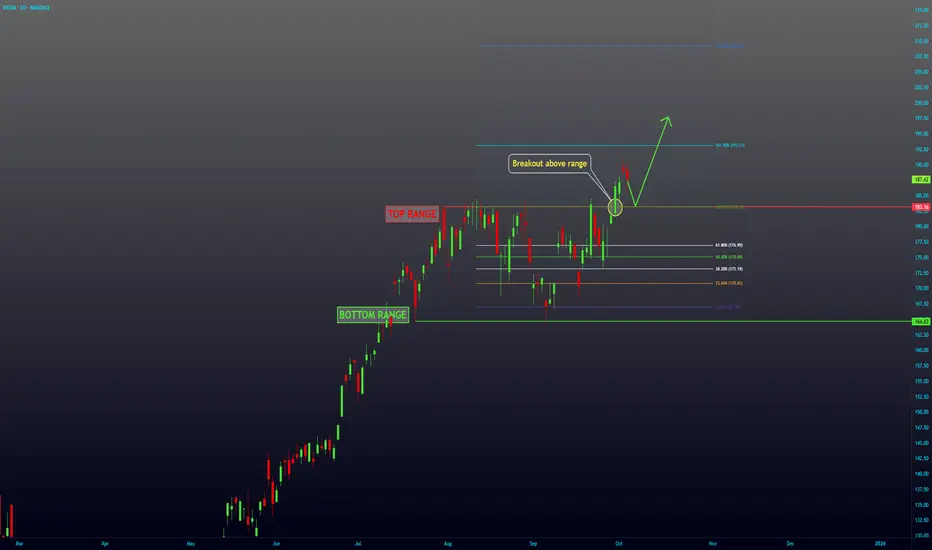
NVDA Breakout -- Continuation UPNASDAQ:NVDA has been in a range since end of July until September 30th, where it broke above the range. I expect to see more upside from here.
AMZN Break Out -- Bullish1HR time frame paints a good picture of what's to come in the short term...at least from my perspective.
AMZN finally broke through the sideways chop today with momentum and pushed to the 1.618 fib (from the closed peak of the last wave on 10/3 to the closed low on 10/6).
RSI showing momentum and in an upward trend despite the recent choppiness since 9/25.
RSI peaked at about 77, and looking to cooldown after the breakout. I suspect we'll see price revisit mid $223 before continuing upwards. Will most likely see stair stepping up to the $230's.

ADAUSDT — Dual Wave ConfluenceTwo independent cycles now point to the same liquidity zone.
The wine wave (macro) has entered its BC retracement phase, and its BC target aligns perfectly with the green micro-wave’s C-target , forming a rare dual confluence at the same level. This overlap creates a liquidity magnet — a structural point where both wave systems expect equilibrium before a bullish expansion.
Price is currently reacting inside the BC demand zone , finalizing the correction before expansion toward the macro C projection at 0.7575 .
The alignment between both scales confirms that momentum and liquidity are synchronized for continuation.
Strengths :
Perfect alignment of macro BC and micro C targets
Discount entry within structural demand
Defined invalidation below BC low
High asymmetric RR toward 0.7575
Weaknesses :
Requires bullish displacement confirmation from demand zone
Possible short-term inducement before expansion
Invalidation if structure breaks below BC
Bias : Bullish continuation
Target : 0.7575 (macro C projection zone)

$GOLD is COOKED! Rotation into $BTC Soon!!MARKETS ARE SIGNALING RISK-ON 🔥
TVC:GOLD is so unbelievably COOKED 👨🍳
3 Black Crowes printed on the Daily, with a decisive close below the 20MA 🗡️
Waiting on the final nail in the coffin to close below the DANGER ZONE ~$3,900 where we will then see GOLD retest the 50MA along with the 50% Gann retrace $~3,750 ⚠️
I very much expect the rotation into CRYPTOCAP:BTC soon 👑

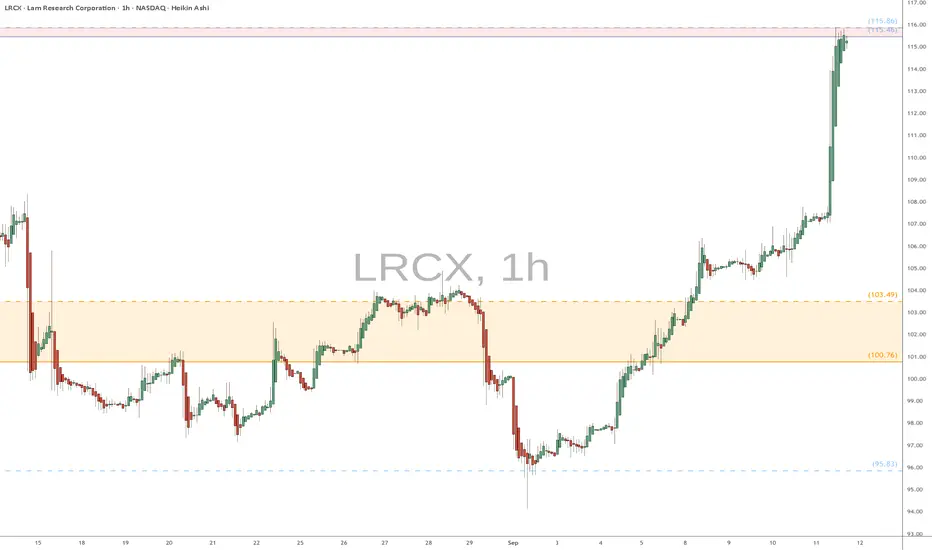
LRCX heads up at $115: Minor but Notable resistance to the SurgeLRCX surged into a minor but significant resistance
Combination of Genesis+Covid fibs at $115.46-115.86
Expecting a pullback from here, or orbit then drop.
.
Previous analysis that caught the PERFECT BreakOut:
Hit BOOST and FOLLOW for more PRECISE and TIMELY charts.
====================================================
.
#ML Mintlayer and the battle of the five armies ^^#ML Mintlayer fails to break the $0.2298 zone and faces a violent rejection. It pulls back just as harshly below the initial accumulation zone (golden pocket) to the next Fibonacci level around $0.0484 and is currently consolidating to form a support level in accumulation.
A relatively unexpected move for a project of this caliber.
The key zone/FLIP must act as support before considering higher targets. This refers precisely to the length of the upper wick from the December candle, marked on the chart with a red arrow.
Good luck accumulating, consolidating, or trading!

GBP/NZD 📉 GBP/NZD – Technical & Fundamental Overview
🔍 Current Setup
- Price is hovering near a key support zone.
- A **retracement to 2.31636** (0.382 Fibonacci) is possible if GBP stabilizes.
- A **break below support** could trigger a move toward **2.26992**, the lower boundary of the descending channel.
---
🗞️ Latest GBP News – October 28, 2025
- **GBP weakened today** due to **soft inflation data** and **fiscal concerns**.
- UK inflation undershot expectations, reinforcing speculation of a **Bank of England rate cut**.
- The pound also faces pressure from rising **U.S. dollar strength** ahead of the Fed decision tomorrow.
- Despite a brief lift from risk-on sentiment tied to U.S.–China trade optimism, GBP remains vulnerable.
---
📆 Outlook for the Week
🔺 Bullish Scenario
- If UK data stabilizes and the Fed delivers a dovish cut, GBP could rebound.
- In this case, GBP/NZD may retrace toward **2.31636**, with potential to test higher resistance zones.
🔻 Bearish Scenario
- If UK macro data continues to disappoint or the Fed surprises hawkishly, GBP may extend losses.
- A break below current support could send GBP/NZD toward **2.26992**, aligning with broader downside momentum.
---
Traders should watch for confirmation around support levels and stay alert to macro headlines, especially the Fed’s rate decision and UK economic sentiment.

Gold Prices Retreat from Record High- FOMC on TapGold prices are retreating from record highs with a decline of more than 11.3% now testing a major pivot zone at the 38.2% retracement of the August advance at 3973- looking for a reaction off this mark with a break / close below needed to suggest a more significant high is in place / a larger correction is underway. Subsequent support objectives rest with the 50% retracement / October open at 3846/59 with broader bullish invalidation steady at 3700/20.
Initial resistance remains with the 10/21 reversal close at 4125 with a breach / close above 4251 needed to mark resumption of the broader uptrend. Keep in mind this is a massive week for event risk with the FOMC, BoC, ECB, and the BoJ interest rate decisions on tap as the government shutdown extends into the fourth week. Stay nimble into the releases and watch the weekly close here for guidance.
-MB

US Dollar Coiled for Breakout ahead of the FedThe US Dollar is coiling just below resistance, with DXY trading within a contractionary range ahead of tomorrow’s FOMC rate decision. The index rallied nearly 3.5% off the yearly lows before stalling, with price consolidate within the first weekly range of October heading into the highly anticipated FOMC rate decision tomorrow. The focus is on a breakout of this range to drive the next directional move as we head into the close of the month.
Weekly support rests with the 61.8% retracement of the mid-September rally / 2025 low-week close (LWC) at 97.50/65. A break / weekly close below this threshold would threaten downtrend resumption toward the 2021 high at 96.94 and the June low at 96.37 – both areas of interest for possible downside exhaustion / price inflection IF reached. The next major technical consideration rests 94.65/97- a key pivot-zone defined by the March 2020 swing low, the 78.6% retracement of the 2021 advance, and the 100% extension of the 2023 decline. Look for a larger reaction there IF reached.
Weekly resistance is eyed at the 2023 low / 209 high / April low-week close (LWC) at 99.59/67 with bearish invalidation just higher at the 2024 low / LWC at 100.16/42- a breach / weekly close above this threshold is needed to suggest a more significant low is in place / a larger trend reversal is underway. Subsequent resistance objectives eyed at the 38.2% retracement of the yearly range at 101.55 and the 52-week moving average at 101.98.
Bottom line: The U.S. Dollar is coiled just below resistance, and the focus is on a breakout of the 97.50-99.66 range for guidance heading into the close of the month. From a trading standpoint, losses should be limited to 97.50 IF the Dollar is higher on this stretch with a breach above 100.41 needed to validate a more significant breakout in price.
-MB

Fibonacci Beyond the ObviousFibonacci Beyond the Obvious
The Professional Approach — WerkTrader Edition 🎯
1️⃣ Introduction – More Than Just a Sequence
Fibonacci is not magic, myth, or a decorative tool for colorful charts.
It is a mathematical ratio that appears in nature, architecture, music – and yes, in markets.
If you only know Fibonacci as the 61.8 retracement, you understand the concept,
but not the depth.
A true analyst doesn’t use Fibonacci to draw lines –
he uses it to measure structure,
to see where the market stands in relation to itself.
2️⃣ The Principle of Self-Similarity
Markets are fractal.
They move in repeating proportions, regardless of timeframe.
A 38.2 pullback on the 15-minute chart can have the same character
as a 61.8 retracement on the daily.
Professionals call this Fractal Alignment –
multiple timeframes reacting to the same ratio,
and that’s exactly where the decisive moves occur.
3️⃣ Fibonacci Timing – The Invisible Factor
Most traders measure price, not time.
But Fibonacci also works horizontally.
13, 21, 34, 55 – not as price levels,
but as candle intervals between significant highs and lows.
These Fibonacci Time Projections reveal
when market cycles overlap –
often the moment before price reacts to a known zone.
Institutional models use this quietly,
while retail traders almost always overlook it.
4️⃣ Fibonacci in Orderflow
Fibonacci zones are not magical support lines –
they are points of liquidity interaction.
At 61.8 %, three groups often collide:
1️⃣ Retail shorts fading the retracement,
2️⃣ Smart-money algorithms collecting liquidity,
3️⃣ Position builders using the pullback for entry.
Fibonacci is not a signal – it’s a trigger area,
a place where energy releases.
5️⃣ Asymmetry and Precision
The famous ratio φ ≈ 1.618 is mathematically perfect,
but markets are not.
A professional observes the deviation from the ideal –
often just 1–2 %.
Those small over- or undershoots reveal who dominates:
reaction or manipulation.
This is called Fibonacci Deviation Bias –
a subtle detail that shows whether a zone was merely tested
or truly broken.
6️⃣ Cluster Theory – The Art of Overlap
A single level is coincidence.
But when multiple retracements or extensions
align within the same price area,
a cluster is formed.
This overlap of different swings is called Confluence.
The more Fibonacci relationships converge,
the stronger the reaction.
A professional doesn’t look for the “perfect number” –
he looks for the connection of proportions.
Mathematics confirms itself where ratios intersect.
7️⃣ Fibonacci & Harmonic Patterns – Geometry of Confirmation
Harmonic patterns are the advanced geometry of Fibonacci relationships.
They consist of several precisely measured retracements and extensions,
forming a geometric reversal structure –
like the Gartley, Bat, Butterfly, or Crab.
Each one is built on the same base ratios:
XA → AB = 61.8 %,
BC = 38.2–88.6 %,
CD = 127–161.8 %.
When these measurements meet at a single point,
they create the PRZ (Potential Reversal Zone) –
the mathematical intersection between order and chaos.
The more Fibonacci connections overlap,
the stronger the confirmation.
That’s not coincidence – that’s confluence in its purest form.
8️⃣ Fibonacci as a Language
Fibonacci is not a strategy – it’s a language of proportion.
It doesn’t tell you where to buy,
it tells you where to listen.
The market doesn’t speak in words,
it speaks in ratios.
Those who understand them see structure
where others see only lines.
9️⃣ Conclusion – The Silence of Numbers
Fibonacci is not a myth.
It is the quietest form of truth in the market.
Numbers themselves do not speak –
but they show you where the market reacts,
where mathematics meets psychology,
and where patience becomes power.
Fewer lines.
More meaning.
This is Fibonacci – beyond the obvious.
WerkTrader 🎯
