Hindustan Zinc – Rounding Bottom Breakout (Pre-emptive)Hindustan Zinc – Rounding Bottom Breakout (Pre-emptive)
Setup: Rounding bottom formation on higher timeframe
CMP: ₹690
SL: ₹570 (structure breakdown)
🎯 Targets (trail progressively)
T1: ₹737 T2: ₹807 T3: ₹895 T4: ₹1,110 T5: ₹1,236
Fibonacci confluence: Long-term Fibonacci extension 1.61 ≈ ₹1,211, aligning with T5 zone → strengthens the structural target.
🔗 Why this works
Silver linkage: Hindustan Zinc benefits from silver strength; the ongoing global silver run supports the upside bias.
Fundamentals: Quarterly results were strong, improving confidence to hold through volatility.
Structure: Rounding bottom indicates accumulation → expansion if the neckline sustains.
⚠️ Risk & Execution Notes (read carefully)
If global cues turn unstable and silver corrects, expect sharp volatility.
Do NOT go all-in. Use staggered buying near dips/confirmations.
Strict position sizing is critical; patience required to capture higher targets.
Trail SL once T1–T2 is achieved to protect capital.
⚠️ Clarification:
This is an independent analysis based purely on technical and market study. No part of Religare is involved in this view or recommendation.
📝 Important:
I am not responsible for any loss or profit incurred. I am not taking any fees for these views – just sharing my analysis for educational and informational purposes.
📉 Disclaimer: Not SEBI-registered. Please do your own research or consult a financial advisor before taking any investment decision.
Fibonacci

Natural Gas Short, Does the Lion roar the loudest before dying ?Nat gas is in a classic negative Dow structure but has rallied 25% in 2 days, this may show strength but saw strong rejection from previous swing high, which gave me confidence to grab some Future shorts with a take profit of 300. (I don't have a definitive SL as i will make it 370, 380 or 390 depending on the strength of the move )
NG below 270 could see a free fall, keep a look out for it.

NQ Power Range Report with FIB Ext - 1/21/2026 SessionCME_MINI:NQH2026
- PR High: 25175.25
- PR Low: 25103.50
- NZ Spread: 160.5
Key scheduled economic events:
08:30 | U.S. President Trump Speaks
Session Open Stats (As of 12:55 AM)
- Session Open ATR: 349.33
- Volume: 39K
- Open Int: 267K
- Trend Grade: Long
- From BA ATH: -4.4% (Rounded)
Key Levels (Rounded - Think of these as ranges)
- Long: 26521
- Mid: 25264
- Short: 24008
Keep in mind this is not speculation or a prediction. Only a report of the Power Range with Fib extensions for target hunting. Do your DD! You determine your risk tolerance. You are fully capable of making your own decisions.
BA: Back Adjusted
BuZ/BeZ: Bull Zone / Bear Zone
NZ: Neutral Zone

AVGO - Heading for a discountAVGO - the sector is cooling down a bit. Probably we'll see a big chunk of profit taking in 2026.
If we see a pop here , we can get a better short entry zone around 376-400 zone.
If we dont see a pop, if it continues slide down, we've to chase it.
- Big volume gap below
- Pullback to 200DMA
- Pull back to previous high / can act as support
Target 1- 300
Target 3 - 250
Stop loss - 410 (trail it)

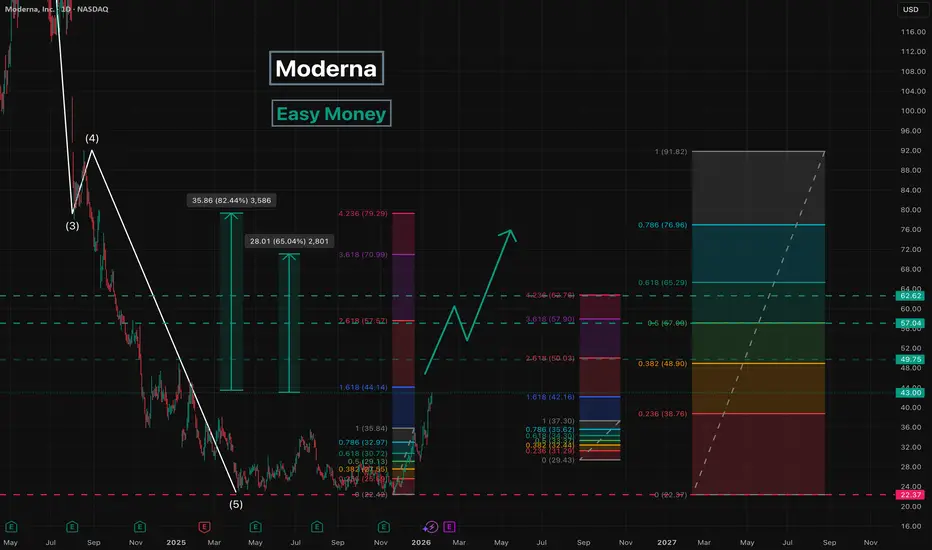
Moderna - Easy MoneyWe continue the idea from the previous post, where the initial targets have already been reached.
At the moment, price action in Moderna shares is correcting the fifth wave formed during the downside move.
The structure suggests a developing bullish impulse, and the upward move is likely to continue.
So far, wave 1 and wave 2 of this impulse have been completed.
Key targets:
49 - local pullback within wave 3
57 / 62 - potential completion zone for wave 3 , followed by a correction
71 / 79 - potential completion zone for the entire move
The upside potential from current levels is estimated at 65 - 82 %.
---
Please subscribe and leave a comment!
You’ll get new information faster than anyone else.
---
Dollar Index Bullish 01/20/2026The dollar index showing a potential reversal to the bullish side, making the dollar gain strength. TVC:DXY

GOLD EYES THE NEXT EXPANSION ZONEXAU/USD D1 - Keeps grinding higher after yesterday’s target at 4,864 was almost reached, showing that buyers are still firmly in control. The structure remains clean with higher lows intact, and no meaningful rejection so far.
Based on the Fibonacci ABCD extension, the next upside levels to watch are 4,975 and 5,167, as long as price holds above the key support at 4,274. Pullbacks are likely to stay corrective rather than trend-changing.

GBPUSD Short 01/20/2026A nice short sell possible completes before London 3:1 RR. 4Hour and 1Hour showing bearish signals, and the 15minute is correlating together for a sell. FPMARKETS:GBPUSD

BTC is Way Over Sold! 01-20-2026So, I Long with a 125x leverage on BloFin BTC Perpetuals Futures! lol
My Target with the Fibonacci Retracement is 103k Around a 16% move!

Looking for Bottom Close To This AreaFor large time frame I'm looking for a triangle in wave 4 or a overshooting a B wave. The rectangle box at the top is the targets for overshooting B wave. It's to early to tell which scenario. As for short time frame I expect a rebound from this area with target area being the 1.236 or 1.618. We should see a five wave move up to complete the C wave.

Trend Continuation DOTDOT - Trend Continuation Setup
In my previous post, I outlined the primary scenario in which we had already seen an A- and B-wave, followed by a C-wave completing within the 23.6% to 38.2% Fibonacci retracement zone.
This scenario has now played out as expected.
From the bottom of the (C)-wave, I currently assume that we have already seen an impulsive Wave (1) of a new 5-wave impulse structure.
However, this move only slightly exceeded the level of the previous Wave (3), which is why I do not yet consider the trend fully confirmed.
For proper trend confirmation, I would now like to see a shallow / flat Wave (2) correction. Such a controlled pullback would allow price to build energy and then break the previous high impulsively.
This would also increase the probability of DOT breaking above the Daily 50 EMA, which would further strengthen the bullish case.
As long as this structural scenario remains intact, I consider the higher-timeframe bias to remain on the long side.
Alternative Scenario (Lower Probability)
An alternative - less likely, but still possible - scenario is that the move previously labeled as Wave (3) was in fact already a Wave (5).
If this is the case, the prior impulse would be fully completed.
Under this scenario, we would have to expect a full corrective move of the entire impulse before any sustainable trend continuation can develop.
Key confirmations would be a clear break in structure and a lack of impulsive behavior on the upside.
At the moment, this is not my preferred scenario. However, if price action and structure start to shift in this direction, I will publish a separate post including a full visual breakdown of this alternative count.

HIVE on mid-term top and more downside potentialPrice has reached the key macro resistance outlined as a potential extension in the October update and continues to act in line with the reversal hypothesis mentioned in the last week review.
While price might already be completing the initial wave of decline, any recovery attempts should be approached as a bounce within a developing corrective phase, with the next macro support zone at 4–2.5 levels.
Chart:
Previously:
• On downside reversal (Oct 13) and on possible upside extensions (Oct 6): see chart in weekly review —
• On further upside potential (Sep 30):
Chart:
www.tradingview.com
• On bullish potential (Sep 10):
Chart:
www.tradingview.com
• On bullish trend structure (Jul 21):
Chart:
www.tradingview.com

W: watching for upside momentum to continue Strong uptrend linearity with three days of low-volume sideways drift following the recent gap-up move.
As long as price holds above the 100–94 local support zone, I’m looking for upside momentum to continue toward the next potential resistance levels at 116–130–140, with a possible extension into the 185+ region.
Chart:
Chart (Macro view):

AMD: entering mid-term resistance levelNASDAQ:AMD price followed through from the support zone into the important mid-term resistance outlined in the October updates.
One of the strongest structures and setups on the market. And while there’s still potential for a move into the higher resistance area at 260–277, I expect selling pressure to start building over the next few weeks, leading to a pullback and potential consolidation phase.
Breaking out above 277 will force me to reconsider the trend suggested trend structure.
Chart:
Previously:
• On resistance zone (Oct 13):
• Upside potential (Oct 7):
see in weekly review
Previously this year:
• On macro resistance (Jul 29):
• On resistance & bounce potential (Aug 6):
• On macro bottoming potential (Apr 25):

SPY : downwards move announced on Jan 8th in motionAs I hinted on Jan 8th, I expected a downwards move to unfold this month, on the basis of identical patterns.
It is unfolding from today 20th January
The supports are likely to be broken.
Taking the low in April 2025 at 484 and the recent high at 696, logarithmic Fibonacci projections gives :
0.7624 = 638
0.6182 = 606
Applying the insight of Shaikh 2016 on gravitation towards equilibrium, sharply undershooting the target will create the opportunity to buy
My Strategy
I will choose SPY or QQQ. I will engage in neutral strategy (delta = 0) made of the underlying and an option combo which requires very low margin. The position will be huge leading to borrowing up to 25 times capital. The goal is to take advantage of a slight increase of delta.

EURUSD IDEATesting EURUSD in this zone, hoping for a potential bounce to the upside. There a multiple zones in one for this idea so i do think it has a good chance to bounce. Give me your thoughts?

EURUSD Yearly Candle, Bullish 2026The yearly of 2025, was bullish, rising from historic lows
1) 2026 has 2 options, either push higher and leave for good amount of correction in 2027
In this scenario 2026 will close as a bullish engulfing candle
2) or correct within the boundaries of 2025 candle, some sort of liquidity grab, or retest, in this scenario 2026 candle will draw an indecision candle, contained within the boundaries of 2025 candle

Aussie Bulls Charge Uptrend ResistanceNotes: AUD/USD broke above last week’s range today with Aussie extending more than 1.2% off the monthly lows. The advance is trading just below initial resistance in early US trade at the 78.6% retracement of the monthly range at 6745. A topside breach / daily close above would expose subsequent resistance objectives at the monthly high at 6767 with the next major technical consideration eyed with the 2024/2023 yearly opens at 6810/17.
Initial support now rests at the 2025 high-close at 6717 with near-term bullish invalidation now raised to the median-line, currently near ~6700. Key support remains unchanged at the monthly range low and the yearly open at 6663/74- a break / close below this zone would be needed to suggest a more significant high is in place and a larger trend reversal is underway.
Bottom line: Aussie is attempting to validate a near-term breakout here with price now testing initial resistance. From a trading standpoint, losses would need to be limited to 6700 IF price is heading higher on this stretch with a close above 6745 needed to fuel the next leg of the advance. Keep in mind we get the release of Australia employment data tomorrow with consensus estimates calling for an uptick to 4.4% in the unemployment rate.
-MB

BTC heads up at 97.8k: Genesis fib that could mark a local TOPShown here is a single fib series in three different timeframes.
The "Genesis Sequence" has called all major turns since 2015.
Each fib is worth watching closely for possible entries or exits.
$ 85,354.35 Golden fib may well have been the bottom.
$ 97,769.44 is a minor fib but a big jump from our Golden.
$105,451.85 is a semi-major fib that if hit will surely dip it.
.
See "Related Publications" for previous calls such this PERFECT TOP CALL:
Hit BOOST and FOLLOW for more such PRECISE and TIMELY charts.
========================================================

US Dollar Plunges to Yearly Open Support- Moment of TruthThe Dollar Index broke below a major pivot zone today at 98.68/76- a region defined by the August high-day close (HDC), the May low, and the 38.2% retracement of the November decline. The decline was halted in early US trade at the objective yearly open at 98.23. Note that the lower parallel of a proposed descending pitchfork converges on this threshold over the next few days and a daily close below would be needed to fuel the next leg of this decline. Subsequent support is eyed at the 98-handle backed by the 2018 high and the 61.8% retracement of the September rally at 97.71/81- look for a larger reaction there IF reached. Initial resistance is now eyed back at 98.68/76 with bearish invalidation now set to the 61.8% retracement of the recent decline at 99.02.
Bottom line: A break of the late-December uptrend threatens a larger setback in the Dollar in the days ahead. From a trading standpoint, rallies should be limited to 98.76 IF price is heading lower on this stretch with a close below 98.24 needed to fuel the next leg of this decline. Keep in mind President Trump will be speaking at the annual World Economic Symposium tomorrow in Devos with key US inflation data (PCE) on tap Thursday.
-MB

GOLD - Consolidation after the rally before the rally...FX:XAUUSD started the week with growth, hitting a new all-time high amid geopolitical risks and threats of new tariffs from the US, and is now consolidating around $4,700...
Fundamental situation
Trump threatened to impose tariffs on eight European countries over the issue of buying Greenland.
Escalating tensions around Ukraine and Iran.
Fed:
Expectations of policy easing are supporting gold, but the appointment of a new Fed chair could slow down aggressive rate cuts. The investigation into Powell continues...
This week, PCE inflation data (Thursday) and US GDP for the third quarter are important.
Gold's rise since the beginning of the year has been independent of the strengthening dollar, underscoring the strength of internal drivers. However, a confident breakout to $5,000 will require confirmation of lower inflation in the US and continued high demand for safe-haven assets. Corrections may be profitable against the backdrop of an aggressive bullish trend...
Resistance levels: 4678, 4691, 4700
Support levels: 4656, 4650, 4640
Within the current range, I focus on the zones 4656 - 4650 - 4639. There is a high probability of a long squeeze/false breakout of support. However, I do not rule out the possibility of a local correction due to the holiday in the US (low liquidity, profit-taking may trigger a correction) before growth.
Best regards, R. Linda!

AA heads up at $65.12: Golden Genesis fib likely to cause DIPAA has been flying high with metals bulls run.
It has just hit a Golden Genesis fib at $65.12
Closing longs here and looking for a Dip-to-Fib.
.
Previous analysis that caught a PERFECT DIP:
Hit BOOST and FOLLOW for more such PRECISE and TIMELY charts.
========================================================
.

2026-01-20price action no structure at all today , movement is very quick
will just for my zone
it's about patience and waiting for the zone
just dip buy for now it it breaks the low will consider to sell
