ETH, trying to breakout, multiple attempts 200EMA and R1 pivotCRYPTOCAP:ETH
🎯Wave 1 appears to have completed a leading diagonal. Wave 2 appears complete with the recent higher low, but we need to break above wave 1 for confirmation. Price was rejected at the daily 200EMA and R! pivot, but is attempting to break through again. Overcoming this will be very bullish, especially as we are above the daily pivot.
📈 Daily RSI is printed hidden bearish divergence, followed by another bearish divergence. A move above wave (1) is essential to negate this, or prices could head to new local lows.
👉 Analysis is invalidated below wave (2)
Safe trading
Fibonacci

DOGE, testing daily pivot as support, not much changed in a weekCRYPTOCAP:DOGE
🎯 Price printed a bullish engulfing 3 white knight candle pattern. It is above the daily pivot, yet testing as support. A critical level to hold. DOGE is still below the daily 200EMA. Overcoming this will be very bullish. The Elliot wave count remains tricky, so I will await more confirmation.
📈 Daily RSI printed bullish divergence, then negated the bearish divergence. The RSI shot up too hard and fast, which often results in a reversal. The reversal took place and tested the daily pivot as suggested last week.
👉 Analysis is invalidated below the swing low, keeping the downtrend alive
Safe trading

BTC bearish divergence negated, 200EMA not yet testedCRYPTOCAP:BTC
🎯The bottom appears to be in as Bitcoin climbs the wall of worry once more. BTC showed strength this week, rejecting just below the daily 200EMA. This isn’t a great sign, I would like to have seen it tested to show strength. Still a possibility from here as price tests resistance, flipped support. Wave (3) appears to be underway; we should expect a strong move in the coming days/weeks. The first resistance will be the daily 200EMA; overcoming this will be bullish. Price is above the daily pivot, showing a bullish trend emerging.
📈 Daily RSI is creeping to overbought, bearish divergence was negated.
👉 Analysis is invalidated below wave (2), bringing up the downside target $76600
Safe trading

AAVE Hidden bearish divergence on the daily playing outEURONEXT:AAVE
🎯 The path from last week’s analysis is being followed, so far. Price printed a bullish engulfing candle breaking above the daily pivot, but was ultimately rejected at the R1 pivot, now testing the daily pivot and High Volume Node as support. The downtrend is intact. The first target for continued upside is the daily 200EMA and High Volume Node resistance at $210. Overcoming the daily 200EMA will add confluence to a major bottom being in. Wave (C) of triangle wave (D) appears to be underway.
📈 Daily RSI printed hidden bearish divergence which is playing out.
👉 Analysis is invalidated if we drop below $148, keeping wave (B) alive.
Safe trading

XAG to hit the psychological level of $100Targets are still very much bullish for 2026.
$100short term target
looking for a range between $80-100 for building up a liquidity block
Demand zone $71-74 - area of interest.
Daily (short term interest)
www.tradingview.com
Weekly
www.tradingview.com
Monthly Cup an Handle
www.tradingview.com
Calc of cup and handle:
Key zones
Critical resistance zones throughout the pattern:
Time Period Resistance Level Pattern Phase
1980-2011 $50+ (1980 high) Cup Formation
2011-2024 $49-$50 zone Handle Development
Late 2024 $50-$52 range Pre-breakout
Nov 2025 $55+ achieved Breakout Confirmation
Cup Structure (Multi-Decade)
Left Rim: ~1979–1980 highs near $49/oz — first peak.
Base: ~1982–2004 range near ~$3.46–$6.12 — extended bottom.
Right Rim: ~2011 high near ~$49/oz — second peak.
Handle structure:
Breakout Resistance: $49 (referring to 1979-80 and 2011), now 2025
$49-$3.46 = $45.54
use the extension target of $45.54 + $49 (breakout resistance) = $94.54 as a first point of reversal zone for an extension target.
Risk Warning
Trading leveraged products such as Forex, commodities and CFDs, carries with it a high level of risk and so may not be suitable for every investor. Prior to trading the foreign exchange, commodity or CFD market, consider your investment objectives, level of experience and risk appetite. You should never risk more than you can afford to lose. If you fail to understand or are uncertain of the risks involved, please seek independent advice and remember to conduct due diligence as criteria varies to suit the individual.
Below are some of the take aways from the video - please listen again incase any detail is missed.
Do you enjoy the setups?
Professional analyst with 8+ years experience in the capital markets
Focus on technical output not fundamentals
Focus on investing for long term positional moves
Provide updates where necessary - with new updated ideas tracking the progress.
If you like the idea, please leave a like or comment.
To all the followers, thank you for your continued support.
LVPA MMXXVI

Trump Vs EU- Market FUD - Gold -Safe Haven Can ActivateIn a significant escalation of transatlantic tensions, President Trump announced via social media this past Saturday a new 10% tariff on eight European nations—Germany, France, the UK, the Netherlands, Finland, Sweden, Norway, and Denmark— effective February 1 .
The move is designed to pressure European leadership into a deal for the "complete and total purchase of Greenland." If an agreement is not reached by June 1, the President warned that these duties would spike to 25%.
Key Details of the Announcement
Effective Date: 10% tariffs begin February 1; 25% tariffs begin June 1.
Targeted Nations : A mix of EU members and non-EU allies (UK and Norway), specifically those perceived to have influence over or proximity to the Greenland issue.
The Objective : A formal acquisition of Greenland by the United States.
Current Status: The announcement remains limited to social media; no official White House policy directive or formal trade filing has been released to clarify the mechanics of the duties.
Context and Implications
This development marks a new low in the relationship between the U.S. and its European allies. By targeting not just Denmark—which holds sovereignty over Greenland—but also major neighbors like Germany and the UK, the administration appears to be employing a "maximum pressure" campaign against the region as a whole.
Uncertainty Remains
As with previous trade announcements made via social media, businesses and economists are left in a state of limbo. Without official communication from the Department of Commerce or the Office of the U.S. Trade Representative, it is unclear which specific goods will be targeted or how the tariffs will be reconciled with existing WTO rules or the US-UK trade frameworks.

Germany 40 Index – Volatility Increases on Tariff and Greenland Last Tuesday the Germany 40 registered a record high at 25521 (January 13th), which at that time was a gain of over 1050 points or 4.3% from opening levels at 24465 on January 2nd. A very impressive start to 2026 by all accounts.
Fast forward to this morning in Asia and the Germany 40 has just experienced a gap open lower, trading down to 24923 (at time of writing, 0730 GMT) in response to a major escalation in tensions between the US and EU over Greenland.
On Saturday, President Trump proposed new tariff levies on 8 European countries that have opposed his plans to buy Greenland, a plan he describes as a matter of US national security. These additional import tariffs of 10% would take effect on February 1 on goods from Denmark, Norway, Sweden, France, Germany, the Netherlands, Finland and GB.
As expected, this news was met with initial disbelief in Europe and then provoked a strong joint response from the EU who are considering retaliatory tariffs of their own on US imports, with further plans being draw up for additional countermeasures (reported on Bloomberg).
The prospect of a major trade war between the US and EU has the potential to hit export powerhouse Germany the hardest, with car makers and other key manufacturers only just starting to recover from last year’s tariff pains. For Germany 40 traders, it could also mean that while uncertainty around this issue persists, volatility may remain high with moves dominated by headlines on further developments from both the US and EU sides across this week.
For this reason, keeping apprised of the technical chart levels and trends could be useful for trade planning and decision making.
Technical Update: A Question of Extension Resistance Against Retracement Support
Political developments over the weekend have perhaps unsurprisingly put the Germany 40 index under early selling pressure this week. Prices opened lower as traders moved to square positions on this increased uncertainty following the latest advance, which had managed to produce a new all‑time high at 25521 (January 13th).
However, as the chart above shows, last week’s strength also challenged the 25476 level, a potential resistance aligned with the 38.2% Fibonacci extension. The failure to close above 25476 could also help to explain the current slowdown in upside momentum.
Much may now depend on whether potential support or resistance levels hold or give way, especially given that currently Germany 40 prices are already slipping toward 24886, which is the 38.2% retracement of the price strength from the December 18th low to the January 13th high, and a level that may act as the first support focus this week.
From a technical standpoint, the next directional moves for the Germany 40 index now could hinge on which level breaks first on a closing basis, the 24886 retracement support or the 25476 extension resistance.
Potential Resistance Levels:
With the recent strength capped and reversed by 25476 (38.2% Fibonacci extension), traders could be viewing this level as the initial resistance focus this week. As a result, closing breaks above 25476 might now be needed to signal scope for further attempts at price strength.
While a close above 25476 wouldn’t guarantee continued upside momentum, it could suggest further attempts at moves to higher levels. In new all‑time‑high territory, resistance becomes harder to define, but the next potential level could sit at 25914, which is the 61.8% extension.
Possible Support Levels:
While the 25476 resistance level remains intact on a closing basis renewed selling pressure could emerge, increasing the risk of fresh declines.
As the chart above highlights, the 24886 level (38.2% retracement) could serve as the first key support. A closing break below this level may signal scope for further downside toward 24689, which is the 50% Fibonacci retracement, and potentially even 24492, which is the deeper 61.8% retracement.
The material provided here has not been prepared accordance with legal requirements designed to promote the independence of investment research and as such is considered to be a marketing communication. Whilst it is not subject to any prohibition on dealing ahead of the dissemination of investment research, we will not seek to take any advantage before providing it to our clients.
Pepperstone doesn’t represent that the material provided here is accurate, current or complete, and therefore shouldn’t be relied upon as such. The information, whether from a third party or not, isn’t to be considered as a recommendation; or an offer to buy or sell; or the solicitation of an offer to buy or sell any security, financial product or instrument; or to participate in any particular trading strategy. It does not take into account readers’ financial situation or investment objectives. We advise any readers of this content to seek their own advice. Without the approval of Pepperstone, reproduction or redistribution of this information isn’t permitted.

Nikkei 225 - Looking for Completion LevelsCounting waves and assessing technical potential. Here’s what we see:
March 2009 - January 2018 - Wave 1 (range ≈ 17,400)
January 2018 - March 2020 - Wave 2
March 2020 - July 2024 - Wave 3 (range ≈ 26,100)
July 2024 - April 2025 - Wave 4
April 2025 - present - Wave 5 (already advanced ≈ 23,500)
Breaking down the current fifth wave:
We are also forming a fifth sub-wave within it.
Most probable targets for wave completion:
58,400
60,200
or within this range
Estimated upside potential from current levels: 8 - 12 %.
---
Please subscribe and leave a comment!
You’ll get new information faster than anyone else.
---

FTSE day trade So today the market opened quite bearish and it broke structure on a couple of timeframes, I daytrade on the 30 min and 1h chart and the FTSE is lining up for a good sell on that 10192.3 level, even if it doesn't sweep that level there is a high probability that it will fall towards the daily and weekly support level. There we will see either a range will form and those support levels will turn into ressistance or we will have a bounce and this was just a correction

ETHEREUM - Bullish market behavior pattern. Confirmation?BINANCE:ETHUSDT is forming a consolidation in the $3300 zone in a “descending wedge” pattern, which is a relatively bullish market behavior model.
The market is reacting to the improvement in the fundamental background, inflows of funds are increasing, and buyers are showing interest. Local trends are beginning to change for the better. After the rally, Bitcoin is trying to consolidate above 94-95K, and if it succeeds, we will have a green signal.
Ethereum is consolidating and fighting for the 3300 zone after implementing a U-formation pattern. Overall, there are signs of bulls in the market, and if buyers keep the price above 3300, the market will have an opportunity for growth.
The price is forming a descending wedge against the backdrop of a local bull market. A close above 3315 will be a confirming signal for growth.
Resistance levels: 3315, 3383, 3450
Support levels: 3300, 3281
The price has consolidated above 3300 and above 3315, as well as broken the resistance of the descending wedge. If the bulls keep the price above these key areas, another bull run may form...
Best regards, R. Linda!

EURAUD LIVE [7_January_16_2026]Monthly :
The Price is at the Monthly level , total of 7 months candle are rejecting the levels and sells are keeping the level strong.
Weekly :
The price making 4 tops at monthly level and 1 lower low and 1 lower high shows the down trend.
Daily :
The price is pullback to the daily level and 0.5 FIB level also align with this level.
6 candles are rejecting this level and follow by the engulfing bearish candle which is confirmation candle

FIB RETRACEMENT TOOLthis tool is highly accurate and recommended to use. do well to watch the video so as to note the key points before usuage.

BNB/USDT: Long Setup on Demand Retest (Discount Entry)On the OKX:BNBUSDT.P 1H chart, price has pulled back toward a key demand zone (green), which aligns with a clean discount area after the latest bullish leg. As long as this demand zone holds, I’m looking for a continuation move upward toward the grey target zone.
The structure remains bullish with higher lows forming, and the recent retracement provides a favorable entry opportunity. I will enter once price returns to the demand zone and shows reaction or bullish confirmation. My stop-loss is placed below the purple zone (structure invalidation level), and the upside target is the grey expansion zone.
Trade Plan
Entry: At the demand zone (green), looking for bullish reaction
Stop-loss: Below the purple invalidation zone
Target: Move into the grey target zone above
What I Expect Next
A retest of the green demand zone followed by continuation toward the higher target zone. If price breaks below the purple zone, the setup is invalid.

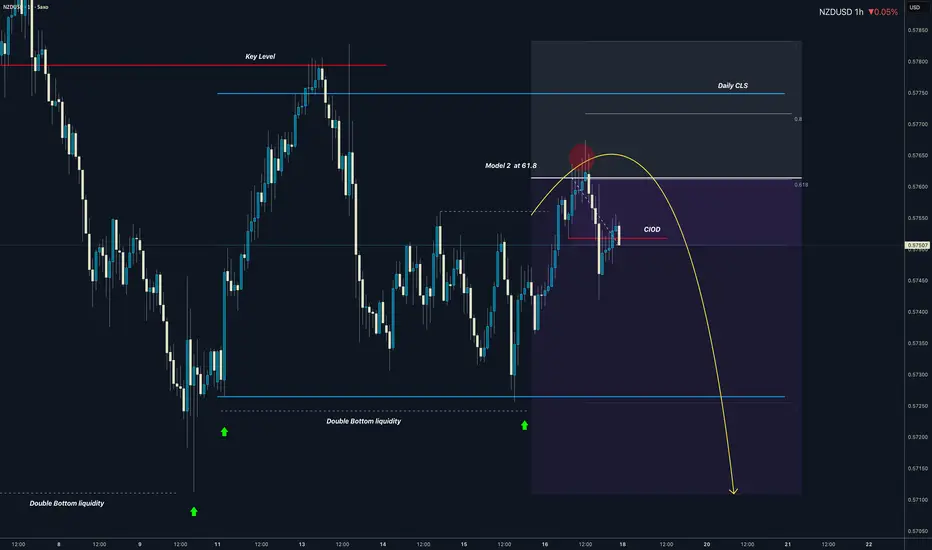
NZDUSD Daily CLS I Model 2 / KL - OB I TP - LowsHi friends, new range created. As always we are looking for the manipulation in to the key level around the range. Don't forget confirmation switch from manipulation phase to the distribution phase to make the setup valid. Stay patient and enter only after change in order flow. If price reaches 50% of the range take partial or full close.
👊 Trade Visual
I promised myself I’d become the person I once needed the most as a beginner. Below are links to a powerful lessons I shared on Tradingview. Hope it can help you avoid years of trial and error I went thru.
📊 Sharpen your trading Strategy
⚙️ 100% Mechanical System - Complete Strategy
🔁 Daily Bias – Continuation
🔄 Daily Bias – Reversal
🧱 Key Level – Order Block
📉 How to Buy Lows and Sell Highs
🎯 Dealing Range – Enter on pullbacks
💧 Liquidity – Basics to understand
🕒 Timeframe Alignments
🚫 Market Narratives – Avoid traps
🐢 Turtle Soup Master – High reward method
🧘 How to stop overcomplicating trading
🕰️ Day Trading Cheat Code – Sessions
🇬🇧 London Session Trading
🔍 SMT Divergence – Secret Smart Money signal
📐 Standard Deviations – Predict future targets
🎣 Stop Hunt Trading
💧 Liquidity Sweep Mastery
🔪 Asia Session Setups
📀 Gold Strategy
🧠 Level Up & Mindset
🛕 Monk Mode – Transition from 9–5 to full-time trading
⚠️ Trading Enemies – Habits that destroy success
🔄 Trader’s Routine – Build discipline daily
💪 Get Funded - $20 000 Monthly Plan
🧪 Winning Trading Plan
⭕ Backtesting vs Reality
🛡️ Risk Management
🏦 Risk Management for Prop Trading
📏 Risk in % or Fixed Position Size
🔐 Risk Per Trade – Keep consistency
🧪 Risk Reward vs Win Ratio
💎 Catch High Risk Reward Setups
☯️ Smart Money - Who control Markets
Adapt useful, Reject useless and add what is specifically yours.
David Perk
NQ Weekly analysis 1/18/2026Short idea is based on technical analysis and SPX gex exposure.
Essentially the main thesis is that we are due to sweep liquidity before going higher.
This week bearish -> followed by next week bullish to all time highs.
stop is 2.5x of ATR on 4-hour timeframe
take profit is at conservative price point.

BTC Bearish cycleAs I see it BTC we are going into a long term retracement below the 50% of the previous bullish range.
The price target is at OTE level (Optimal Target Entry)around 45.000$ .
BTC revolve in cycles ,bearish and bullish and it often ,almost always repeat the same price delivery at the same time.
The bearish cycle :
-365 day
The bullish cycle :
-around 1060 days
But how do I calculate?
Placing a Fib projection from the lower low to the higher high of the BEARISH range, once the leg(range) is broken(the higher have been taken , we can approximate our target as you can see in the image are pretty precise.
To find the bearish target ,always below 50% of the Bullish (explanation on image).
I do so expect to go into a big buy by this year October .
This is a fully technical and only analysis ,but long term calculations do not lie.
Let me know in the comments what you think about it.

XMRUSD Huge Potential?Buy in the green box then wait to the moon. Its 1-2 and after second wave it will go where sky isnt a limit

ADA/USDT 12h🔍 Market structure
Medium-term trend: corrective / sideways after an upward impulse
Price is moving in a narrowing channel (descending wedge/triangle)
Lower highs + held support → pressure before breakout
📐 Key levels
🟢 Resistances
0.407–0.410 – local resistance + upper structure line
0.426 – very important level (previous high + price reactions)
0.451–0.452 – strong HTF resistance (if an impulse occurs)
🔴 Support
0.384–0.385 – key support (if it falls → weak)
0.371
0.352
📊 Price Action
The last upward impulse was rejected exactly at the resistance of 0.426
Currently, the price is consolidating just above 0.384
Every move lower is bought, but there is no strong volume for growth
👉 The market is in compression - the breakout is getting closer.
📉 Stochastic RSI
Oscillator close to the oversold zone
No clear bullish crossover yet
This favors a rebound, but is not a confirmation of the long
🧠 Scenarios
✅ Bullish scenario (more technically correct)
Conditions:
Defense 0.384
Breakout above 0.407–0.410 (preferably close 12h candle)
Goals:
0.426
0.451
➡️ This would be a breakout from the wedge + continuation of the impulse
❌ Bear scenario
Conditions:
Candle close below 0.384
Goals:
0.371
0.352
➡️ This means negating the structure and returning to the range

Tokenisation of sterling ? Bullish long term on QNTUSD because of the triangle formation taking place
If we see a dip first back somewhere to old KLOS/R then would be a nice acumination zone ready for the next spring move back up after the crypto bear.
I can see that the symmetrical nature of the triangle is governed by prior fib moves and inflection points are thus predictable with greater levels of probability. So if this follows possible resting points in the bull trend are also by definition more likely to be predictable too
The fib extension tool is shown here as possible points.
I would also look at all the moves and apply fib levels to them to see where key levels are and over lay that too not shown on the drawing, but key points highlighted where inversions occurred at these fib points I would guess there are more but you get the point.
QNT rumored to be working to allow you to put sterling on to block chains directly.

NBIS | A.I. Centric Cloud Platform | LONGNebius Group NV is a technology company that provides infrastructure and services to AI builders worldwide. It offers Nebius AI, an AI-centric cloud platform provides full-stack infrastructure, including large-scale GPU clusters, cloud services, and developer tools. The company also operates through specialized brands: Toloka AI, which partners in data for generative AI development; TripleTen, an edtech platform focused on re-skilling individuals for tech careers; and Avride, which develops autonomous driving technology. Nebius Group was founded by Elena Kolmanovskaya, Ilya Segalovich, Mikhail Fadeev, and Arkady Volozh in 1989 and is headquartered in Amsterdam, the Netherlands.

Chumtrades XAUUSD H2 | Is the Liquidity Sweep Over?On Friday, the market reacted strongly after Trump’s comments regarding Kevin Hassett, when Trump expressed his preference for Hassett to remain in his current role rather than taking a new position.
👉 As a result, gold printed a long wick liquidity sweep back into the prior ATH zone, around 4530–453X, before closing back above 456X.
This brings us to the key question:
Was this sweep enough for the BUY side, or is the market still looking to test lower levels?
Political developments will be a key driver for gold direction in the coming week.
📰 Key Political Factors to Monitor
1. Trump – Greenland
The US has imposed 10% tariffs, with the possibility of increasing them to 25% on countries that do not support the annexation of Greenland
No fixed deadline, tariffs remain until Greenland becomes part of the US
→ This is a supportive factor for gold, especially amid rising geopolitical uncertainty
→ This news may directly impact the market open
→ If price reacts strongly, avoid SELLs near resistance
2. Iran – Protests
Monitor the risk of Trump returning to direct intervention
→ A potential headline-driven volatility trigger
🟢 Key Support Zones to Watch
4530 – 4535
4515 – 4510
4480 – 4482
4462
4410 – 4407
🔴 Key Resistance Zones to Monitor
4618 – 4628
4648 – 4650
4655 – 4660
4698 – 4699
⚠️ Trading Notes
Price levels are zones for observation, not instant entry points
SELL setups around 462X must be evaluated based on news reaction
If momentum accelerates on headlines → stay flat and avoid trading against strength
💬 Question for the New Week
Is the market finishing its liquidity collection on the BUY side,
or was Friday’s sweep the final test before the next leg higher?
📌 Follow www.tradingview.com for proactive market analysis, structured trade planning, and risk management insights.

PM | Tobacco On The Rise | LONGPhilip Morris International, Inc. is a holding company, which engages in the business of delivering a smoke-free future and evolving a portfolio for the long term to include products outside of the tobacco and nicotine sector. It operates through the following geographical segments: Europe Region (Europe), South and Southeast Asia, Commonwealth of Independent States, Middle East, and Africa Region (SSEA, CIS, and MEA), East Asia, Australia, and PMI Duty Free Region (EA, AU, and PMI DF), and Americas Region (Americas). The Europe segment includes all the European Union countries, Switzerland, the United Kingdom, Ukraine, Moldova, and Southeast Europe. The SSEA, CIS, and MEA segment focuses on South and Southeast Asia, the African continent, the Middle East, Turkey, Israel, Central Asia, Caucasus, and Russia. The EA, AU, and PMI DF segment is involved in the consolidation of international duty-free business with East Asia and Australia. The Americas segment is comprised of the United States, Canada, and Latin America. The company was founded by Philip Morris in 1847 and is headquartered in Stamford, CT.

