TCS | 2 hr | Post Earnings - is it going to hold or what next ?TCS | 2 hr | Post Earnings - is it going to hold or what next ?
Monitoring levels on both the sides to check the trading range !!!
Fibonacci

LTC is in a clear downward trend📉 MARKET STRUCTURE
Main Trend: Down
Sequence: Lower High → Lower Low
Price is moving in a clear downward channel.
Any upward breakout = correction, not a trend change.
📐 KEY LEVELS
🟩 RESISTANCES (sell zones)
84.50 – current S/R flip (was support → now resistance)
94.50 – strong HTF level, where the market has been rejected multiple times
107.50 – key trend reversal level (BOS)
🟥 SUPPORT
72.00–72.50 – key support, currently being tested
63.10 – next strong HTF support
Below → empty space to ~55–58
🔎 PRICE ACTION – WHAT YOU CAN SEE
Recent Bounce:
Weak HH
No volume
Strong rejection from:
Upper channel line
Level ~84.5
Current candle:
Aggressive supply
No demand response
👉 Sellers in full control
📊 STOCH RSI
Turnover from the upper zones
Bearish momentum
No bullish divergence
👉 Oscillator confirms continuation of the downtrend
🧠 SCENARIOS
🔴 BASELINE SCENARIO (60–65%)
Descent lower
Condition:
Close D1 below 72
Target:
63.1
Possible breakout to 60–61
🟡 CORRECTIVE SCENARIO (25–30%)
Bounce Technical
Condition:
Holding 72
Demand candle + follow-up
Target:
84.5
Maximum 94.5
DOES NOT change the trend
🟢 TREND REVERSE SCENARIO (<10%)
Condition:
Close D1 > 94.5
Then reclaim 107.5
👉 Only then can we talk about a bull market
🎯 HOW TO PLAY IT (technically)
Short:
Retest 84–85 or 94–95
SL: above the structure
TP: 72 → 63
Long:
Only a reaction to 63
Short-term scalp / swing
No forcing the low

UsdJpy SellThe trend is bullish, but the price always ends up making a pullback.
At this moment, confirmation of the pullback came with the Choch of the 4H fractal structure.
Price is using the 4H EMA as resistance, took liquidity in the 1H structure and reacted from a premium zone (50% Fibonacci).
The break of the 1H EMA shows alignment and increases the probability of bearish movements continuing - with the aim of taking internal liquidity from the 4H overall structure

NVTS: Uptrend from April lows may be complete Putting my late‑October NVTS update into a separate idea.
From the way the corrective structure off the October highs is developing, it increasingly looks like the entire advance from the April lows may be complete, with price likely having formed a mid‑term top. The ideal macro support zone to complete this full corrective cycle sits at 5.20–3.90.
In the near term, a move into the 6.97–5.70 area has a high probability of generating a bounce, but that bounce would most likely only create a larger‑degree lower high before the final leg down into macro support finishes the correction.
Chart:
Previously:
For my prior structure analysis from Aug–Oct, see the previous idea:

WTI Crude Oil Wave Analysis – 15 January 2026- WTI Crude Oil rising inside minor impulse wave (1)
- Likely to reach resistance level 965.0
WTI Crude Oil recently reversed down from the resistance zone between the resistance level 61.00 (former Double Top from November), upper daily Bollinger Band and the 50% Fibonacci correction of the downward impulse from September.
The downward reversal from the resistance zone is likely to form the daily Japanese candlesticks reversal pattern Evening Star Doji – if the price closes today near the current levels.
Given the strong daily downtrend, WTI Crude Oil can be expected to fall to the next support level 58.40 (former resistance from December).

USDJPY long setupPrice is a bullish structure on the daily.
On the 4hr TF we also have a bullish structure.
I then draw a fib (4hr) and price retraced to the golden zone.
Price then printed a bullish candlestick pattern inside the golden zone and on the daily KL.

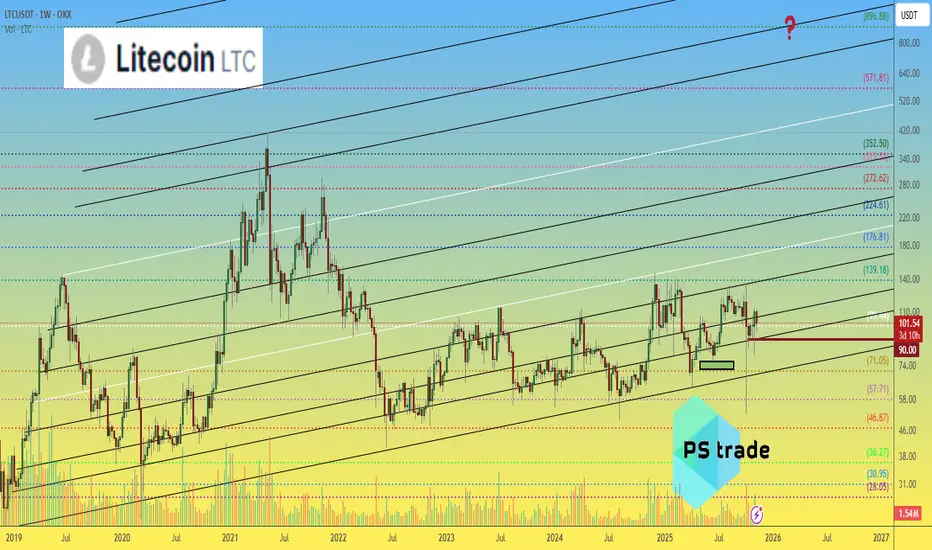
Litecoin LTC price analysis📉 For weeks, OKX:LTCUSDT has been holding strong
And guess what — this consolidation has lasted over 3.5 years! 😮
💭 The last real pump was back in early 2021... feels like it’s time for a sequel, right? 😉
Now, here’s the interesting part:
🔹 Litecoin has the same tokenomics and mining method as Bitcoin ( CRYPTOCAP:BTC ) and
🔹 Recently, another “old school” coin — CRYPTOCAP:ZEC — just pumped hard 💥
🔹 And there are rumors about a potential LTC ETF 😏
With a current market cap of only $7.7B, there’s plenty of room to grow.
So maybe... just maybe... CRYPTOCAP:LTC at $900 isn’t that crazy after all? 🚀
What do you think — are we on the verge of a new #Litecoin era? 👇
______________
◆ Follow us ❤️ for daily crypto insights & updates!
🚀 Don’t miss out on important market moves
🧠 DYOR | This is not financial advice, just thinking out loud
BULL: bullish potential NASDAQ:BULL is shaping up as a swing-long continuation setup off the macro support zone.
From a short-term perspective, as long as price holds above today’s low, the odds favor a push toward the 9 resistance level. A clean breakout above 9 would open the door for further upside toward 10 and 11.
Chart:
Weekly chart:

ETOR: in the macro support zoneNASDAQ:ETOR watching for the price to form at least a mid-term bottom in the macro support zone at 31.80–28.60.
Chart:

Fib extension and Property cycle 18.6 year going to tell us? Whilst dreaming of Caribbean beaches and beach huts drinking my tea flipping through chart books I came across this and thought to myself to let a few people know in the world one scenario.
Does the 18.6 property cycle apply here - go read up on this its a thing!
Can you use fib extensions to predict the top of the real estate market on individual instruments
If you look at the yield on the 10 year US interest rate chart that to me looks like we are going to increase, so hence interest rates environment of increased rates now. Which supports this view too
please see other posts too
Disclaimer: Any new friends living on cats in the Caribbean or have lovely beach huts / houses there that want to hang out and chat about charts are most welcome to reach out

GBPUSD Short Bearish Daily Bias H12/H1 w/ SMTDaily forecasting exercise
Bearish daily bias (TTrades Candle 3) off Higher Timeframe Key Level (Daily FVG)
Mechanical short entry model (H12 SFP -> H1 MSB)
Triple premium:
1. Above 0.5 of range
2. Above Previous Candle Range
3. Above Previous Swing Candle Range

Eurusd bullish?This count is based on my assumptions so anything can happen not a trading or financial advice just for educational purposes only kindly do your own ta thanks trade with care good luck.

OUST: bullish trend structureNASDAQ:OUST is acting constructively from the mid-term support zone outlined in the September analysis.
As long as price continues to close above 25.50, I’m watching for short- and mid-term upside continuation toward the 35 area and the low-40s resistance zone.
Potential swing-long parameters:
Risk/Stop level:
- partial: bellow 25.5
- full: bellow 24
Profit targets: 34-39 and 42
Chart:
Weekly:
Previously:
On macro trend structure (Sep 18):
www.tradingview.com
On mid-term consolidation (Sep 28):
www.tradingview.com

TSM watch $347-349 Major Resistance zone held the earnings SurgeTSM reported earnings beats across the board.
Surged into major resistance at $347.65-349.62
Look for a Break-n-Reteat or Dip-to-Fib to join.

XLI heads up into $165: Double Golden Fibs should give us a DIP Industrials have been strong as money rotates into them.
XLI is about to hit a Double Golden zone at $164.98-165.95
Look for a Break-n-Retest or Dip-to-Fib like $155.24 to buy.
.
See "Related Publications" for other examples of Double Goldens at work ------->>>>>>>

7202- deep retracement7202
- Price has retraced to 78% fib levels,
- narrowing down in a falling wedge,
- reaching a strong weekly/monthly support of 218.
- Showing bullish divergence on weekly TF.
CMP 221.
For swing trade, it would be good to accumulate with SL 215 on weekly closing basis.
For traders, wait for at least one green candle at support.
I expect it to rebound and hit trading targets 235-249
For reversal, it needs to close above 272.

2026-01-15when there is a fast reaction on the box , it's usually retail jump in , since retail don't wait for confirmation and structure
on the 5 min the box showed bullish wicks , not it did break that
grab the retail SL this could reverse down
but need more 5 min confirmation

Selena | XAUUSD - Highest Possiblities of Bullish ContinuationFOREXCOM:XAUUSD PEPPERSTONE:XAUUSD
After rejecting from the upper channel resistance, XAUUSD pulled back into a confluence zone consisting of institutional demand and trend support. This corrective move appears corrective rather than distributive, indicating preparation for further upside continuation rather than reversal.
Key Scenarios
✅ Bullish Case 🚀
As long as price holds above the institutional demand zone, bullish continuation remains favored.
🎯 Target 1:4550
🎯 Target 2:4600 Psychological resistance / Fib extension
❌ Bearish Case 📉
A clean breakdown and sustained close below trend support would invalidate the bullish bias and signal deeper correction.
Current Levels to Watch
Resistance 🔴: Psychological zone near highs
Support 🟢: Institutional demand + channel support
⚠️ Disclaimer: This analysis is for educational purposes only. It is not financial advice.

GOLD – Trading Analysis 🟡 GOLD – Trading Analysis (Intraday / Elliott Wave)
📍 Market Structure:
Gold is currently trading within a bullish sub-structure. The prior zigzag correction has been completed, and price is now in the process of building the 10-wave structure while developing Wave 1 to the upside.
⚠️ Key Condition – Setup Confirmation
✅ This trading setup is only valid and comes into consideration if price continues to rise and reaches the target area above 4,633 USD.
📌 Only above 4,633 USD:
the completion of Wave 1 is confirmed 📈
the bullish structure is validated
any subsequent pullback can be classified as Wave 2 (corrective)
Without this upward expansion, the setup is NOT active ❌
🔼 Expected Price Path
➡️ Move higher toward ≥ 4,633 USD
➡️ Completion of Wave 1 / 10-wave structure
➡️ Corrective pullback (Wave 2)
➡️ Long entry from support
➡️ Strong impulsive rally (Wave 5) 🚀
🎯 Trading Setup (Long)
🟢 Entry
📍 4,594 USD
➡️ Long entry only after price has expanded above 4,633 USD
➡️ Entry is taken from the Wave 2 corrective pullback
🛑 Stop-Loss (SL)
⛔ 4,588 USD
➡️ Tight stop below the structural support
➡️ Protects against a bullish structure failure ⚠️
💰 Take-Profit (TP)
🎯 4,706 USD
➡️ Target of the impulsive Wave 5 move
➡️ Projected resistance / extension zone
🧠 Summary
🔹 No anticipation trade
🔹 Setup activates only after acceptance above 4,633 USD
🔹 Strategy: buy the correction, not the breakout high 🧠📈

2026-01-15wait for structure
-if the 5 min provides a good entry , but will be patience on this zone

Silver – Volatility Continues After New Record HighThe main chart attached to this post highlights the impressive rally in Silver that has taken place since late November when this increasingly popular metal was trading around 53.50. Move forward to today and Silver just printed a new record high of 93.513, that’s a gain of 74.7% in just a short 7 weeks.
Now, this hasn’t been an isolated move, base and precious metals have been experiencing strong demand as part of an on-going shift towards key commodities on expectations of further Federal Reserve (Fed) interest rate cuts and hopes of increased demand from China as authorities seek to boost growth.
More specifically for Silver, the latest up move seems to have been driven by an escalation of a political challenge by the Trump administration to the independence of the Fed, with the Department of Justice convening a grand jury to consider criminally indicting Chairman Jerome Powell, alongside an increase in geo-political tensions in Iran, where violent protests have irrupted countrywide which have threatened the authority of the reigning Islamic regime and drawn the attention of President Trump.
However, trading in Silver remains extremely volatile, with prices slipping back below $90 again (88.95 – 0630 GMT), assisted by news that the US have currently decided against imposing tariffs on critical minerals, although they remain on the table for later in the year.
While a further period of consolidation or a correction to the downside could be considered healthy, whether it can happen from this point may depend on how these events impact positioning into the weekend and early next week. The technical backdrop could also be an important consideration.
Technical Update: New All-Time Highs Maintain Upside Momentum
It’s hard to overlook a market that continues to post new all‑time highs as Silver and Gold have done recently. In Silver’s case, the brief pullback from December 29th to the December 31st low again only proved to be a limited correction. Buying support emerged again, and this week the market pushed through the previous high at 83.941 (December 29th) on a closing basis.
Some traders may conclude from this latest price activity that Silver continues to display positive underlying themes, potentially paving the way for further strength. However, in the current on-going volatile environment staying alert to potential support and resistance levels remains prudent, both for identifying where the next resistance might slow or even reverse the price advance, and for judging whether any emerging weakness is another limited correction within the uptrend or the start of a deeper decline.
Possible Resistance Levels: .
It’s fair to say that during the latest advance, resistance levels have not been particularly effective, with each potential barrier breached as prices pushed higher. Even so, this behaviour provides useful clues about the sustainability of the move as successful breaks above resistance can signal scope for further upside toward the next key levels.
For Silver, Fibonacci extension calculations based on the late December correction suggest that the latest price strength could be approaching a potential resistance at 97.781, which is the 100% extension level. A closing break above 97.781 may be required to indicate scope for higher levels, with potential toward 103.102, which is the 138.2% level, possibly further if this level also gives way on a closing basis.
Possible Support Levels:
It’s often difficult to judge with certainty when upside conditions have become over‑extended, and this alone doesn’t guarantee a pullback. As a result, a closing break below support is typically needed to suggest a deeper corrective phase. For Silver, traders may now view 84.569, which is the 38.2% Fibonacci retracement, as the first key level.
A closing break below 84.569, while not signalling an end to the broader positive backdrop, may allow price weakness to emerge. A break lower could point toward a test of the next support at 81.867, which is the 50% Fibonacci retracement, potentially extending down to 79.165, which is the deeper 61.8% retracement level.
The material provided here has not been prepared accordance with legal requirements designed to promote the independence of investment research and as such is considered to be a marketing communication. Whilst it is not subject to any prohibition on dealing ahead of the dissemination of investment research, we will not seek to take any advantage before providing it to our clients.
Pepperstone doesn’t represent that the material provided here is accurate, current or complete, and therefore shouldn’t be relied upon as such. The information, whether from a third party or not, isn’t to be considered as a recommendation; or an offer to buy or sell; or the solicitation of an offer to buy or sell any security, financial product or instrument; or to participate in any particular trading strategy. It does not take into account readers’ financial situation or investment objectives. We advise any readers of this content to seek their own advice. Without the approval of Pepperstone, reproduction or redistribution of this information isn’t permitted.

GOLD - The battle for 4600 within the great consolidation...FX:XAUUSD is testing the 4581 zone as part of a correction, forming an intermediate bottom and consolidating above 4600, indicating a confident bullish trend.
PPI showed growth in November, retail sales exceeded expectations, and the unemployment rate fell to 4.4% in December, which slightly reduces the likelihood of an early easing of Fed policy, putting pressure on gold.
Geopolitics: Tensions between the US and Iran, as well as around the independence of the Fed. Risks are high...
Today, data on US unemployment benefit claims will be released. High figures could reinforce fears of an economic slowdown and support gold.
The short-term correction in gold is due to strong data from the US, but the upward trend remains influenced by geopolitics and pressure on the Fed. Weak employment data could bring the price back to record levels.
Resistance levels: 4612, 4630, 4643
Support levels: 4600, 4581, 4561
Consolidation is forming against the backdrop of a bullish trend. The market is likely to test 4581-4561 as part of profit-taking or correction before continuing to grow. However, if the bulls keep the price above 4600, growth may begin earlier...
Best regards, R. Linda!

Possible M pattern on GBPAUD for quick one, confirmation neededPossible M pattern on GBPAUD for quick one, confirmation needed
M pattern completed
Trend Line
Support
