WDC - Revisiting the ChartIn the previous idea, we didn’t see a deep correction at the designated targets; the chart moved upward.
Let’s look at what could happen next. So far, only the 3rd wave is complete, and we’re now drawing the 5th wave to finish the move. The correction looks like a running flat .
We can’t be completely certain about the exact point where the correction ended, so the final scenario isn’t clear. Still, we’ll focus on the most likely scenario. Unlike Sandisk, where the chart is straightforward, here things are less obvious
Key targets to complete the movement: 210 and 241 (possibly higher).
Less likely scenario:
With 210 already reached, the movement is complete. The correction is wrapping up, and then the price is expected to drop.
More likely scenario:
Heading towards 241 .
The movement after the correction overlaps the first wave - this happens in a fifth wave, which means we are drawing a wedge (ending diagonal).
Alternative scenario:
Heading well above 241 .
Conclusion:
Most probable target for completing the movement: 241
Pattern of the movement: wedge .
---
Please subscribe and leave a comment!
You’ll get new information faster than anyone else.
---
Fibonacci

SPX/ES - Bayesian Market thesis 📊 SPX / ES — Bayesian Market Thesis (Academic Summary)
🎯 Objective
Frame current market conditions using a probabilistic research process, not directional prediction, with emphasis on regime identification and invalidation logic.
🧠 Research Methodology (High-Level Transparency)
Our process integrates multiple, independent analytical domains into a single probabilistic view:
Probabilistic inference
We evaluate competing market regimes and assign likelihoods that update as new information emerges.
Market structure analysis (Modern Wyckoff)
Focus on acceptance vs rejection, testing behavior, and transitions between accumulation, markup, distribution, and markdown.
Flow & derivatives context
Options-related positioning and transaction flow are used to understand how positioning may shape price behavior, not to forecast direction.
Classical technical structure
Trend quality, range behavior, and relative location within recent value are used as structural constraints.
These inputs are cross-validated. No single signal determines the thesis.
🧱 Current Structural Context (Wyckoff Lens)
Price is operating near upper range boundaries
Multiple high-area tests with reduced follow-through
Structure consistent with late markup transitioning into distribution risk
➡️ Upside continuation is conditional, not assumed.
📐 Bayesian Scenario Assessment
Probability-weighted view (dynamic):
Regime Probability Characteristics
🔴 Distribution / Downside Rotation ~60–65% Failed acceptance, rotational volatility
🟢 Bullish Continuation ~35–40% Requires sustained acceptance above highs
Probabilities adjust as price resolves uncertainty.
🚦 Invalidation Criteria (Bullish Reassessment)
The current thesis is invalidated only by structural confirmation, not isolated price excursions.
Required conditions:
Sustained acceptance above range highs
Higher high followed by a higher low holding above prior resistance
Expansion in range and follow-through consistent with demand-led control
Absent these, upside moves are treated as tests, not confirmations.
🧭 Interpretation Guidance
This is a location- and regime-based assessment
Elevated prices increase sensitivity to invalidation signals
Risk management outweighs conviction in late-cycle structure
🧩 Closing Note
This framework is designed to continuously update expectations, not predict outcomes.
Markets resolve uncertainty first — direction follows.

QQQ – Weekly Update | Breakout Being TestedThesis
QQQ remains in a late-stage bullish structure. Price is testing the upper boundary of a bullish wedge, with Wave 5 still the primary scenario while key supports hold.
Context
- Weekly timeframe
- Long-term bull trend intact
- Market approaching the final phase of the broader cycle
What I see
- Price tested the wedge breakout level twice this week
- Weekly close held right on the breakout line near $623
- 50-day MA has now been tested and appears to be flipping to support
- Structure remains compressive, not distributive
What matters now
- Breakout level needs to be clearly flipped to support to confirm continuation
- Market is not pricing near-term event risk (tariff ruling next week) as bearish
- As long as price holds above the $600 area, upside structure remains intact
Buy / Accumulation zone
- No aggressive adds at current levels
- Long-term accumulation remains near the $440 area (200WMA confluence)
Targets
- Primary Wave 5 reference: $720–$725 area (2.618 Fib)
Risk / Invalidation
- Loss of $600 and failure to hold the wedge breakout would shift the structure to consolidation

Usd oil It's updated analysis, it may be w5 of w(3) w (c) Or w(5) (c), need confirmation for that but 60.504 is invalidation point for this entire w(c). Time wise it's appear w(c) . Let see,
Disclaimer- I am not sebi registered person and it is not buy sell recommendation.

Gold LongM & W: Uptrend, respecting the lows
D: Uptrend, price retraced 38.2% and made a higher low
4H: Uptrend, price retraced 78.6%
1H: Uptrend, price retraced 38.2% on H1 FIB and hitting resistance
CURRENTLY: Price is still in an uptrend. Lower timeframe FIB @ -61.8 matches higher timeframe TP @ -27%
I am looking for price to continue long to previous high this week

Bitcoin: Coldest Winter EverBitty the Butcher returns soon.
With Bitcoin nearing the completion of its all-time double zig-zag wave, it is likely soon due to embark on the most notorious descent in the history of finance.
Previously, it was my expectation that Bitcoin would slap $350K+ before gassing out, however, the waves are indicating differently as of late.
For the past 3 years, I've thought that Bitcoin would drop below $10 after its current pump finished. I think very strongly that the time comes soon.
After a 17-year pump, I believe this drawdown can last anywhere between 5-8 years.

DAX - Up for nowCounting waves and assessing technical potential. Here’s what we see:
October 2020 - Completed the correction and started forming the 5th wave of the uptrend.
November 2025 - Making the final push, forming the last sub-wave 5 within the larger wave.
Key reversal level sits near 28,300 .
Note: this level coincides with the Fibonacci levels where the first wave ended in March 2000 .
Key targets:
Trend reversal expected at 28,300
Local correction at 26,900
Additional reversal points at 29,300 / 31,200
---
Please subscribe and leave a comment!
You’ll get new information faster than anyone else.
---

EURUSD| Institutional Narrative - Weekly (12th JAN - 16th JAN)
WEEKLY NARRATIVE: FX:EURUSD ARCHITECTURE 🦅
Market Condition: Bearish Orderflow Delivery State: Non-Correlated Price Delivery
The Macro View: We are currently navigating a divergence in price delivery. While the primary Draw on Liquidity (DOL) remains at the 1.17900 - 1.18100 levels, the prevailing Bearish Orderflow makes a direct sweep of those highs highly questionable for the early week.
The Roadmap:
Mon-Tue Phase: Expecting a continuation lower. Price is likely to seek Sell-Side Liquidity (SSL) within the 1.16000 - 1.15800 zone.
The Pivot: Once the lower targets are mitigated, we look for a corrective shift.
The Retracement: A move back into the 1.16900 - 1.17200 premium array to rebalance.
Architect’s Note: Do not marry the bias. The non-correlated nature of the current delivery means we must wait for displacement before confirming the retracement leg.
Happy Trading. @HSK_FX

Gold long
CURRENTLY: Price was in a downtrend on lower timeframe. It retraced 38.2% and hit -27% on minor fib. Price reversed, broke minor structure to make a higher high.
I am looking for a retest of minor trendline and continue long to previous high

UROY | Nuclear Energy Sources Will Rise | LONGUranium Royalty Corp. operates as an exploration company, which engages in acquiring and assembling a portfolio of royalties, and investing in companies with exposure to uranium and physical uranium. The company was founded by Amir Adnani on April 21, 2017 and is headquartered in Vancouver, Canada.

BNB – Upside Target 🎯 BINANCE:BNBUSD The cycle from the November low remains in progress, unfolding within an impulsive C leg.
Price is aiming toward the equal legs area at $955 – $988, where another pullback is likely to take place.
#binance #cryptomarket #altcoins #elliottwave

GOLD MIGHT RETRACE THIS 2026!Gold is likely to retrace this year. Speaking from price action perspective, we’ve seen a massive surge in price since 2022 till date and price hasn’t made any form of pullback. Price is at its peak, the greed level is extremely high. I believe price will retrace to at least 37.2% fibo retracement level. With that being Said, we’d be monitoring the daily timeframe for a time price will shift bearish so that we’ll begin to take advantage of this opportunity. However global trend remains bullish there’s risk of pullback.

Bitcoin Reloading for the Next Leg HigherIn my previous analysis, I anticipated that price would surge toward 125,868, which has since played out successfully.
🔗 Reference:
Currently, price is trading just above a key support level, which has already been respected multiple times in the past — reinforcing its technical significance.
The nearest resistance zone is located around 105,000. A confirmed breakout and sustained acceptance above this level would likely open the door for the next impulsive move higher.
If bullish momentum continues, price may begin a broader expansion phase toward the projected 161.8% Fibonacci extension, aligning with the long-term target near 228,093.48, as marked on the chart.
As always, patience and confirmation are key. A clean breakout with volume support will strengthen the bullish continuation scenario.
📌 Trade responsibly and manage risk accordingly.
Happy Trading 📈

XAUUSD H4 – Gold Trading Plan for Next Week (Liquidity-Based Levels)
Gold is heading into a key decision week as price returns to a major reaction area. The market is currently best traded by waiting for liquidity reactions at the highlighted zones, rather than chasing moves in the middle of the range.
1) H4 Technical Context
Price has recovered and is now retesting a key pivot region around the 4.45xx area.
The chart shows clear supply zones overhead, while the 4445–4449 zone stands out as the highest-probability buy reaction area.
If price holds this buy zone, the preferred path is continuation higher toward the upper supply region near 4632–4637.
2) Key Levels to Watch
Main BUY zone: 4445 – 4449
Liquidity confluence area with strong probability of bullish reaction if structure remains intact.
Mid resistance: 4550 – 4560
A reaction zone where buyers may take partial profits and where price behaviour matters.
Target SELL zone (scalping): 4632 – 4637
Strong overhead supply. Ideal for short-term sell reactions if price rallies sharply and shows rejection.
Strong support: around 4408
If the main buy zone fails, this level becomes the next key area that defines whether the pullback deepens.
3) PRIORITY SCENARIO – Main Plan (Buy with Structure)
Next week’s primary strategy remains trend-following, but execution should be level-based.
Buy area: 4445–4449
Best confirmation: H4/H1 candles hold the zone and close back above it without a strong breakdown.
Upside expectations: push toward 4550–4560 first, then extend toward 4632–4637.
4) ALTERNATIVE SCENARIO – If the Buy Zone Fails
If price breaks 4445–4449 cleanly and accepts below it:
A deeper correction can develop toward 4408 and potentially lower.
In that case, the plan is to wait for a clear reaction at support before looking for the next long setup.
5) SELL Scenario – Short-Term Only
Selling is not the primary strategy. It is only considered as a short-term scalp at premium supply.
Sell zone: 4632–4637
Only sell on clear rejection signals such as strong wicks, failed breakout, or a lower-timeframe structure shift.
6) Weekly Summary
Focus zone: 4445–4449 is the key decision area
Hold above it → prefer BUY toward 4550–4560 and 4632–4637
Lose it → watch 4408 for deeper correction reaction
Sell ideas are scalps only at the upper supply zone

SolanaBINANCE:SOLUSDT is currently trading within a well-defined range after a prior impulsive move.
Price is approaching a key decision area, where reaction from the current consolidation zone will be important for further context.
A bullish scenario would require acceptance above the range high, which could open the way toward higher-timeframe resistance levels.
Alternatively, failure to hold the current structure may lead to a deeper pullback toward lower demand zones.
At this stage, price remains range-bound, and further confirmation is needed before directional continuation.

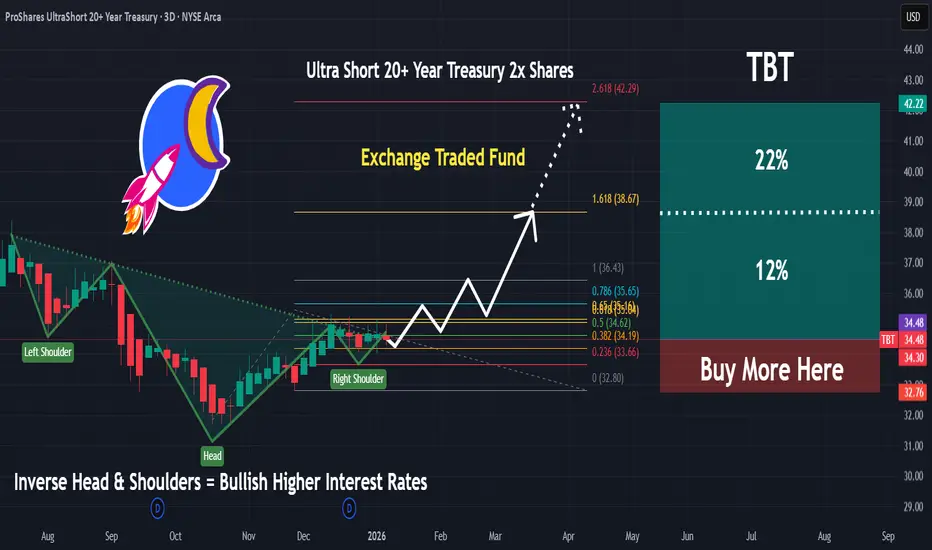
TBT | Expect Interests Rates To Surge | LONGProShares UltraShort 20+ Year Treasury seeks daily investment results, before fees and expenses, that correspond to two times the inverse (-2x) of the daily performance of the ICE U.S. Treasury 20+ Year Bond Index. The fund invests in financial instruments that ProShare Advisors believes, in combination, should produce daily returns consistent with the fund's investment objective. The index includes publicly-issued U.S. Treasury securities with minimum term to maturity greater than or equal to twenty years and have $300 million or more of outstanding face value, excluding amounts held by the Federal Reserve. The fund is non-diversified.
BTC IDEA If BINANCE:BTCUSDT.P holds above the 93,400–86,000 support zone, upside targets remain at 99,000, 108,000, and 116,000.
A sustained move below 84,000 would open the way toward the 2025 year demand zone around 80,600 and 74,450.

CVX | Houston, We Have A Problem | LONGChevron Corp. engages in the provision of oil and gas energy solutions. It provides crude oil and natural gas, manufactures transportation fuels, lubricants, petrochemicals, and additives, and develops technologies that enhance business and the industry. It operates through the Upstream and Downstream segments. The Upstream segment consists of the exploration, development, and production of crude oil and natural gas, the liquefaction, transportation, and regasification associated with liquefied natural gas, the transporting of crude oil by major international oil export pipelines, the processing, transporting, storage, and marketing of natural gas, and a gas-to-liquids plant. The Downstream segment consists of the refining of crude oil into petroleum products, the marketing of crude oil and refined products, the transporting of crude oil and refined products by pipeline, marine vessel, motor equipment, and rail car, and the manufacturing and marketing of commodity petrochemicals and plastics for industrial uses and fuel & lubricant additives. The company was founded on September 10, 1879 and is headquartered in Houston, TX.

Crude Oil at Make-or-Break ZoneCrude Oil – 4 Hour Timeframe Technical View.
Crude Oil is currently trading near a critical resistance zone, making the next move important from a directional perspective.
Resistance Zone: 5400 – 5500
Upside Scenario:
A decisive breakout above the resistance zone could trigger further upside momentum with potential targets at:
5650 → 5870 → 6100
Downside Scenario:
If the resistance zone holds and price shows rejection, a corrective move may be seen toward:
5260 → 5170
Major Support Zone: 5000 – 5050
Thank You !!

WULF Macro analysis | The bigger picture | Long-term holdersNASDAQ:WULF
🎯 Price appears exhausted at the upper channel boundary. The Elliot wave pattern completes a leading diagonal, which hints at higher to go, but after a deep wave 2 pullback, which could end at the 0.382 Fibonacci retracement, $8, but a more likely target is the 0.5 Fib at $5.84 with downside momentum, also the weekly 200EMA.
Breaking out above the channel would change the count and structure and be very bullish.
📈 Weekly RSI is oversold with no divergence and can remain here for months as price keeps increasing.
👉 Analysis is invalidated if we close back above $18
Safe trading

RIOT Macro analysis | The bigger picture | Long-term holdersNASDAQ:RIOT
🎯 Riot tested the upper boundary trend-line after its breakout. Expected behaviour. The uptrend is intact with price above the weekly 200EMA and pivot. Price appears to be in a wave 3 with a target of $40, the R£ weekly pivot.
📈 Weekly RSI has hidden bullish divergence at the EQ
👉 Analysis is invalidated if we close below $6.33
Safe trading

MSTR Macro analysis | The bigger picture | Long-term holdersNASDAQ:MSTR
🎯 Sentiment is low, the asset is hated and misunderstood by TradFi and retail. It’s a recipe for a bottom! Price is now below the weekly 200EMA and pivot, in wave 4, hitting the 0.382 Fibonacci retracement. The bears are in control.
📈 Weekly RSI hit oversold with hidden bullish divergence
👉 Analysis is invalidated if we close back below $101
Safe trading

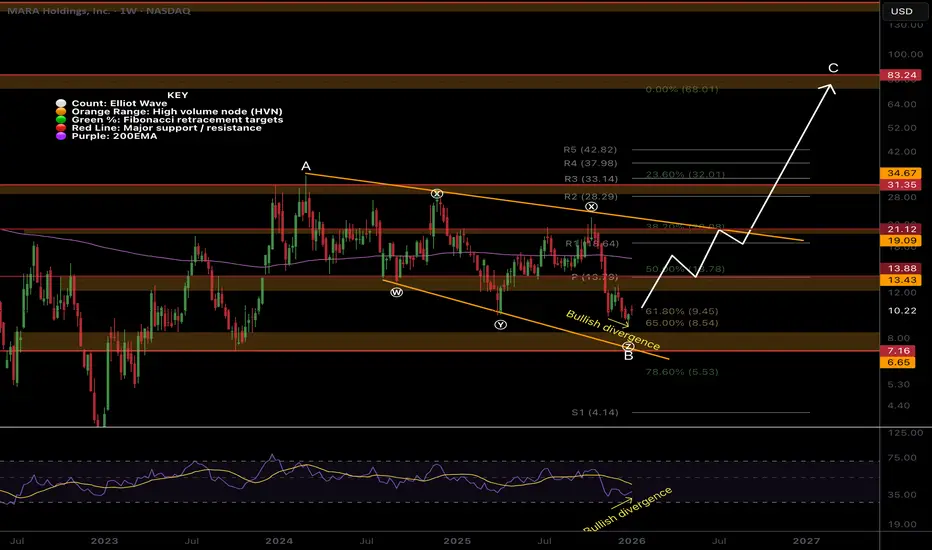
MARA Macro analysis | The bigger picture | Long-term holdersNASDAQ:MARA
🎯 Mara remains at the golden pocket support and channel lower boundary. It is below the daily pivot and 200EMA, showing the bears are in control. Price appears to be in an Elliot wave B, restricting upside targets to the 1:1 Fibonacci extensions at $106.
📈 Weekly RSI is nearing oversold with room to fall but has bullish divergence
👉 Analysis is invalidated if we close back below wave (II), $3.07
Safe trading